
the Creative Commons Attribution 4.0 License.
the Creative Commons Attribution 4.0 License.
 | 23 Jan 2026
Towards Constraining the Drivers of Variability and Trends in Subantarctic Productivity
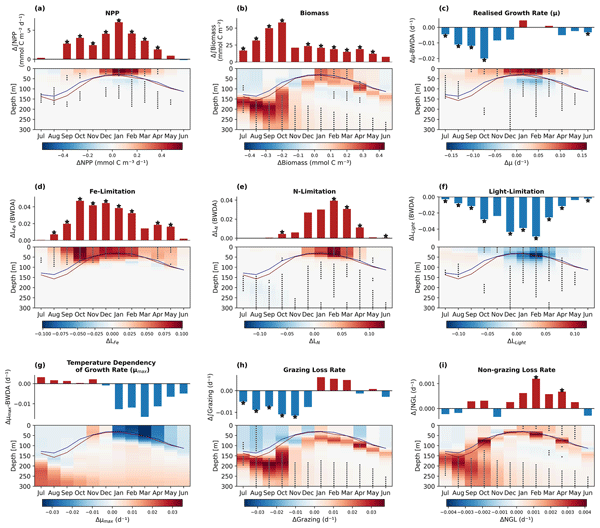
Abstract. The subantarctic Southern Ocean is a climatically important region, where primary production largely drives the seasonal uptake of atmospheric CO2, contributing to the sequestration of anthropogenic carbon emissions. Seasonal iron and light limitation control annual net primary production (NPP) in this region, but the explicit mechanisms that drive interannual variability in NPP remain elusive due to sparse observations. This uncertainty is reflected in inconsistent interannual variability and trend estimates of remotely-sensed NPP algorithms. Without clear mechanistic underpinning, confidence in remotely-sensed NPP trends remains low and hinders predictive capability. To overcome observational limitations and better understand the drivers of interannual NPP variability, we analyse the explicit bottom-up and top-down controls of depth integrated NPP in a biogeochemical ocean model historical run (1958–2022) from the Indian sector of the subantarctic zone. The highest NPP years were primarily driven by increased relief of iron limitation, with iron supplied from both deeper mixing in winter/spring and enhanced remineralisation in summer. In spring, higher phytoplankton growth rates were decoupled from surface biomass, such that years with higher NPP were due to faster growth in the mixed layer. Faster growth rates emerged following deeper winter mixed layers, driving phytoplankton distributions deeper in winter and reducing mixed layer grazing loss rates in spring. This generated a predator-prey dynamic favouring surface biomass accumulation moving into summer. Thus, inconsistent remote-sensing NPP estimates may derive from how algorithms link biomass (rather than growth rates) to NPP. We applied our analysis to CMIP6 models, and while all historical simulations converged with respect to positive trends in NPP, bias from sea surface temperature trends influenced the mechanisms driving interannual NPP variability. These findings show that interacting top-down and bottom-up processes can decouple changes in NPP with respect to phytoplankton biomass, which has important implications for remote sensing NPP estimates based on biomass. Therefore, the need for cautionary approaches to NPP trend interpretation is highlighted, and that further observational data are needed to ground truth mechanistic understanding of NPP drivers.
-
Notice on discussion status
The requested preprint has a corresponding peer-reviewed final revised paper. You are encouraged to refer to the final revised version.
-
Preprint
(3094 KB)
-
The requested preprint has a corresponding peer-reviewed final revised paper. You are encouraged to refer to the final revised version.
- Preprint
(3094 KB) - Metadata XML
- BibTeX
- EndNote
- Final revised paper


Journal article(s) based on this preprint
Interactive discussion
Status: closed
-
RC1: 'Comment on egusphere-2026-44', Anonymous Referee #1, 18 Feb 2026
-
AC2: 'Reply to RC1', Christopher Traill, 18 Jul 2026
Referee is thanked for their highly constructive feedback which has improved the quality and accessibility of the manuscript.
Please find the detailed responses to major and minor comments in the attached response which include supporting figures, text and references.
-
AC2: 'Reply to RC1', Christopher Traill, 18 Jul 2026
-
RC2: 'Review of 'Towards Constraining the Drivers of Variability and Trends in Subantarctic Productivity'', Anonymous Referee #2, 24 Jun 2026
The manuscript "Towards Constraining the Drivers of Variability and Trends in Subantarctic Productivity" by Traill et al. investigates the environmental drivers of net primary production in the SOTS region using a combination of remote-sensing-based NPP estimates, the intermediate-complexity ocean biogeochemical model PISCES, and CMIP6 model outputs.
The manuscript first examines discrepancies among satellite-based algorithms in identifying the drivers of high-NPP versus low-NPP years in the study area. It then explores the same question using an ocean biogeochemical model. The use of model output provides additional insight into the mechanisms driving NPP variability, including aspects of top-down control that cannot be captured by satellite algorithms alone. Finally, the discussion places these findings in the broader context of projected NPP trends from climate model simulations.
Overall, this is a well-written manuscript and a valuable contribution to the growing literature on the drivers of NPP variability and long-term trends in the Southern Ocean. The study fits well within the scope of Biogeosciences, and I enjoyed reading the manuscript and following its study design.
Suggested revisions
- Data availability and reproducibility
I checked the data availability and analysis code. With the exception of the PISCES-QUOTA-FE output, all datasets and code appear to be accessible. The PISCES-QUOTA-FE output is currently listed as restricted access on Zenodo. To ensure full reproducibility of the study, it would be important for this dataset to be made publicly available prior to publication.
- Placement of the CMIP6 results
While the methods and results are clearly presented, and the findings are effectively discussed in Sections 4.1 and 4.2, I found the placement of the CMIP6-related results somewhat unusual. Figures 8–11 are presented within Discussion Section 4.3 rather than in the Results section. This makes the narrative more difficult to follow and, in my view, disrupts the overall flow of the manuscript. I suggest moving the CMIP6 analyses and associated figures to the Results section and using Section 4.3 to synthesize the findings from the satellite products, the biogeochemical model, and the CMIP6 projections.
Citation: https://doi.org/10.5194/egusphere-2026-44-RC2 -
AC1: 'Reply to RC2', Christopher Traill, 18 Jul 2026
Referee 2 is thanked for their positive feedback and constructive suggestions for the manuscript. Model output is available on reasonable request to co-author Tagliabue. The CMIP6 results from Figure 11 have been moved to the results section, while Figure 10 has been moved to the appendix. Text is added to the Results section to integrate the CMIP6 results in the context of PISCES-QUOTA_FE results. Please find attached our detailed response to RC2 comments.
-
AC1: 'Reply to RC2', Christopher Traill, 18 Jul 2026
Peer review completion


Interactive discussion
Status: closed
-
RC1: 'Comment on egusphere-2026-44', Anonymous Referee #1, 18 Feb 2026
-
AC2: 'Reply to RC1', Christopher Traill, 18 Jul 2026
Referee is thanked for their highly constructive feedback which has improved the quality and accessibility of the manuscript.
Please find the detailed responses to major and minor comments in the attached response which include supporting figures, text and references.
-
AC2: 'Reply to RC1', Christopher Traill, 18 Jul 2026
-
RC2: 'Review of 'Towards Constraining the Drivers of Variability and Trends in Subantarctic Productivity'', Anonymous Referee #2, 24 Jun 2026
The manuscript "Towards Constraining the Drivers of Variability and Trends in Subantarctic Productivity" by Traill et al. investigates the environmental drivers of net primary production in the SOTS region using a combination of remote-sensing-based NPP estimates, the intermediate-complexity ocean biogeochemical model PISCES, and CMIP6 model outputs.
The manuscript first examines discrepancies among satellite-based algorithms in identifying the drivers of high-NPP versus low-NPP years in the study area. It then explores the same question using an ocean biogeochemical model. The use of model output provides additional insight into the mechanisms driving NPP variability, including aspects of top-down control that cannot be captured by satellite algorithms alone. Finally, the discussion places these findings in the broader context of projected NPP trends from climate model simulations.
Overall, this is a well-written manuscript and a valuable contribution to the growing literature on the drivers of NPP variability and long-term trends in the Southern Ocean. The study fits well within the scope of Biogeosciences, and I enjoyed reading the manuscript and following its study design.
Suggested revisions
- Data availability and reproducibility
I checked the data availability and analysis code. With the exception of the PISCES-QUOTA-FE output, all datasets and code appear to be accessible. The PISCES-QUOTA-FE output is currently listed as restricted access on Zenodo. To ensure full reproducibility of the study, it would be important for this dataset to be made publicly available prior to publication.
- Placement of the CMIP6 results
While the methods and results are clearly presented, and the findings are effectively discussed in Sections 4.1 and 4.2, I found the placement of the CMIP6-related results somewhat unusual. Figures 8–11 are presented within Discussion Section 4.3 rather than in the Results section. This makes the narrative more difficult to follow and, in my view, disrupts the overall flow of the manuscript. I suggest moving the CMIP6 analyses and associated figures to the Results section and using Section 4.3 to synthesize the findings from the satellite products, the biogeochemical model, and the CMIP6 projections.
Citation: https://doi.org/10.5194/egusphere-2026-44-RC2 -
AC1: 'Reply to RC2', Christopher Traill, 18 Jul 2026
Referee 2 is thanked for their positive feedback and constructive suggestions for the manuscript. Model output is available on reasonable request to co-author Tagliabue. The CMIP6 results from Figure 11 have been moved to the results section, while Figure 10 has been moved to the appendix. Text is added to the Results section to integrate the CMIP6 results in the context of PISCES-QUOTA_FE results. Please find attached our detailed response to RC2 comments.
-
AC1: 'Reply to RC2', Christopher Traill, 18 Jul 2026
Peer review completion
Journal article(s) based on this preprint
Viewed
| HTML | XML | Total | BibTeX | EndNote | |
|---|---|---|---|---|---|
| 1,092 | 771 | 153 | 2,016 | 136 | 142 |
- HTML: 1,092
- PDF: 771
- XML: 153
- Total: 2,016
- BibTeX: 136
- EndNote: 142
Viewed (geographical distribution)
| Country | # | Views | % |
|---|
| Total: | 0 |
| HTML: | 0 |
| PDF: | 0 |
| XML: | 0 |
- 1
Cited


1 citations as recorded by crossref.
Christopher D. Traill

Tyler W. Rohr
Elizabeth H. Shadwick
Pearse J. Buchanan
Alessandro Tagliabue
Andrew R. Bowie
The requested preprint has a corresponding peer-reviewed final revised paper. You are encouraged to refer to the final revised version.
- Preprint
(3094 KB) - Metadata XML
Please see attached pdf