
the Creative Commons Attribution 4.0 License.
the Creative Commons Attribution 4.0 License.
 | 19 Nov 2025
Quantifying atmospheric and land drivers of hot temperature extremes through explainable Artificial Intelligence
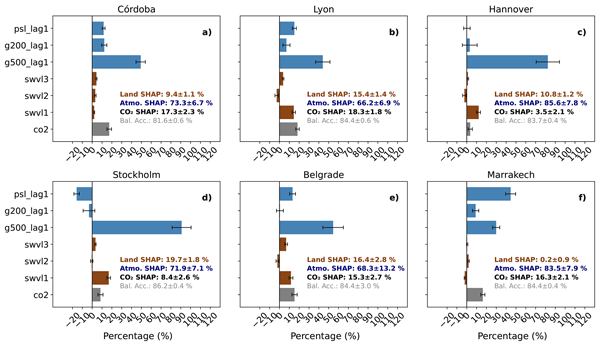
Abstract. Different drivers have been shown to play a central role in modulating the occurrence and intensity of summer temperature extremes, yet their individual contributions remain difficult to quantify. In this study, we develop an explainable machine‐learning framework to disentangle the respective influences of large‐scale atmospheric circulation, soil‐moisture anomalies, and rising CO2 concentrations on boreal‐summer temperature extremes at six locations across Europe and North Africa with different characteristics of land–atmosphere coupling (Córdoba, Lyon, Hannover, Stockholm, Belgrade, and Marrakech). Using SHapley Additive exPlanation (SHAP) values, we find that the atmospheric circulation consistently dominates model explainability across all locations, contributing to 67–90 % of the total mean SHAP, with the geopotential at 500 hPa field contributing the most. Soil‐moisture influence exhibits a northward gradient: negligible at Marrakech (0.5 %), moderate at Córdoba (7.7 %), and substantial at Lyon (15 %). Additionally, negative correlations between soil‐moisture standardized anomalies and SHAP values across three depth levels corroborate the amplifying effect of land drying on heat extremes. We demonstrate the robustness of these findings to a less stringent (80th percentile) extreme definition. Furthermore, the identified driver contributions are consistent when using alternative observational data for temperature extreme definition and for computing SPI/SPEI drought indices as proxies for soil moisture, with SPEI showing a closer alignment to the original ERA5-Land results. We also illustrate the methodology for case studies of two individual events, heatwaves occurring in Córdoba (Spain) 2021 and Hannover (Germany) 2018, which reveal a pronounced spatial pattern in the distribution of SHAP values for the circulation predictors. They also confirm the enhanced role of the land component in regions of Northern Europe and reveal a contribution of the anthropogenic factor through CO2 concentrations, even for specific events. These insights enhance our understanding of the physical mechanisms behind temperature extremes and demonstrate the potential of explainable artificial intelligence methods to quantify the contributions from different drivers of hot temperature extremes.
-
Notice on discussion status
The requested preprint has a corresponding peer-reviewed final revised paper. You are encouraged to refer to the final revised version.
-
Preprint
(2385 KB)
-
The requested preprint has a corresponding peer-reviewed final revised paper. You are encouraged to refer to the final revised version.
- Preprint
(2385 KB) - Metadata XML
- BibTeX
- EndNote
- Final revised paper


Journal article(s) based on this preprint
Interactive discussion
Status: closed
-
RC1: 'Comment on egusphere-2025-5392', Anonymous Referee #1, 05 Jan 2026
- AC1: 'Reply on RC1', Arnau Garcia Mesa, 30 Mar 2026
-
RC2: 'Comment on egusphere-2025-5392', Anonymous Referee #2, 13 Jan 2026
Dear authors,
Please find my comments in a separate PDF file.
- AC2: 'Reply on RC2', Arnau Garcia Mesa, 30 Mar 2026
Peer review completion


Interactive discussion
Status: closed
-
RC1: 'Comment on egusphere-2025-5392', Anonymous Referee #1, 05 Jan 2026
General Comments:
In this paper, the authors use an explainable ML approach to identify atmospheric circulation, CO2, and soil moisture sources of extreme boreal summer high temperatures in six European and North African regions at a one day lag. The paper is generally well written, however, I believe the authors are missing some key results/analyses in order to claim that they have created an explainable ML framework to disentangle the respective influences of atmosphere and land for these six locations. I have included these suggestions in the specific comments. Some of the methodology for training and SHAP analysis also needs to be clarified before publication.
Specific Comments:
- Training-Validation-Testing Split:
- L186-187: Could the authors clarify the 80-20 random split for the training and validation? Do the authors split the data into time chunks or are the samples randomly selected? If samples (rather than chunks) are randomly selected, how do the authors account for temporal autocorrelation in the 80-20 random split? For example, if the samples are randomly grabbed, it is possible to have 21 January 2001 in validation and 22 January 2001 in training.
- L186-191: Is the training-validation 80-20 random split from the 1950-2014 training period? If so, I recommend changing Table B1 to also have the random 20% that represents the validation data. I also recommend clarifying in the text that 1950-2014 includes training and validation data.
- Network Confidence:
- L232-233: Do you expect accuracy to increase with confidence because you believe some events are actually more predictable than others or do you think this is just a factor of the loss function?
- Why do the authors choose to look at the 50% most confident extreme predictions?
- Choice of Baseline:
- L203: Could the authors explain why they chose a baseline of the average predictions? Given the authors are interested in the drivers of hot temperature extremes, I think it may be more useful to direct the XAI method to answer the question “which regions made the network predict an extreme as opposed to a non-extreme?” If this is the case, I think the authors should use the average non-extreme days for their baseline. Phrased another way, the current baseline choice is answering “what regions make this different from the average day?” Below are some relevant citations to explore this concept further. If the authors chose to keep the baseline as the average of all the training data, please include reasoning and citations.
- Mamalakis et al. (2023). Carefully Choose the Baseline: Lessons Learned from Applying XAI Attribution Methods for Regression Tasks in Geoscience. https://doi.org/10.1175/AIES-D-22-0058.1
- Sundararajan et al. (2017): Axiomatic Attribution for Deep Networks. https://arxiv.org/pdf/1703.01365
- SHAP Results
- Figure 6: Could you also include this figure for circulation?
- L313: Please add more detail on how bootstrapping was done.
- Could the authors discuss why they think the SHAP values for PSL and g500 don’t evolve the same for the case studies? I would expect them to contribute similar information. Is PSL redundant and therefore, not used by the model? Could the same information be retrieved from PSL if g500 wasn’t included?
- In a similar line of thinking, do the authors think temperature extremes could be predicted using only soil moisture information?
- Further, given the title also talks about exploring land drivers, I think it’s important to find a case study where soil moisture is (more) important for prediction. Or would the authors conclude based on their results that the land drivers aren’t very important for prediction of hot temperature extremes in these regions (e.g. Figure 5)?
- Do the authors think temperature extremes could be predicted using only CO2 information?
- Figure 7b-c/8b-c: Are the authors looking at the circulation predictor of the extreme heat (e.g. one day before the peak day) or the circulation on the peak day? Given the set up of the model, the authors should look at the day before SHAP values as this is what is associated with the prediction of the peak day. Otherwise, these plots are highlighting the regions important for predicting the day after the peak (14 August 2021 and 5 August 2018, respectively).
- Are these case studies part of the 50% most confident predictions? If not, why do you think that is?
- L427-228: “SHAP values, however, remain relatively unexplored for such pattern identification” - this statement is not true. There are many papers which use SHAP values to explore regional importance. A few examples are below:
- Straaten, Chiem van, Kirien Whan, Dim Coumou, Bart van den Hurk, and Maurice Schmeits. 2023. “Correcting Sub-Seasonal Forecast Errors with an Explainable ANN to Understand Misrepresented Sources of Predictability of European Summer Temperatures.” Artificial Intelligence for the Earth Systems 1 (aop): 1–49.
- Zhang, Huan, Justin Finkel, Dorian S. Abbot, Edwin P. Gerber, and Jonathan Weare. 2024. “Using Explainable AI and Transfer Learning to Understand and Predict the Maintenance of Atlantic Blocking with Limited Observational Data.” Journal of Geophysical Research: Machine Learning and Computation 1 (4): e2024JH000243.
- Alexander, Jagger, and Zong-Liang Yang. 2024. “Decoding Sub-Seasonal Predictors of Extreme Heat with Interpretable Machine Learning.” EarthArXiv. November 26, 2024. https://eartharxiv.org/repository/view/8118/.
- Mamalakis, Antonios, Elizabeth A. Barnes, and James W. Hurrell. 2023. “Using Explainable Artificial Intelligence to Quantify ‘Climate Distinguishability’ after Stratospheric Aerosol Injection.” Geophysical Research Letters 50 (20): e2023GL106137.
- Clare, Mariana C. A., Maike Sonnewald, Redouane Lugensat, Julie Deshayes, and V. Balaji. 2022. “Explainable Artificial Intelligence for Bayesian Neural Networks: Toward Trustworthy Predictions of Ocean Dynamics.” ournal of Advances in Modeling Earth Systems 14 (11). https://doi.org/10.1029/2022ms003162.
- Statements in L395 and L430 appear counterintuitive. Could the authors clarify the discrepancy in which they find that in the arid regions (e.g. Cordoba and Marrakech) the land importance was negligible, but previous research has shown “that dry soils intensify and prolong heat extremes”? The statement in L430 is confirmed by the anti-correlated SHAP values and soil moisture values, but is contradictory to the northward gradient of soil-moisture importance. Is the statement in L430 only true in specific climates? Please clarify.
Technical Corrections:
- L77: missing section number
- L85: Geopotential at 200hPa (g500) (g200)
- L160-161: Could the authors clarify why they use a 5 day window for the percentile calculation before a 30 day smoothing? Why not only apply the LOESS smoothing?
- Figure 3 or in text: Please include the dimension sizes of inputs into each layers
- Figure 3: this type of architecture design has been used in a few other studies that would be good to cite:
- Gordon, E. M., E. A. Barnes, and F. V. Davenport. 2023. “Separating Internal and Forced Contributions to Near Term SST Predictability in the CESM2-LE.” Environmental Research Letters: ERL DOI 10.1088/1748-9326/acfdbc.
- Mayer, Kirsten J., William E. Chapman, and William A. Manriquez. 2024. “Exploring the Relative Importance of the MJO and ENSO to North Pacific Subseasonal Predictability.” Geophysical Research Letters 51 (10). https://doi.org/10.1029/2024gl108479.
- L207: Please cite GradientExplainer
- L207: I don’t think the testing period has been explicitly defined yet. Please add.
- Figure 4: This figure would be easier to read as a line plot, with a dot for each year (yellow for E-OBS and grey for ERA5-Land). This way the yellow and grey dots for each year line up vertically.
- L229: “??” in the sentence.
- Figure 7b/8b:
- Please include how you use/show the bootstrapping cutoffs for these figures in the caption.
- Please use a different color than black for the dot locating Cordoba/Hannover. It is very hard to see.
- Figure 7c/8c:
- Why are the authors differentiating between geopotential and geopotential height when the difference is only a constant? I recommend only plotting g500 (which is an input into your model) as a contour and then the SHAP values could then be added as shading in this figure.
- L325: Is there a citation the authors could include for the statement “contrasting soil-moisture regime”?
- L336: I think a new section should start here, as the authors are no longer specifically talking about the second case study.
- L354: The last paragraph repeats again here.
- Figure B1: Could you include the sample size and random chance values in this plot?
Citation: https://doi.org/10.5194/egusphere-2025-5392-RC1 - AC1: 'Reply on RC1', Arnau Garcia Mesa, 30 Mar 2026
-
RC2: 'Comment on egusphere-2025-5392', Anonymous Referee #2, 13 Jan 2026
Dear authors,
Please find my comments in a separate PDF file.
- AC2: 'Reply on RC2', Arnau Garcia Mesa, 30 Mar 2026
Peer review completion
Journal article(s) based on this preprint
Data sets
QuantifyDriversHW Arnau Garcia Mesa, Lluis Palma, and Stefano Materia https://gitlab.earth.bsc.es/agarci8/quantifydrivershw.git
Model code and software
QuantifyDriversHW Arnau Garcia Mesa and Lluis Palma https://gitlab.earth.bsc.es/agarci8/quantifydrivershw.git
Viewed
| HTML | XML | Total | BibTeX | EndNote | |
|---|---|---|---|---|---|
| 2,403 | 917 | 216 | 3,536 | 183 | 173 |
- HTML: 2,403
- PDF: 917
- XML: 216
- Total: 3,536
- BibTeX: 183
- EndNote: 173
Viewed (geographical distribution)
| Country | # | Views | % |
|---|
| Total: | 0 |
| HTML: | 0 |
| PDF: | 0 |
| XML: | 0 |
- 1

Lluís Palma
Markus Donat
Stefano Materia
Raül Marcos Matamoros
The requested preprint has a corresponding peer-reviewed final revised paper. You are encouraged to refer to the final revised version.
- Preprint
(2385 KB) - Metadata XML
General Comments:
In this paper, the authors use an explainable ML approach to identify atmospheric circulation, CO2, and soil moisture sources of extreme boreal summer high temperatures in six European and North African regions at a one day lag. The paper is generally well written, however, I believe the authors are missing some key results/analyses in order to claim that they have created an explainable ML framework to disentangle the respective influences of atmosphere and land for these six locations. I have included these suggestions in the specific comments. Some of the methodology for training and SHAP analysis also needs to be clarified before publication.
Specific Comments:
Technical Corrections: