
the Creative Commons Attribution 4.0 License.
the Creative Commons Attribution 4.0 License.
 | 13 Nov 2025
Improving Simulation of Earth System Variability through Weakly Coupled Ocean Data Assimilation in E3SM
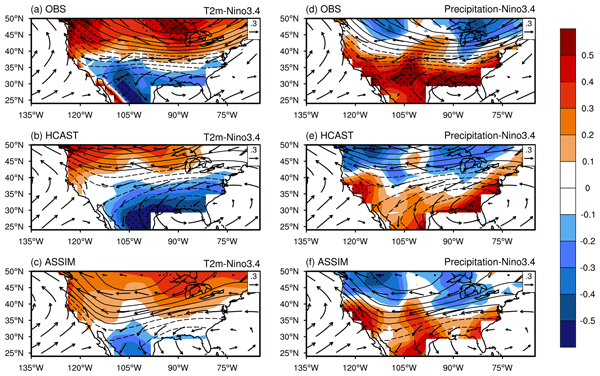
Abstract. Accurate initialization of ocean states is essential for skillful prediction of Earth system variability across seasonal to decadal timescales. In this study, we evaluate the impact of a newly developed four-dimensional ensemble variational (4DEnVar)-based weakly coupled ocean data assimilation (WCODA) system within the DOE Energy Exascale Earth System Model version 2 (E3SMv2) on global and regional climate variability. By assimilating monthly ocean temperature and salinity from the EN4.2.1 reanalysis into the fully coupled model, we demonstrate substantial improvements in simulating both interannual and decadal climate variability. Compared to the free-running coupled simulation, the assimilation experiment exhibits markedly enhanced interannual correlations with observations for global mean surface air temperature and precipitation anomalies. The representation of key climate modes, including ENSO, the Indian Ocean Dipole, and multidecadal variability in the Pacific and Atlantic Oceans, also improves significantly. Regional evaluation over the contiguous United States further shows enhanced skill in simulating winter surface air temperature and precipitation variability, particularly in the northern and southern regions, respectively, linked to improved ENSO representation. These findings underscore the critical role of coupled forecasts in the data assimilation cycle for propagating observational information across Earth system components. By integrating ocean observations within a coupled framework, the WCODA system enables cross-component information exchange among the ocean, atmosphere, and land, thereby generating physically consistent initial states. These improvements contribute to more accurate simulations of Earth system variability across multiple timescales and advance the development of more reliable prediction systems in support of societal resilience.
-
Notice on discussion status
The requested preprint has a corresponding peer-reviewed final revised paper. You are encouraged to refer to the final revised version.
-
Preprint
(4757 KB)
-
The requested preprint has a corresponding peer-reviewed final revised paper. You are encouraged to refer to the final revised version.
- Preprint
(4757 KB) - Metadata XML
- BibTeX
- EndNote
- Final revised paper


Journal article(s) based on this preprint
Interactive discussion
Status: closed
-
RC1: 'Comment on egusphere-2025-4910', Anonymous Referee #1, 05 Jan 2026
-
AC1: 'Reply on RC1', Pengfei Shi, 05 Mar 2026
We sincerely appreciate your time and effort in reviewing our manuscript. Your constructive comments and suggestions have been invaluable in improving the clarity and quality of our work. We have carefully addressed each of your comments and made the necessary revisions to the manuscript accordingly. For your convenience, we have provided a detailed point-by-point response in the attached document.
-
AC1: 'Reply on RC1', Pengfei Shi, 05 Mar 2026
-
RC2: 'Comment on egusphere-2025-4910', Anonymous Referee #2, 08 Jan 2026
This manuscript compares representations of Earth system variability in coupled E3SM simulations running with and without an implementation of the ocean data assimilation framework described in an earlier GMD paper (Shi et al. 2025). They find that assimilation improves correlations between the model and observations across multiple metrics with climate relevance, including cross-variable relationships that motivate using (weakly-) coupled DA.
The paper is clearly written. I am suggesting major revisions because I think that more evidence is needed to support the conclusions of the paper and to establish it as a standalone contribution. Shi et al. (2025) already demonstrated the modeling capabilities underpinning this work and the capability of better aligning E3SM with an observational product. I encourage the authors to emphasize how this work is distinct from that earlier work, beyond the choice of different regional and time averages selected for climate scales. Also, given that this is GMD, please also emphasize any model development advances, since I am not sure what has been done on that front.
Major comments
- This work assimilates output from a reanalysis product (EN4). I would likely not consider this to be data assimilation by the conventional definition, and certainly not "direct assimilation" (l. 375) since there are no actual observations being assimilated. Would the authors please justify why their scheme should be considered DA and not a sort of 4D nudging? I think that justifying how this procedure is DA is important because directly ingesting raw data is considerably more challenging and has accompanying benefits, so we should reserve terms like "direct data assimilation" and "data assimilation" for those efforts.
- Please provide greater detail on your assimilation procedure. How is observational uncertainty propagated through EN4? Are there concerns with ensemble collapse or any inflation used? Does observational density influence results?
- Please give more discussion and justification on eliminating the Arctic. DA natively handles uncertainties large and small, and this seems like a relevant/proximal area for CONUS analysis.
- A repeating refrain throughout the results section is about the benefits or critical importance of ocean DA for representing various kinds of variability. However, there are many other observations available as well, e.g. in the atmosphere, with better-established assimilation pipelines that might constrain climate modes as well or better. Currently this point is only briefly acknowledged in the Discussion. To me the experiments in this paper demonstrate that ocean constraints are sufficient but not that they are necessary to improve Earth system variability -- please adjust conclusions accordingly.
- Regarding experimental design, I think that comparing an assimilating model to a free-running model for its ability to fit observations is a low bar. Many of the results seem consistent with phase aligning internal variability with observations and I don't think that sections 3.2, 3.3, and 3.4 do much to support the climate that assimilation improves simulation of Earth system variability. I suggest that the authors qualify their conclusions to distinguish between phase alignment versus actual process representation improvement, including the fact that assimilation introduces nonconservative effects.
- Please note in the paper to what extent HadSST is "out-of-sample" relative to the EN4 reanalysis and the implications for how we should interpret any improved fits. It seems that you are assimilating EN4 and then demonstrating that the assimilation improves fits to a different product with largely the same underlying data, which seems like more of a demonstration that DA is functioning rather than having process-specific significance.
- I think that the strongest parts of the paper are 3.1 and 3.5 that argue for an improvement in cross-variable correlations as a result of assimilation an ocean product. I recommend the authors explore these results further as a way of making the paper a more distinct contribution. What are the origins of significant improvements in correlation relationships?
Specific comments
l. 232: Weak correlations could just as well result from incorrect phase of tropical SST variability (as we expect for internal variability) as from the its "evolution" (which sounds more like a dynamical process) -- please clarify
l. 345 Please provide more justification for the focus on winter conditions. Should we expect similar behavior in other seasons?
l. 357 "closely resemble" -- please be more quantitative here and throughout this paragraph
l. 361 "superior performance" and l. 362 "notable deviations" -- it is not clear that either of these is statistically significant by your criteria. Are there significant differences you can point to?
l. 374: This language appears to be repeated from the Introduction
l. 381 "improves the representation" -- I think this statement needs more exploration of pros and cons. The procedure used has improved the phase relationship with observations, but at the cost of introducing physical inconsistencies in process representations due to a state increment at each month. Please discuss tradeoffs.
Citation: https://doi.org/10.5194/egusphere-2025-4910-RC2 -
AC2: 'Reply on RC2', Pengfei Shi, 05 Mar 2026
Thank you for your time and effort in reviewing our manuscript. We greatly appreciate your insightful comments and suggestions, which have helped us improve the clarity and quality of our work. We have carefully addressed each of your comments and made the necessary revisions to the manuscript accordingly. For your convenience, a detailed point-by-point response is provided in the attached document.
Peer review completion


Interactive discussion
Status: closed
-
RC1: 'Comment on egusphere-2025-4910', Anonymous Referee #1, 05 Jan 2026
This manuscript evaluates the influence of a weakly coupled ocean data assimilation (WCODA) system implemented in E3SMv2 on the simulation of climate variability at global and regional scales. This manuscript primarily presents evaluation results rather than methodological or model-development advances. The WCODA system itself has already been fully described and evaluated in Shi et al. (2025, GMD). My major comment is that, in the present manuscript, it is not clear if there is any new algorithmic development, implementation detail, sensitivity analysis, or methodological innovation beyond what has already been published. Instead, the paper focuses on the climate pattern evaluation (e.g., ENSO, PDO, IOD, U.S. climate impacts), which seems to align with the scope of Journal of Climate or JGR-Atmospheres/Oceans more than the GMD. If the authors intend this work to be published in GMD, they must explicitly justify how this manuscript advances model development. At present, the manuscript reads as a results paper, not a model-development paper. Some major comments are listed as follows:
- Section 2.4: Experimental Design and Initialization: How the control experiment is initialized should be described carefully. Whether CTRL is spun up from a long control integration or initialized from observations? Do the CTRL and ASSIM use the same initial condition integrated every month? Or the CTRL does not change any initial condition. If so, this CTRL is fundamentally different from ASSIM simulation.
- Whether ocean temperature and salinity drift exists prior to the analysis period. Also, why Arctic Ocean is excluded from the assimilation process? This should be emphasized more. The exclusion of the Arctic Ocean from assimilation requires a much stronger justification. The manuscript states that this is due to “sparse observational coverage,” yet EN4.2.1 does include Arctic observations. Sparse coverage alone is not a convincing argument, as the Southern Ocean suffers from similar limitations but is still assimilated. Potential dynamical consequences of excluding the Arctic, especially for high-latitude biases and global energy balance.
- Fig. 1 shows detrended global, ocean, and land surface air temperature anomalies. However, the exact detrending method is unclear (linear? piecewise? global-mean vs grid-point detrending). Different detrending approaches can substantially alter correlation metrics in the following analysis. This figure may include both detrended and non-detrended time series. I also suggest to discuss with the results with the pacemaker experiments which only nudges the SST (e.g., Kosaka and Xie, 2013, 2016; Douville et al., 2015). The significance of assimilating ocean subsurface data should be emphasized here.
Douville, H., A. Voldoire, and O. Geoffroy (2015), The recent global warming hiatus: What is the role of Pacific variability? Geophys. Res. Lett., 42, 880–888.
Kosaka, Y., and S.-P. Xie (2013), Recent global-warming hiatus tied to equatorial Pacific surface cooling. Nature, 501, 403–407
Kosaka, Y. and S.-P. Xie (2016), The tropical Pacific as a key pacemaker of the variable rates of global warming. Nature Geo., 9, 669-673.
These papers demonstrate that nudging SST only in the tropical Pacific already reproduces much of the observed global temperature variability. The authors must therefore clarify: what additional value does subsurface ocean assimilation provide beyond SST nudging (impacts on the atmospheric and climate variability)? This is a critical scientific question that is not addressed.
- Line 174: I am surprised that assimilating full-depth ocean temperature and salinity increases the global mean temperature correlation only to 0.47. This seems to be weaker than correlations achieved by simple SST pacemaker experiments. Even more puzzling is that ASSIM fails to capture major ENSO impacts on the global 2m temperature (e.g., 1982/83, 1986/87, 1997/98) and strong La Niña events, despite assimilating ocean data (compared to Fig. 2 in Douville et al., 2015). This raises some issues why subsurface assimilation does not outperform SST-only nudging. Does the DA system overly smooth variability? Is the monthly assimilation window too long to retain ENSO phase locking?
- Fig.2 I do agree that errors are reduced mostly in ASSIM, however, I notice red shading in Arctic is increased in ASSIM than CTRL. Is it right? That implies assimilation enhances the biases over the regions where no assimilation is made. Can you comment on this issue? Can you ensure the assimilation provides a reasonable dynamic is still hold? What’s the imbalance of this Earth System Model after the assimilation (global TOA imbalance, global atmosphere temperature, global ocean temperature and salinity etc). Without such diagnostics, it is difficult to assess whether the assimilation introduces artificial imbalances.
- Line 195-196. It seems the overall spatial pattern of the biases is reduced but the shape is similar. Are you sure the realistic ocean state play a key role? Maybe assimilating the SST is sufficient. The authors may disentangle SST-only effects and
Subsurface temperature/salinity impacts.
- Line 206-207, why do you think surface air temperature and precipitation correlation over land in CTRL is “relatively high” (0.26 and 0.27)? Have you compared this with the case without external forcing on land?
- Section 3.1: this section is largely descriptive, resembling a student report rather than a scientific analysis. The manuscript does not explain why precipitation biases are reduced, which circulation or moisture processes are improved, whether Walker/Hadley circulation changes are involved. I couldn’t see any scientific insight. I suggest the authors enhance the dynamics behind the enhanced precipitation bias pattern.
- Fig. 4: it is very interesting to see that tropical-subtropical precipitation difference is not statistically significant in ASSIM. This is the region where we have the largest precipitation biases. It is very interesting to understand if assimilation in ocean suppress variability? Or is this a sign of over-constraint?
- Line 231-232, it needs to be very careful to say the model’s inability to reproduce the tropical SST variability. Normally, we never expect the climate model to reproduce the exact timing or peaks of ENSO or other tropical climate pattern. Instead, if the ENSO spectrum and strength are well compared with the observation, we believe this model can capture the dynamics related to ENSO and is capable of reproducing tropical SST variability. However, if the model cannot well simulate the tropical dynamics while we try to nudge the simulation using data assimilation, this is very dangerous. This can be seen in Fig. 6. The discussion needs careful, cautious wording and deeper discussion.
- Fig. 8 I am surprised that the DMI correlation in ASSIM is only 0.56, given that SST is assimilated. I thought the correlation should be very similar to the Nino3.4 index while you assimilate the SST. Can you explain why? This implies your SST in Indian Ocean is not quite close to the observation. Why? What’s the correlation of DMI between EN4 SST and HadiSST you used as the validation? Is Indian Ocean SST poorly constrained?
- Similarly, I am also surprised that the PDO pattern and the time series may not be so close to the observation (may connected to my comment 3 above, how the EOF is performed). Same apply for IPO and AMO in Section 3.4.Can you clarify how you perform the EOF analysis for the observation and model? Do you project the observational data on to the model grid? Or do you perform the EOF analysis separately between the observation and model? Are they collocated within the same grid? Also, the linear trend you remove. Did you remove the global trend for all climate patterns or did you remove the linear trend for individual grid? These details should be clarified for a fair comparison among these climate modes.
- Some figures use 95% significance (e.g, Fig. 4) while some use 90% (e.g., Fig. 12). Some figures do not include any statistical significance. This is inconsistent. A single confidence level should be used throughout unless explicitly justified.
- Fig. 14 is very important. However, the comparison may not be fair. Can you confirm if the Nino3.4 index in CTRL is based on the observed Nino3.4 or the modeled Nino3.4? Can you ensure the ASSIM still preserve the same atmosphere and ocean dynamics as the CTRL? Also, do you use the same time correlation or 1-2 month lag? It is common to see the impact of ENSO on the US winter climate after ~1 month lag.
Overall, this manuscript contains interesting evaluation results, but I do worry it lacks model-development novelty required for GMD. It also provide insufficient dynamical insight. Some methodology should be clarified. I recommend major revision, with a strong suggestion that the authors either reframe the manuscript explicitly as a model-development and diagnostic paper, or consider submission to J. Clim. or other journals where the scientific results would be more appropriate.
Citation: https://doi.org/10.5194/egusphere-2025-4910-RC1 -
AC1: 'Reply on RC1', Pengfei Shi, 05 Mar 2026
We sincerely appreciate your time and effort in reviewing our manuscript. Your constructive comments and suggestions have been invaluable in improving the clarity and quality of our work. We have carefully addressed each of your comments and made the necessary revisions to the manuscript accordingly. For your convenience, we have provided a detailed point-by-point response in the attached document.
-
RC2: 'Comment on egusphere-2025-4910', Anonymous Referee #2, 08 Jan 2026
This manuscript compares representations of Earth system variability in coupled E3SM simulations running with and without an implementation of the ocean data assimilation framework described in an earlier GMD paper (Shi et al. 2025). They find that assimilation improves correlations between the model and observations across multiple metrics with climate relevance, including cross-variable relationships that motivate using (weakly-) coupled DA.
The paper is clearly written. I am suggesting major revisions because I think that more evidence is needed to support the conclusions of the paper and to establish it as a standalone contribution. Shi et al. (2025) already demonstrated the modeling capabilities underpinning this work and the capability of better aligning E3SM with an observational product. I encourage the authors to emphasize how this work is distinct from that earlier work, beyond the choice of different regional and time averages selected for climate scales. Also, given that this is GMD, please also emphasize any model development advances, since I am not sure what has been done on that front.
Major comments
- This work assimilates output from a reanalysis product (EN4). I would likely not consider this to be data assimilation by the conventional definition, and certainly not "direct assimilation" (l. 375) since there are no actual observations being assimilated. Would the authors please justify why their scheme should be considered DA and not a sort of 4D nudging? I think that justifying how this procedure is DA is important because directly ingesting raw data is considerably more challenging and has accompanying benefits, so we should reserve terms like "direct data assimilation" and "data assimilation" for those efforts.
- Please provide greater detail on your assimilation procedure. How is observational uncertainty propagated through EN4? Are there concerns with ensemble collapse or any inflation used? Does observational density influence results?
- Please give more discussion and justification on eliminating the Arctic. DA natively handles uncertainties large and small, and this seems like a relevant/proximal area for CONUS analysis.
- A repeating refrain throughout the results section is about the benefits or critical importance of ocean DA for representing various kinds of variability. However, there are many other observations available as well, e.g. in the atmosphere, with better-established assimilation pipelines that might constrain climate modes as well or better. Currently this point is only briefly acknowledged in the Discussion. To me the experiments in this paper demonstrate that ocean constraints are sufficient but not that they are necessary to improve Earth system variability -- please adjust conclusions accordingly.
- Regarding experimental design, I think that comparing an assimilating model to a free-running model for its ability to fit observations is a low bar. Many of the results seem consistent with phase aligning internal variability with observations and I don't think that sections 3.2, 3.3, and 3.4 do much to support the climate that assimilation improves simulation of Earth system variability. I suggest that the authors qualify their conclusions to distinguish between phase alignment versus actual process representation improvement, including the fact that assimilation introduces nonconservative effects.
- Please note in the paper to what extent HadSST is "out-of-sample" relative to the EN4 reanalysis and the implications for how we should interpret any improved fits. It seems that you are assimilating EN4 and then demonstrating that the assimilation improves fits to a different product with largely the same underlying data, which seems like more of a demonstration that DA is functioning rather than having process-specific significance.
- I think that the strongest parts of the paper are 3.1 and 3.5 that argue for an improvement in cross-variable correlations as a result of assimilation an ocean product. I recommend the authors explore these results further as a way of making the paper a more distinct contribution. What are the origins of significant improvements in correlation relationships?
Specific comments
l. 232: Weak correlations could just as well result from incorrect phase of tropical SST variability (as we expect for internal variability) as from the its "evolution" (which sounds more like a dynamical process) -- please clarify
l. 345 Please provide more justification for the focus on winter conditions. Should we expect similar behavior in other seasons?
l. 357 "closely resemble" -- please be more quantitative here and throughout this paragraph
l. 361 "superior performance" and l. 362 "notable deviations" -- it is not clear that either of these is statistically significant by your criteria. Are there significant differences you can point to?
l. 374: This language appears to be repeated from the Introduction
l. 381 "improves the representation" -- I think this statement needs more exploration of pros and cons. The procedure used has improved the phase relationship with observations, but at the cost of introducing physical inconsistencies in process representations due to a state increment at each month. Please discuss tradeoffs.
Citation: https://doi.org/10.5194/egusphere-2025-4910-RC2 -
AC2: 'Reply on RC2', Pengfei Shi, 05 Mar 2026
Thank you for your time and effort in reviewing our manuscript. We greatly appreciate your insightful comments and suggestions, which have helped us improve the clarity and quality of our work. We have carefully addressed each of your comments and made the necessary revisions to the manuscript accordingly. For your convenience, a detailed point-by-point response is provided in the attached document.
Peer review completion
Journal article(s) based on this preprint
Viewed
| HTML | XML | Total | BibTeX | EndNote | |
|---|---|---|---|---|---|
| 1,778 | 718 | 216 | 2,712 | 187 | 179 |
- HTML: 1,778
- PDF: 718
- XML: 216
- Total: 2,712
- BibTeX: 187
- EndNote: 179
Viewed (geographical distribution)
| Country | # | Views | % |
|---|
| Total: | 0 |
| HTML: | 0 |
| PDF: | 0 |
| XML: | 0 |
- 1
Pengfei Shi

Zhaoxia Pu
Samson Hagos
Karthik Balaguru
The requested preprint has a corresponding peer-reviewed final revised paper. You are encouraged to refer to the final revised version.
- Preprint
(4757 KB) - Metadata XML
This manuscript evaluates the influence of a weakly coupled ocean data assimilation (WCODA) system implemented in E3SMv2 on the simulation of climate variability at global and regional scales. This manuscript primarily presents evaluation results rather than methodological or model-development advances. The WCODA system itself has already been fully described and evaluated in Shi et al. (2025, GMD). My major comment is that, in the present manuscript, it is not clear if there is any new algorithmic development, implementation detail, sensitivity analysis, or methodological innovation beyond what has already been published. Instead, the paper focuses on the climate pattern evaluation (e.g., ENSO, PDO, IOD, U.S. climate impacts), which seems to align with the scope of Journal of Climate or JGR-Atmospheres/Oceans more than the GMD. If the authors intend this work to be published in GMD, they must explicitly justify how this manuscript advances model development. At present, the manuscript reads as a results paper, not a model-development paper. Some major comments are listed as follows:
Douville, H., A. Voldoire, and O. Geoffroy (2015), The recent global warming hiatus: What is the role of Pacific variability? Geophys. Res. Lett., 42, 880–888.
Kosaka, Y., and S.-P. Xie (2013), Recent global-warming hiatus tied to equatorial Pacific surface cooling. Nature, 501, 403–407
Kosaka, Y. and S.-P. Xie (2016), The tropical Pacific as a key pacemaker of the variable rates of global warming. Nature Geo., 9, 669-673.
These papers demonstrate that nudging SST only in the tropical Pacific already reproduces much of the observed global temperature variability. The authors must therefore clarify: what additional value does subsurface ocean assimilation provide beyond SST nudging (impacts on the atmospheric and climate variability)? This is a critical scientific question that is not addressed.
Subsurface temperature/salinity impacts.
Overall, this manuscript contains interesting evaluation results, but I do worry it lacks model-development novelty required for GMD. It also provide insufficient dynamical insight. Some methodology should be clarified. I recommend major revision, with a strong suggestion that the authors either reframe the manuscript explicitly as a model-development and diagnostic paper, or consider submission to J. Clim. or other journals where the scientific results would be more appropriate.