
the Creative Commons Attribution 4.0 License.
the Creative Commons Attribution 4.0 License.
 | 21 Aug 2025
Very-High-Resolution, Multi-Season Monitoring of Crop Evapotranspiration and Water Stress with UAV Data and TSEB Integration
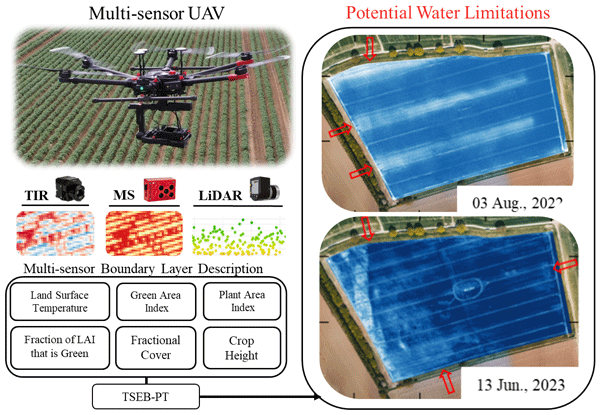
Abstract. Field-scale estimation of evapotranspiration (ET) using high-resolution data supports water conservation and yield optimization by enabling localized water use monitoring and early detection of crop stress. This study applies the Priestley–Taylor Two-Source Energy Balance (TSEB-PT) model at 15 cm resolution using unmanned aerial vehicle (UAV) data over a 10-hectare field across three seasons: sugar beet (2021), potato (2022), and winter wheat (2023). Key inputs included thermal infrared (TIR) for land surface temperature (LST), multispectral (MS) and LiDAR data for canopy characterization, and a fusion of MS derived green area index (GAI) and LiDAR derived plant area index (PAI) to derive the fraction of green LAI (fg). Model outputs were validated against eddy covariance (EC) flux data using footprint modeling. Results showed high sensitivity to LST, emphasizing the importance of accurate thermal calibration. While both GAI and PAI provided comparable LAI inputs during peak growth, GAI better captured functional canopy decline during stress and senescence, especially in winter wheat, where dense structure led to cooling effects unrelated to transpiration. Dynamic fg improved ET accuracy across all crops, particularly under declining canopy function. Overall, TSEB-PT showed strong agreement with EC measurements (RMSE = 0.14 mm/h, R² = 0.49; R² = 0.81 excluding senescence). UAV TIR based ET maps also revealed early stress signals prior to changes in MS or LiDAR based metrics. This study demonstrates the value of integrating very-high-resolution UAV data with the TSEB-PT model for multi-crop and season-long ET monitoring and early stress detection.
-
Notice on discussion status
The requested preprint has a corresponding peer-reviewed final revised paper. You are encouraged to refer to the final revised version.
-
Preprint
(4419 KB)
-
The requested preprint has a corresponding peer-reviewed final revised paper. You are encouraged to refer to the final revised version.
- Preprint
(4419 KB) - Metadata XML
- BibTeX
- EndNote
- Final revised paper


Journal article(s) based on this preprint
Interactive discussion
Status: closed
-
RC1: 'Comment on egusphere-2025-3919', Anonymous Referee #1, 28 Oct 2025
-
RC2: 'Comment on egusphere-2025-3919', William Kustas, 12 Dec 2025
The paper by Bates et al entitled “Very-High-Resolution, Multi-Season Monitoring of Crop Evapotranspiration and Water Stress with UAV Data and TSEB Integration” evaluates the utility of the TSEB-PT model applied to 3 cropping systems using UAV imagery with advances in correction of thermal imagery and the use of LiDAR to capture PAI and use this information to reliable estimate the green fraction of vegetation during crop senescent stage. Overall, the paper is fairly well written, and the authors do a good job describing the benefits of the innovations made in producing more reliable LST data and estimates of green fraction which is critical for estimating ET during crop senescence.
However it is unclear what resolution is used in the the application of the TSEB model. The 15 cm resolution is very high and it is not clear how it can be used to define the inputs to TSEB. This needs to be clearly discussed. They also only compare ET and not the other energy balance components nor do they mention how they dealt with energy balance closure. Comparison with closed or unclosed H and LE should be discussed. Furthermore, an X-Y scatter plot comparing all 4 components for each crop type would be very helpful to the reader. There are also several fractional cover terms discussed but is confusing to the reader which ones are applied under the different crop conditions (e.g., pre and post senescence).
With such high resolution thermal and multispectral imagery, could the authors have also used the TSEB-2T version? If not, they should provide rationale in going with TSEB-PT.
Some of the figures should be modified for better clarity. For example, in Figure 5 the authors should consider adding a 2nd y-axis to show the difference in LST_OG and LST_TC as the temperature range from 10 to 40 C significantly suppresses differences in the plots. The figures 8 ands 10 would be more useful to the reader if they were shown as scatter plots (2 x 3 separating the two LST inputs versus EC observations and for LAI a 3x3 for the three LAI/fg estimates) and distinguishing with symbols pre and post senescence. Also for both current figures 8 and 10 the symbols for LST=LST_OG and LAI=GAI, fg=1 are very faint and hard to see. Plus, the vertical dashed lines I believe indicate pre and post crop senescence but are not mentioned in the figure captions and should be a darker color (black?) so is easily visible to the reader. Finally, there are unexplained dashed light blue lines for the potato plots which are not described. However, I believe scatter plots would be much more useful to the reader and easier to evaluate differences with the EC data as scatter plots. On the other hand, I like the way the authors show the difference statistics for the different model output in figures 9 and 11. In Figure 13, the figures have an insert with a blue circle…seems out of place and not explained.
Under section 4.5 Practical impacts and considerations for farming practices, the authors should go the extra mile and compute daily ET using the simple approach evaluated by Cammalleri et al (2014). This approach is used and tested in many applications even with UAV data (e.g., Nassar et al. 2021). I recommend the authors make a final calculation using this approach and compare with daily ET from the EC data using their best inputs. The daily ET is more relevant to farmers and for stress perhaps they can show these daily ET maps relative to reference crop or potential ET from FAO56 to highlight the stress area.
Cammalleri, C., Anderson, M.C., Kustas, W.P. (2014). Upscaling of evapotranspiration fluxes from instantaneous to daytime scales for thermal remote sensing applications. Hydrol. Earth Syst. Sci. 18, 1885–1894
Nassar, A., Torres-Rua, A., Kustas, W., Alfieri, J., Hipps, L., Prueger, J., Nieto, H., Alsina, M.M., White, W., McKee, L. et al. (2021) Assessing Daily Evapotranspiration Methodologies from One-Time-of- Day sUAS and EC Information in the GRAPEX Project. Remote Sens. 13, 2887. https://doi.org/10.3390/rs13152887
Citation: https://doi.org/10.5194/egusphere-2025-3919-RC2 - AC2: 'Reply on RC2', Jordan Bates, 02 Feb 2026
- AC1: 'Reply on RC1', Jordan Bates, 02 Feb 2026
-
RC2: 'Comment on egusphere-2025-3919', William Kustas, 12 Dec 2025
-
EC1: 'Comment on egusphere-2025-3919', Mallory Barnes, 04 Aug 2026
As promised, I have reviewed the revised manuscript and response letter myself. The revision is thorough and addresses the referees' concerns well. My comments are aimed at tightening the paper, which has grown substantially during the major-revision round and now has 17 main figures. Most of these are recommendations left to your judgment, but the data availability point is a journal requirement.
When assessing which figures could move to supplemental I considered whether a figure was a diagnostic or sensitivity check only, and whether the figure was required to support the paper's central claims about the importance of thermal calibration, divergence between GAI & PAI under senescence, dynamic fg, and daily ET upscaling.
- Figure 13 is the clearest candidate (the ET difference maps). The correction lowers ET across the whole field so the maps look predominantly uniform red. The spatial structure described in the caption is difficult to see in the figure, and the stress-related spatial contrast that matters to the paper's argument is better shown in Figures 14 & 15. Whether or not you move it, I suggest revising the caption to match what the figure shows, since the variation with evaporative source and stress condition is hard to make out here.
- Figure 12 is also a good candidate for supplemental since it is a sensitivity diagnostic (input vs. output CV). Fg influences spatial ET variability more than LAI type is a secondary point and the sentence at 663 that references it in the discussion could simply redirect to the same figure in the supplement. I would suggest moving this one.
- FIgures 8 & 10 are the four-component flux scatterplots for the LST & LAI/fg experiments, and Figures 9 & 11 distill each to the ET performance the argument actually uses. The four-component detail is useful but not needed to follow the paper's main claims so it is a candidate for moving to supplement (and keeping 9 & 11 in main text). These were explicitly requested by Referee 2, so I leave this to your preference. Keeping them in the supplemental or in the main text are both defensible.
- In the abstract, please report the R2 range, not just the highest value across crops. So "R2 values up to 0.80 across crops" should be "R2 values from 0.27 to 0.80 across crops" to represent the crop-dependent performance more accurately.
- Data availability currently says "Data will be available upon request". This does not meet the journal's data policy: https://www.biogeosciences.net/policies/data_policy.html. The underlying data should be deposited in a FAIR-aligned repository with a persistent identifier (preferably a DOI), or a specific explanation of any legal or ethical reason the data cannot be shared. Please add a compliant Data availability section. The ICOS eddy covariance datasets already carry handles that can be cited directly; code and pretrained weights can be archived via Zenodo to obtain a DOI; and any restricted dataset should be accompanied by a stated reason consistent with the policy.Citation: https://doi.org/10.5194/egusphere-2025-3919-EC1
Peer review completion


Interactive discussion
Status: closed
-
RC1: 'Comment on egusphere-2025-3919', Anonymous Referee #1, 28 Oct 2025
Major Comments
- Line 13 and 149: Although UAV technology offers extremely high-resolution data, it is important to recognize that the TSEB model, like most resistance-based energy balance models, must be applied over an appropriate spatial domain to satisfy its physical assumptions and underlying formulations. Consequently, TSEB cannot be applied at the leaf level; the radiative transfer and turbulent exchange processes on which it depends require the model to be run at spatial resolutions of the order of meters. The 15 cm resolution of multispectral and thermal imagery used for running TSEB may need stronger justification for its selection. Evapotranspiration maps are helpful for irrigation management; however, 15 cm resolution may not be feasible for practical irrigation applications.
- Line 162-163: The radiometric sensor calibration and imagery correction are important for reliable LST data. Cited a reference and explained how the calibration parameters were used in the calibration?
- Line 174-181: Was a thermal infrared sensor or similar used to measure LST from the ground-based reference targets? Later, it stated that a multiple regression model was developed, but it is unclear how the ground temperature was measured and how the environmental variables were used to generate the model.
- Line 193: There is a lack of understanding of the terms: 1) fractional vegetation cover, 2) vegetation fractional from the viewing angle, and 3) fraction of green LAI. Also, there is an error in naming the terms throughout the paper; for example, at line 193, fractional vegetation cover was labeled FVC, and equation B1 shows the calculation of the green area index. Similar for line 221.
- Table 1 shows the model input; however, the fractional cover listed in equation (A10) is based on vegetation fractional cover viewed from an angle, which differs from the fractional cover calculated from multispectral data using soil and canopy pixel classification. Revise the original paper of TSEB formulation. Figure 4 shows equation A10, which is not related to the PT equation
- Line 362: TSEB model compute the surface energy fluxes Rn, H, G and LE or ET is calculated as a residual from the energy balance, in order to evaluate the outputs from TSEB model it is also necessary to compare the modeled and measured Rn, H and G. Additionally, TSEB model output are based on closed energy balance and EC data are non-closed energy balance it is recommended to compare for both scenarios: energy balance closed and non-closed.
- The crop water stress can be derived from TSEB outputs. The paper does not present a method for assessing crop water stress.The following paper explains a method to get CWSI from TSEB: https://doi.org/10.1016/j.jag.2025.104737Assessment of different remote sensing techniques to estimate the CWSI of almond trees using canopy temperature.
- Line 545: A Daily ET map is needed for irrigation scheduling, and an extrapolation technique using weather data can be used to upscale from hourly to daily ET. However, soil moisture and rainfall data are required for irrigation scheduling. In the literature, extrapolation techniques were assessed for ET derived from UAV data.
- Using high-resolution UAV imagery allows for canopy and soil temperature pixel separation. TSEB-2T, using canopy and soil temperatures, reported better results than TSEB-PT. TSEB-2 T does not consider Priestley-Taylor formulation initialization. Why was the criterion to use TSEB-PT having high-resolution imagery?
- How was the shadow managed in the multispectral and thermal imagery, and how was the impact on TSEB results?
Minor Comments
- Line 42: The citation is missing a parenthesis
- Line 115: Adding the flux footprint of the EC tower may explain the predominant winds on the study site
- Line 236: Net radiation (Rn) is not the same as incoming solar radiation; line 147 shows incoming solar radiation as Rn
- Line 293: there is no plot b) correlation of weather conditions with the difference (delta) between the thermal sensor and actual temperature of ground thermal targets for each date.
-
RC2: 'Comment on egusphere-2025-3919', William Kustas, 12 Dec 2025
The paper by Bates et al entitled “Very-High-Resolution, Multi-Season Monitoring of Crop Evapotranspiration and Water Stress with UAV Data and TSEB Integration” evaluates the utility of the TSEB-PT model applied to 3 cropping systems using UAV imagery with advances in correction of thermal imagery and the use of LiDAR to capture PAI and use this information to reliable estimate the green fraction of vegetation during crop senescent stage. Overall, the paper is fairly well written, and the authors do a good job describing the benefits of the innovations made in producing more reliable LST data and estimates of green fraction which is critical for estimating ET during crop senescence.
However it is unclear what resolution is used in the the application of the TSEB model. The 15 cm resolution is very high and it is not clear how it can be used to define the inputs to TSEB. This needs to be clearly discussed. They also only compare ET and not the other energy balance components nor do they mention how they dealt with energy balance closure. Comparison with closed or unclosed H and LE should be discussed. Furthermore, an X-Y scatter plot comparing all 4 components for each crop type would be very helpful to the reader. There are also several fractional cover terms discussed but is confusing to the reader which ones are applied under the different crop conditions (e.g., pre and post senescence).
With such high resolution thermal and multispectral imagery, could the authors have also used the TSEB-2T version? If not, they should provide rationale in going with TSEB-PT.
Some of the figures should be modified for better clarity. For example, in Figure 5 the authors should consider adding a 2nd y-axis to show the difference in LST_OG and LST_TC as the temperature range from 10 to 40 C significantly suppresses differences in the plots. The figures 8 ands 10 would be more useful to the reader if they were shown as scatter plots (2 x 3 separating the two LST inputs versus EC observations and for LAI a 3x3 for the three LAI/fg estimates) and distinguishing with symbols pre and post senescence. Also for both current figures 8 and 10 the symbols for LST=LST_OG and LAI=GAI, fg=1 are very faint and hard to see. Plus, the vertical dashed lines I believe indicate pre and post crop senescence but are not mentioned in the figure captions and should be a darker color (black?) so is easily visible to the reader. Finally, there are unexplained dashed light blue lines for the potato plots which are not described. However, I believe scatter plots would be much more useful to the reader and easier to evaluate differences with the EC data as scatter plots. On the other hand, I like the way the authors show the difference statistics for the different model output in figures 9 and 11. In Figure 13, the figures have an insert with a blue circle…seems out of place and not explained.
Under section 4.5 Practical impacts and considerations for farming practices, the authors should go the extra mile and compute daily ET using the simple approach evaluated by Cammalleri et al (2014). This approach is used and tested in many applications even with UAV data (e.g., Nassar et al. 2021). I recommend the authors make a final calculation using this approach and compare with daily ET from the EC data using their best inputs. The daily ET is more relevant to farmers and for stress perhaps they can show these daily ET maps relative to reference crop or potential ET from FAO56 to highlight the stress area.
Cammalleri, C., Anderson, M.C., Kustas, W.P. (2014). Upscaling of evapotranspiration fluxes from instantaneous to daytime scales for thermal remote sensing applications. Hydrol. Earth Syst. Sci. 18, 1885–1894
Nassar, A., Torres-Rua, A., Kustas, W., Alfieri, J., Hipps, L., Prueger, J., Nieto, H., Alsina, M.M., White, W., McKee, L. et al. (2021) Assessing Daily Evapotranspiration Methodologies from One-Time-of- Day sUAS and EC Information in the GRAPEX Project. Remote Sens. 13, 2887. https://doi.org/10.3390/rs13152887
Citation: https://doi.org/10.5194/egusphere-2025-3919-RC2 - AC2: 'Reply on RC2', Jordan Bates, 02 Feb 2026
- AC1: 'Reply on RC1', Jordan Bates, 02 Feb 2026
-
EC1: 'Comment on egusphere-2025-3919', Mallory Barnes, 04 Aug 2026
As promised, I have reviewed the revised manuscript and response letter myself. The revision is thorough and addresses the referees' concerns well. My comments are aimed at tightening the paper, which has grown substantially during the major-revision round and now has 17 main figures. Most of these are recommendations left to your judgment, but the data availability point is a journal requirement.
When assessing which figures could move to supplemental I considered whether a figure was a diagnostic or sensitivity check only, and whether the figure was required to support the paper's central claims about the importance of thermal calibration, divergence between GAI & PAI under senescence, dynamic fg, and daily ET upscaling.
- Figure 13 is the clearest candidate (the ET difference maps). The correction lowers ET across the whole field so the maps look predominantly uniform red. The spatial structure described in the caption is difficult to see in the figure, and the stress-related spatial contrast that matters to the paper's argument is better shown in Figures 14 & 15. Whether or not you move it, I suggest revising the caption to match what the figure shows, since the variation with evaporative source and stress condition is hard to make out here.
- Figure 12 is also a good candidate for supplemental since it is a sensitivity diagnostic (input vs. output CV). Fg influences spatial ET variability more than LAI type is a secondary point and the sentence at 663 that references it in the discussion could simply redirect to the same figure in the supplement. I would suggest moving this one.
- FIgures 8 & 10 are the four-component flux scatterplots for the LST & LAI/fg experiments, and Figures 9 & 11 distill each to the ET performance the argument actually uses. The four-component detail is useful but not needed to follow the paper's main claims so it is a candidate for moving to supplement (and keeping 9 & 11 in main text). These were explicitly requested by Referee 2, so I leave this to your preference. Keeping them in the supplemental or in the main text are both defensible.
- In the abstract, please report the R2 range, not just the highest value across crops. So "R2 values up to 0.80 across crops" should be "R2 values from 0.27 to 0.80 across crops" to represent the crop-dependent performance more accurately.
- Data availability currently says "Data will be available upon request". This does not meet the journal's data policy: https://www.biogeosciences.net/policies/data_policy.html. The underlying data should be deposited in a FAIR-aligned repository with a persistent identifier (preferably a DOI), or a specific explanation of any legal or ethical reason the data cannot be shared. Please add a compliant Data availability section. The ICOS eddy covariance datasets already carry handles that can be cited directly; code and pretrained weights can be archived via Zenodo to obtain a DOI; and any restricted dataset should be accompanied by a stated reason consistent with the policy.Citation: https://doi.org/10.5194/egusphere-2025-3919-EC1
Peer review completion
Journal article(s) based on this preprint
Viewed
| HTML | XML | Total | BibTeX | EndNote | |
|---|---|---|---|---|---|
| 13,210 | 2,176 | 272 | 15,658 | 245 | 249 |
- HTML: 13,210
- PDF: 2,176
- XML: 272
- Total: 15,658
- BibTeX: 245
- EndNote: 249
Viewed (geographical distribution)
| Country | # | Views | % |
|---|
| Total: | 0 |
| HTML: | 0 |
| PDF: | 0 |
| XML: | 0 |
- 1
Cited


4 citations as recorded by crossref.
- Leaf Angle Distribution Effects on Modelling Accuracy of Sensible and Latent Heat Fluxes in Sunflower and Wheat Crops K. Pintér & Z. Nagy https://doi.org/10.3390/rs18111732
- Hyperspectral imaging-based early stress and disease detection for sustainable crop management A. Sharma et al. https://doi.org/10.1007/s00425-026-05182-w
- Turning canopy temperature into a multidimensional tool: phenotyping diurnal canopy temperature dynamics in spring wheat breeding programs H. Khan et al. https://doi.org/10.3389/fpls.2026.1936928
- Estimation of Crop Coefficients of a High-Density Hazelnut Orchard Using Traditional Methods vs. UAV-Derived Thermal and Spectral Indices A. Vinci et al. https://doi.org/10.3390/agriculture16060677
Jordan Bates

Carsten Montzka
Harry Vereecken
François Jonard
The requested preprint has a corresponding peer-reviewed final revised paper. You are encouraged to refer to the final revised version.
- Preprint
(4419 KB) - Metadata XML
Major Comments
Minor Comments