
the Creative Commons Attribution 4.0 License.
the Creative Commons Attribution 4.0 License.
 | 15 Jan 2026
Brief communication: Atmospheric moisture and near-surface temperature anomalies: key drivers in the 2022 European mega-drought
Abstract. Using a Lagrangian framework, we show that the 2022 European drought was driven by a sharp reduction in precipitation contributions from Atlantic and Mediterranean moisture sources, despite enhanced atmospheric moisture uptake. Persistent anticyclonic circulation suppressed convection and diverted moisture away from Europe. Lagrangian temperature-source decomposition reveals strong adiabatic warming as the dominant heat driver. Together, weakened oceanic moisture supply and subsidence-driven warming sustained and intensified the drought.
-
Notice on discussion status
The requested preprint has a corresponding peer-reviewed final revised paper. You are encouraged to refer to the final revised version.
-
Preprint
(946 KB)
-
Supplement
(10600 KB)
-
The requested preprint has a corresponding peer-reviewed final revised paper. You are encouraged to refer to the final revised version.
- Preprint
(946 KB) - Metadata XML
-
Supplement
(10600 KB) - BibTeX
- EndNote
- Final revised paper


Journal article(s) based on this preprint
Interactive discussion
Status: closed
-
RC1: 'Comment on egusphere-2026-57', Anonymous Referee #1, 21 Feb 2026
-
AC1: 'Reply on RC1', José C. Fernández-Alvarez, 29 Jul 2026
The comment was uploaded in the form of a supplement: https://egusphere.copernicus.org/preprints/2026/egusphere-2026-57/egusphere-2026-57-AC1-supplement.pdf
-
AC3: 'Reply on RC1', José C. Fernández-Alvarez, 29 Jul 2026
The comment was uploaded in the form of a supplement: https://egusphere.copernicus.org/preprints/2026/egusphere-2026-57/egusphere-2026-57-AC3-supplement.zip
-
AC1: 'Reply on RC1', José C. Fernández-Alvarez, 29 Jul 2026
-
RC2: 'Comment on egusphere-2026-57', Anonymous Referee #2, 14 Jul 2026
The manuscript shows the underlying physical mechanisms that gave rise to the 2022 european drought, placing special emphasis on the behavior of atmospheric moisture transport from source regions. From this point of view, the work is revealing and should be published after revisions.
The following comments are intended to strengthen clarity, they do not affect the core findings of the study:
Comment 1
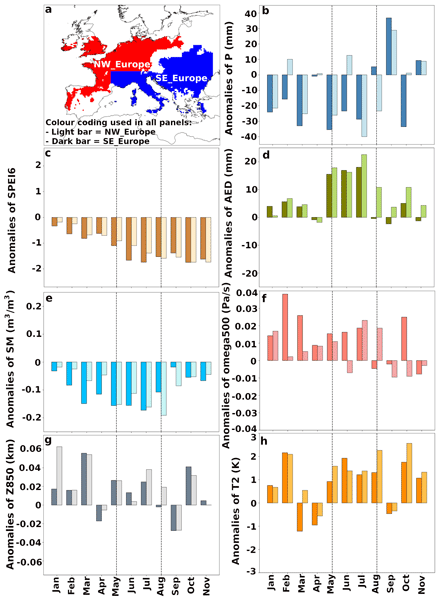
According to the SPEI-6 values shown in the figure S1 and described in the supplementary methods, the study region corresponds to areas with SPEI 6 ≤ –1.28 from June to August 2022. However, throughout the manuscript the peak period is defined as May–August. Furthermore, Figure 1c shows that SPEI-6 anomalies in the NW region are larger in November–December 2022 than during the months of the proposed peak period. A clearer justification of the selected peak period and the delimitation of target regions should be provided.Comment 2
Figure 1 is difficult to follow without consulting the supplementary material. The figure includes numerous bar charts without titles, and the legends are placed at the end of the caption, which makes interpretation considerably less intuitive. I recommend making the legend (indicating the meaning of color intensity) more prominent. Additionally, the font size of the x and y axis labels is very small and should be increased to improve readability.Comment 3
From figure S5, it is not clear what the authors mean by the “land and ocean sectors of the North Atlantic domain.” The manuscript does not specify whether the “land sector” corresponds to the broader European land area, nor whether the NE and NW regions are included or excluded when defining these sectors. The same regarding whether the Atlantic oceanic sector refers to the whole Atlantic or whether it excludes the NATL region.Comment 4
Lines 159–160 state that averages for the two European subregions reveal distinct temporal and regional behaviours (Fig. 2). However, the three components of the temperature anomaly sources (adiabatic, diabatic, and advective) show broadly similar behaviours overall, as described in the subsequent lines. In addition, the patterns shown in the figures of the supplementary materials are also quite similar for both regions.Comment 5
Lines 212–213 state that “a long lasting anticyclonic pattern blocked convection.” It may be more accurate to refer to precipitation rather than convection, since anticyclones typically suppress frontal precipitation during winter months as well. In addition, the OLR anomalies shown in Figure S12 display different signs throughout the year.Comment 6
Finally, I would like to suggest that the authors consider submitting the manuscript as a research article rather than a brief communication. Although the topic is of social relevance and fits within the brief comunication’s scope, in my opinion the manuscript, in its current form, is difficult to fully understand without consulting the supplementary material. The main text is limited to 20 bibliographic references, but the supplementary material contains a nearly equivalent number of figures.Citation: https://doi.org/10.5194/egusphere-2026-57-RC2 -
AC2: 'Reply on RC2', José C. Fernández-Alvarez, 29 Jul 2026
The comment was uploaded in the form of a supplement: https://egusphere.copernicus.org/preprints/2026/egusphere-2026-57/egusphere-2026-57-AC2-supplement.pdf
-
AC4: 'Reply on RC2', José C. Fernández-Alvarez, 29 Jul 2026
The comment was uploaded in the form of a supplement: https://egusphere.copernicus.org/preprints/2026/egusphere-2026-57/egusphere-2026-57-AC4-supplement.zip
-
AC2: 'Reply on RC2', José C. Fernández-Alvarez, 29 Jul 2026
-
AC5: 'Comment on egusphere-2026-57', José C. Fernández-Alvarez, 29 Jul 2026
Dear Editor,
I would like to inform you that we have thoroughly addressed all comments from the reviewers. All modifications in the revised manuscript are clearly highlighted in blue using track changes, and the Supplementary Material has been updated following the same convention.
Additionally, I would like to clarify a small detail regarding the response document: the section corresponding to Reviewer 2 appears under a header labeled "Reviewer 1." This occurred because the original file was named "Reviewer 2," and during preparation the internal header was inadvertently left unchanged. Despite this labeling issue, the content in that section fully corresponds to Reviewer 2’s comments and our detailed responses.
Please let us know if you would prefer us to adjust the header or make any further modifications.
Kind regards, José Carlos Fernandez Alvarez
Peer review completion


Interactive discussion
Status: closed
-
RC1: 'Comment on egusphere-2026-57', Anonymous Referee #1, 21 Feb 2026
Review of “Atmospheric moisture and near-surface temperature anomalies: key drivers in the 2022 European mega-drought” by Fernández-Alvarez et al. (2026)
General assessment
This brief communication analyzes the 2022 drought from a Lagrangian perspective, highlighting the role of moisture sources and the nature of the heating that enhanced the drought. It is an interesting contribution; however, the degree of novelty appears moderate. Despite the very notable tracking techniques employed, the manuscript ultimately provides incremental progress in our understanding of the 2022 drought.
I recommend publication after revision, provided that the comments below are addressed.
General comment
The main statement in the abstract is that the 2022 drought was driven by “a sharp reduction in precipitation contributions from Atlantic and Mediterranean moisture sources, despite enhanced atmospheric moisture uptake.” However, is this result truly surprising? There are many regions in the world where precipitable water (PW) is abundant in the atmosphere, yet conditions remain dry (for example, the Red Sea region).
It is well established that it is not the IVT of PW itself that determines rainfall, but rather the convergence of low-level IVT. I therefore encourage the authors to better clarify - in case I may have misunderstood or overlooked something - what the main points of novelty are.
Specific comments
L46
Is the choice of June–August arbitrary? Why not consider October–December, when SPEI6 also shows very low values?L53–54
It seems that something is missing before “SPEI6.” Moreover, SPEI6 remains low for the entire period until November, so this statement does not appear to be fully supported by the evidence.Figure S3
The decision to show all anomalies using dashed contours is unfortunate, as it makes it difficult to distinguish positive from negative anomalies. Why not represent anomalies using color shading and the mean field with contours?L65–70
Why not consider the divergence of IVT rather than IVT itself? Ultimately, we know that divergence is related to E–P (from the water balance equation), not IVT per se.Figure 1
This figure is poorly designed: it contains too many panels, the labels are very small and difficult to read, and there is no legend indicating which bars refer to NW Europe or SE Europe. I strongly encourage the authors to improve its legibility and overall quality.Figure 2
Why are April and September missing from this diagram?L211–212
Is this result truly surprising? Please see my comment in the General section.Citation: https://doi.org/10.5194/egusphere-2026-57-RC1 -
AC1: 'Reply on RC1', José C. Fernández-Alvarez, 29 Jul 2026
The comment was uploaded in the form of a supplement: https://egusphere.copernicus.org/preprints/2026/egusphere-2026-57/egusphere-2026-57-AC1-supplement.pdf
-
AC3: 'Reply on RC1', José C. Fernández-Alvarez, 29 Jul 2026
The comment was uploaded in the form of a supplement: https://egusphere.copernicus.org/preprints/2026/egusphere-2026-57/egusphere-2026-57-AC3-supplement.zip
-
AC1: 'Reply on RC1', José C. Fernández-Alvarez, 29 Jul 2026
-
RC2: 'Comment on egusphere-2026-57', Anonymous Referee #2, 14 Jul 2026
The manuscript shows the underlying physical mechanisms that gave rise to the 2022 european drought, placing special emphasis on the behavior of atmospheric moisture transport from source regions. From this point of view, the work is revealing and should be published after revisions.
The following comments are intended to strengthen clarity, they do not affect the core findings of the study:
Comment 1
According to the SPEI-6 values shown in the figure S1 and described in the supplementary methods, the study region corresponds to areas with SPEI 6 ≤ –1.28 from June to August 2022. However, throughout the manuscript the peak period is defined as May–August. Furthermore, Figure 1c shows that SPEI-6 anomalies in the NW region are larger in November–December 2022 than during the months of the proposed peak period. A clearer justification of the selected peak period and the delimitation of target regions should be provided.Comment 2
Figure 1 is difficult to follow without consulting the supplementary material. The figure includes numerous bar charts without titles, and the legends are placed at the end of the caption, which makes interpretation considerably less intuitive. I recommend making the legend (indicating the meaning of color intensity) more prominent. Additionally, the font size of the x and y axis labels is very small and should be increased to improve readability.Comment 3
From figure S5, it is not clear what the authors mean by the “land and ocean sectors of the North Atlantic domain.” The manuscript does not specify whether the “land sector” corresponds to the broader European land area, nor whether the NE and NW regions are included or excluded when defining these sectors. The same regarding whether the Atlantic oceanic sector refers to the whole Atlantic or whether it excludes the NATL region.Comment 4
Lines 159–160 state that averages for the two European subregions reveal distinct temporal and regional behaviours (Fig. 2). However, the three components of the temperature anomaly sources (adiabatic, diabatic, and advective) show broadly similar behaviours overall, as described in the subsequent lines. In addition, the patterns shown in the figures of the supplementary materials are also quite similar for both regions.Comment 5
Lines 212–213 state that “a long lasting anticyclonic pattern blocked convection.” It may be more accurate to refer to precipitation rather than convection, since anticyclones typically suppress frontal precipitation during winter months as well. In addition, the OLR anomalies shown in Figure S12 display different signs throughout the year.Comment 6
Finally, I would like to suggest that the authors consider submitting the manuscript as a research article rather than a brief communication. Although the topic is of social relevance and fits within the brief comunication’s scope, in my opinion the manuscript, in its current form, is difficult to fully understand without consulting the supplementary material. The main text is limited to 20 bibliographic references, but the supplementary material contains a nearly equivalent number of figures.Citation: https://doi.org/10.5194/egusphere-2026-57-RC2 -
AC2: 'Reply on RC2', José C. Fernández-Alvarez, 29 Jul 2026
The comment was uploaded in the form of a supplement: https://egusphere.copernicus.org/preprints/2026/egusphere-2026-57/egusphere-2026-57-AC2-supplement.pdf
-
AC4: 'Reply on RC2', José C. Fernández-Alvarez, 29 Jul 2026
The comment was uploaded in the form of a supplement: https://egusphere.copernicus.org/preprints/2026/egusphere-2026-57/egusphere-2026-57-AC4-supplement.zip
-
AC2: 'Reply on RC2', José C. Fernández-Alvarez, 29 Jul 2026
-
AC5: 'Comment on egusphere-2026-57', José C. Fernández-Alvarez, 29 Jul 2026
Dear Editor,
I would like to inform you that we have thoroughly addressed all comments from the reviewers. All modifications in the revised manuscript are clearly highlighted in blue using track changes, and the Supplementary Material has been updated following the same convention.
Additionally, I would like to clarify a small detail regarding the response document: the section corresponding to Reviewer 2 appears under a header labeled "Reviewer 1." This occurred because the original file was named "Reviewer 2," and during preparation the internal header was inadvertently left unchanged. Despite this labeling issue, the content in that section fully corresponds to Reviewer 2’s comments and our detailed responses.
Please let us know if you would prefer us to adjust the header or make any further modifications.
Kind regards, José Carlos Fernandez Alvarez
Peer review completion
Journal article(s) based on this preprint
Viewed
| HTML | XML | Total | Supplement | BibTeX | EndNote | |
|---|---|---|---|---|---|---|
| 1,308 | 652 | 120 | 2,080 | 426 | 122 | 275 |
- HTML: 1,308
- PDF: 652
- XML: 120
- Total: 2,080
- Supplement: 426
- BibTeX: 122
- EndNote: 275
Viewed (geographical distribution)
| Country | # | Views | % |
|---|
| Total: | 0 |
| HTML: | 0 |
| PDF: | 0 |
| XML: | 0 |
- 1
José C. Fernández-Alvarez

Raquel Nieto
Sergio M. Vicente-Serrano
David Carvalho
Luis Gimeno
The requested preprint has a corresponding peer-reviewed final revised paper. You are encouraged to refer to the final revised version.
- Preprint
(946 KB) - Metadata XML
-
Supplement
(10600 KB) - BibTeX
- EndNote
- Final revised paper
We show that the 2022 European drought was driven by a sharp reduction in precipitation contributions from Atlantic and Mediterranean moisture sources, despite enhanced atmospheric moisture uptake. Persistent anticyclonic circulation suppressed convection and diverted moisture away from Europe. Lagrangian temperature-source decomposition reveals strong adiabatic warming as the dominant heat driver.
We show that the 2022 European drought was driven by a sharp reduction in precipitation...
Review of “Atmospheric moisture and near-surface temperature anomalies: key drivers in the 2022 European mega-drought” by Fernández-Alvarez et al. (2026)
General assessment
This brief communication analyzes the 2022 drought from a Lagrangian perspective, highlighting the role of moisture sources and the nature of the heating that enhanced the drought. It is an interesting contribution; however, the degree of novelty appears moderate. Despite the very notable tracking techniques employed, the manuscript ultimately provides incremental progress in our understanding of the 2022 drought.
I recommend publication after revision, provided that the comments below are addressed.
General comment
The main statement in the abstract is that the 2022 drought was driven by “a sharp reduction in precipitation contributions from Atlantic and Mediterranean moisture sources, despite enhanced atmospheric moisture uptake.” However, is this result truly surprising? There are many regions in the world where precipitable water (PW) is abundant in the atmosphere, yet conditions remain dry (for example, the Red Sea region).
It is well established that it is not the IVT of PW itself that determines rainfall, but rather the convergence of low-level IVT. I therefore encourage the authors to better clarify - in case I may have misunderstood or overlooked something - what the main points of novelty are.
Specific comments
L46
Is the choice of June–August arbitrary? Why not consider October–December, when SPEI6 also shows very low values?
L53–54
It seems that something is missing before “SPEI6.” Moreover, SPEI6 remains low for the entire period until November, so this statement does not appear to be fully supported by the evidence.
Figure S3
The decision to show all anomalies using dashed contours is unfortunate, as it makes it difficult to distinguish positive from negative anomalies. Why not represent anomalies using color shading and the mean field with contours?
L65–70
Why not consider the divergence of IVT rather than IVT itself? Ultimately, we know that divergence is related to E–P (from the water balance equation), not IVT per se.
Figure 1
This figure is poorly designed: it contains too many panels, the labels are very small and difficult to read, and there is no legend indicating which bars refer to NW Europe or SE Europe. I strongly encourage the authors to improve its legibility and overall quality.
Figure 2
Why are April and September missing from this diagram?
L211–212
Is this result truly surprising? Please see my comment in the General section.