
the Creative Commons Attribution 4.0 License.
the Creative Commons Attribution 4.0 License.
 | 04 Feb 2026
Middle atmosphere chemical and dynamical effects in the CCMI-2022 stratospheric aerosol injection scenario
Abstract. Stratospheric aerosol injection (SAI) could slow surface warming and help prevent some irreversible tipping points in the climate system. However, potential side effects include changes in stratospheric ozone and warming due to infrared ab sorption by the aerosol, which can alter surface ultraviolet radiation, hydrology, and weather through stratosphere-troposphere coupling. Previous multi-model studies have reported large model discrepancies regarding these effects. Here we present results from an experiment within the Chemistry-Climate Model Initiative Phase 2 (CCMI-2022), designed to constrain inter-model uncertainties by applying a common stratospheric aerosol forcing to five chemistry-climate models using an SAI scenario offsetting all surface warming after 2025 in a moderate greenhouse gas emission scenario. All models show a global total column ozone decrease in the first three decades of no more than ∼10 DU relative to a no-SAI case. Despite sizable differences in stratospheric heating, the models yield a qualitatively similar pattern of ozone redistribution. Changes in key processes, such as the ClOx activation and NOx passivation, and the strengthening of the deep branch of the Brewer-Dobson circulation, are widely robust across all models, though their relative importance and contribution to ozone changes varies considerably. In three of the models, we separate chemical and dynamical contributions, and find significant nonlinearities from feedbacks between chemistry and dynamics, highlighting where model development and sensitivity experiments are most needed to advance the understanding of the middle atmosphere in future mitigation scenarios involving SAI.
Competing interests: At least one of the (co-)authors is a member of the editorial board of Atmospheric Chemistry and Physics. The peer-review process was guided by an independent editor, and the authors also have no other competing interests to declare.
Publisher's note: Copernicus Publications remains neutral with regard to jurisdictional claims made in the text, published maps, institutional affiliations, or any other geographical representation in this paper. While Copernicus Publications makes every effort to include appropriate place names, the final responsibility lies with the authors. Views expressed in the text are those of the authors and do not necessarily reflect the views of the publisher.-
Notice on discussion status
The requested preprint has a corresponding peer-reviewed final revised paper. You are encouraged to refer to the final revised version.
-
Preprint
(78706 KB)
-
The requested preprint has a corresponding peer-reviewed final revised paper. You are encouraged to refer to the final revised version.
- Preprint
(78706 KB) - Metadata XML
- BibTeX
- EndNote
- Final revised paper


Journal article(s) based on this preprint
Interactive discussion
Status: closed
- RC1: 'Comment on egusphere-2026-444', Anonymous Referee #1, 31 Mar 2026
-
RC2: 'Comment on egusphere-2026-444', Anonymous Referee #2, 08 May 2026
General Comments
The manuscript by Jörimann et al. uses multi-model atmosphere-only simulations from Phase 2 of the Chemistry Climate Model Initiative (CCMI-2022) to analyse the middle-atmosphere chemical and dynamical impacts from a prescribed enhancement to the stratospheric aerosol layer (senD2-sai) relative to a fixed time-invariant stratospheric aerosol layer (senD2-fix). An additional experiment is also included, in which the enhanced stratospheric aerosol layer is only coupled to the chemistry scheme (senD2-chem), thus enabling dynamical and chemical responses to be isolated.
The study finds that the global mean total column ozone response to the sai scenario is generally small (~10 DU), although there is heterogeneity in response with respect to both latitude and altitude. There is also evidence of strong dynamical heating, changes in tropopause pressure and temperature, and zonal winds. There are also sai-driven responses in age of air, distributions of long-lived greenhouse gases (e.g., N2O) and the partitioning between reactive and passive species for NOx, HOx, and ClOx that drive ozone depletion. Using the sensitivity experiment, the “chemical” responses in ozone from the stratospheric aerosol layer are small and that the bulk of the ozone response is due to dynamical changes.
The manuscript also makes recommendations for improving how the stratospheric aerosol layer could be implemented to improve consistency between the models.
On the whole, I found the manuscript to be interesting. It was generally well written, with clear figures and a logical flow to the analysis presented. The experimental design itself was well defined and removes one source of uncertainty in modelling responses to an enhancement in the stratospheric aerosol layer. However, some re-organization of the opening sections on the models and experimental setup is recommended – see Specific Comments below. I also thought that there was a missed opportunity in relation to the dynamical responses. Further details provided below. And the closing section could benefit from further discussion about the results and more of an in-depth outlook.
On balance, however, it has the potential to be a valuable contribution to our scientific literature and the community's understanding. I, therefore, recommend that the manuscript be accepted for publication, subject to the authors addressing some of the comments below, noting that there may be challenges with some of the points raised.
Specific Comments
- I wonder whether the authors considered running an additional sensitivity experiment to capture the responses due to the radiative effects of the stratospheric ozone layer, i.e., “dyn”. The abstract mentions non-linearities and one question is whether the full response is equal to the sum of the chemical and dynamical responses, i.e., non-linearity in the modelled responses.
- I think the manuscript would benefit from a re-organization in relation to the models involved in the study and the experimental setup. I’d suggest that you start off with the models, then introduce the generation of the time-evolving stratospheric aerosol layer from a coupled WACCM simulation, and then move on to describe the experiments. I think this would make the descriptions of senD2-sai and senD2-chem easier and would help to avoid multiple repetitions about the WACCM-produced dataset (e.g., in Section 2.1.3).
- It would also be good to make clear which models ran which experiments. At present, most model descriptions include how photolysis rates are calculated and whether they include the effects of aerosols on photolysis rates but this hasn’t been described consistently across all models (e.g., WACCM). While discussion around this point has focussed on its relevance to those models that have run the senD2-chem simulation, it is also relevant for the responses from the senD2-sai experiment.
- With those models that use pre-computed photolysis rates, there is a missed opportunity to assess the chemical effects of the prescribed stratospheric aerosol layer, both including and excluding the effects of the aerosol on photolysis rates. How feasible would it be to set up such an experiment?
- In Section 3.5, it would be good here to link the positive anomalies in ch4 and n2o abundances with the previous analysis on age of air. There appears to be some correlation between the strength of the ch4 and n2o anomalies with the age of air responses.
- I think the section on synthesis and outlook in the manuscript ended quite abruptly and I guess that I had been expecting more of a discussion and outlook. For example, there was no discussion about potential non-linearities and the focus seemed to be more about how the aerosol forcing was prescribed rather than model responses. The abstract highlighted that “significant nonlinearities from feedbacks between chemistry and dynamics, highlighting where model development and sensitivity experiments are most needed”. However, I thought that there could have been further discussion about this. A clear conclusion with a vision for next steps and relevant research gaps would be of some benefit to the community.
Technical Comments
- Line 54: The acronym SADs is used before it is defined
- For readers not familiar with the simulations in CCMI-2022, the heading “refD2” is not very informative. How about something like “Heritage of Reference simulation senD2-fix”? This would provide a better linkage to the preceding section on this study’s model simulations and still allows you to introduce refD2 and how it relates to senD2-fix.
- There is some repetition in Section 2.1.2 in relation to SSTs/SIC and the prescribed stratospheric aerosol in senD2-fix
- The term WACCM is used without giving the model its full name (Line 88)
- Line 126: Missing closing bracket
- Lines 128-133: I think some of the phrasing in this portion of the manuscript is clumsy. Here are some examples of suggested changes.The phrasing “the stratospheric aerosol is considered to be fully radiatively inactive” could be replaced with “the stratospheric aerosol is radiatively inactive”. The sentences “Neglecting the aerosol effect on photolysis would therefore not just separate the "chemical-only" effect in senD2-chem, but more specifically, the "heterogeneous-chemistry" effect. The complete chemical effect, in turn, is separated by still accounting for the photolysis effect, while keeping the radiative aerosol properties at background (2025) levels” are other examples. How about “Neglecting the aerosol effect on photolysis would therefore only isolate the "heterogeneous-chemistry" effect of the aerosol. However, the full chemistry effect, in principle, should also account for the photolysis effect, while keeping the radiative aerosol properties at background (2025) levels.” The sentence “In practice, not every model can easily choose between simulating senD2-chem in one way or the other.” could be replaced with “In practice, the implementation is challenging and hence differs across the model ensemble.”
- Line 147: Maintained at what level? Specific to a particular time period? Please make clear.
- Lines 150 and 152: “as a function of”
- Line 161: Add full names for DJF and JJA and indicate that they represent Northern Hemisphere winter and summer.
- Figure 1 caption: I think it would be better here to indicate that this is the forcing applied in the models or the output from the coupled WACCM simulation that generated the stratospheric aerosol outputs, rather than state that it’s an output from senD2-sai. Figure 2 is more about verifying that the models have correctly interpreted the forcing and reflects model output from senD2-sai (Opening lines from Section 3.1).
- Section 2.2; It would be useful to indicate how the timeseries of stratospheric aerosol compares to scenarios used in the Geoengineering Model Intercomparison Project (GeoMIP), for example.
- Line 179: Correct spelling for version (i.e., version)
- Line 181: Did you really mean “solution species”? It isn’t a term that I’ve come across before in the context of chemistry-climate models!
- Line 187: change “configurations used here run” to “configuration used here runs”
- Lines 203-204: Change “which can result in too large reaction rates under in-situ low temperature.” to “which can result in reaction rates under in-situ low temperatures to be too large.”
- Line 215: Is there any need to include refD2? Can you add senD2-chem here?
- Line 225: Change “resolution 0.7 km” to “resolution of 0.7 km”
- Line 226: Change “the QBO” to “a QBO”
- Line 252: The term “Junge layer” was new to me – could you add a brief sentence explaining what it is? It might be useful for other readers!
- Line 278: Change “different extra-tropic latitudes” to “different extra-tropical latitudes”
- Line 281: Correct “in the the annual average”
- Lines 282-284: Two of the models (CMAM, MIROC) exhibit little variability on a decadal to multi-decadal timescales, and hence, do show positive anomalies (at the 10-20 DU level) in the Arctic. Please alter wording.
- Line 299: Although the preceding line refers to analysing senD2-chem, the opening line of this paragraph is referring to the temperature response in senD2-sai (i.e., 5 model responses shown in Figure 4). I think this should be made clearer.
- Figure 4: Please try to avoid having the “N/A” age of air panels for the models NIES and WACCM – if you can have them completely “whited out”, I think that would be better.
- Line 310: I think this is the first occurrence of “SH” and should be defined in full along with the abbreviated form. Same for BDC on line 314.
- Line 312: Changed “ideal” to “idealised”
- Line 329: Change “observed” to “simulated”
- Figure 5: It has a mix of timescales (2069-2079 in panel a and 2030-2043 and 2070-2083 in panel b). I wonder whether the time periods considered could be made consistent and two time periods plotted for the tropopause pressure anomalies.
- Line 333: Move the word “well” to the end of the sentence.
- Lines 345 and 347: Change “percent” to “percentage”
- Lines 349/350: Change “hydrogen monoxide” to the “hydroxyl (OH) radical”
- Line 364: Change “to play” to “play” and change “hydrogen oxide” to “odd hydrogen”
- Line 375: change “from water” to “from the water”
- Line 391: Please change to “nitric acid”
- Line 424: Region 1 here is in the tropics. Suggest that you change “lowermost stratosphere” to “tropical lowermost stratosphere”
- Section 3.7: I really liked this section and how the interpretation of the ozone anomalies was broken down into regions, with the section text clearly linked with the annotated regions of the atmosphere on Figure 9.
- From Line 465: I would suggest that you break up this section into a number of paragraphs. For example, one break could be the start of presenting the results for the tropics, i.e., “In the “full” ….”. A second breaking point would be the switch from tropics to southern latitudes.
Citation: https://doi.org/10.5194/egusphere-2026-444-RC2 -
AC1: 'Comment on egusphere-2026-444', Andrin Jörimann, 01 Jun 2026
The comment was uploaded in the form of a supplement: https://egusphere.copernicus.org/preprints/2026/egusphere-2026-444/egusphere-2026-444-AC1-supplement.pdf
Peer review completion


Interactive discussion
Status: closed
-
RC1: 'Comment on egusphere-2026-444', Anonymous Referee #1, 31 Mar 2026
Major comments
The paper contains a comparison of 5 chemistry climate models on geo-engineering in the framework of CCMI. The paper might be suitable for
Atmospheric Chemistry and Physics after some mostly minor revisions.In the abstract the kind of simulation and the time period should be mentioned. Only acronyms for insiders are not sufficient. The abstract should also include more results. The description of the simulations requires some clarifications. It also looks like that one model has not simulated the full time period (without mentioning in text).
Specific comments
Line 7: Please mention simulation period and if the simulation is transient (or time slice?).
Line 82: Transient SAD?
Line 85: 'Forcings' or VMRs of radiatively active species like GHGs, ODS, sulfate? Refer at least to Table 1.
Table 1: Is the here mentioned WMO-Report used or the one of line 40? Please clarify or correct. Are GHGs and ODS transient? Please mention in caption and/or the corresponding rows. QBO nudged to what? References or links?
Line 97: 'SSTs and SIC' from model HadlSSTI? Please be clear here.
Line 104: Complete the WMO-citation here.
Line 135: Are there 2 ozone tracers in this scenario, one for radiation (solar and IR) and one for chemistry? Please clarify and add a sentence on that.
Line 175: Odd assumption. This may add biases.
Line 185: Assumptions for volcanoes in the future?
Line 194: Include '(T63)'.
Line 209: Is it possible, to convert this to a notation consistent with the one used in the other models?
Line 212: List the 6 halocarbons.
Line 256ff: Does TCO include model specific tropospheric ozone (which only partially cancels out in differences)? I also would prefer to use the abbreviation 'total ozone' later in the text.
Line 349: Photolysis of what? This sentence is confusing, please be more specific. Is more formation of O(1D) by photolysis of ozone and subsequent OH production meant?
Line 350: Insert 'and the largest increase in tropical upwelling'.
Line 401f: It might be too warm for the heterogeneous reactions HCl+ClONO2 and H2O+ClONO2 here.
Line 404: 'because of too high temperatures there...'
Line 411: 'key regions' should be in title of subsection for easier reading.
Line 413ff: It might be better to merge Fig. 9 and Fig. C1 for easier reading, especially concerning the panel with 'dyn'. The same holds for Fig. 10 and Fig. C2.
Figure 10: Inconsistent to Figure 2 concerning time period.
Line 517 : i.e. equivalent latitude.Technical corrections
Line 79: Typo.
Table 1: Improve syntax of citation.
Figure 2: WACCM-results missing after 2082. Unit missing at y-axis of panel b.
Figure 3: 'ppmv'.
Line 423: Better ':' instead of '.'.
Line 452: Improve wording.
Line 484: Typo.
Line 569: Typo.
Line 622, 656, 665: DOI or link?
Line 739 and 742: Provide links to electronic version or DOI, available at least for WMO (2019).Citation: https://doi.org/10.5194/egusphere-2026-444-RC1 -
RC2: 'Comment on egusphere-2026-444', Anonymous Referee #2, 08 May 2026
General Comments
The manuscript by Jörimann et al. uses multi-model atmosphere-only simulations from Phase 2 of the Chemistry Climate Model Initiative (CCMI-2022) to analyse the middle-atmosphere chemical and dynamical impacts from a prescribed enhancement to the stratospheric aerosol layer (senD2-sai) relative to a fixed time-invariant stratospheric aerosol layer (senD2-fix). An additional experiment is also included, in which the enhanced stratospheric aerosol layer is only coupled to the chemistry scheme (senD2-chem), thus enabling dynamical and chemical responses to be isolated.
The study finds that the global mean total column ozone response to the sai scenario is generally small (~10 DU), although there is heterogeneity in response with respect to both latitude and altitude. There is also evidence of strong dynamical heating, changes in tropopause pressure and temperature, and zonal winds. There are also sai-driven responses in age of air, distributions of long-lived greenhouse gases (e.g., N2O) and the partitioning between reactive and passive species for NOx, HOx, and ClOx that drive ozone depletion. Using the sensitivity experiment, the “chemical” responses in ozone from the stratospheric aerosol layer are small and that the bulk of the ozone response is due to dynamical changes.
The manuscript also makes recommendations for improving how the stratospheric aerosol layer could be implemented to improve consistency between the models.
On the whole, I found the manuscript to be interesting. It was generally well written, with clear figures and a logical flow to the analysis presented. The experimental design itself was well defined and removes one source of uncertainty in modelling responses to an enhancement in the stratospheric aerosol layer. However, some re-organization of the opening sections on the models and experimental setup is recommended – see Specific Comments below. I also thought that there was a missed opportunity in relation to the dynamical responses. Further details provided below. And the closing section could benefit from further discussion about the results and more of an in-depth outlook.
On balance, however, it has the potential to be a valuable contribution to our scientific literature and the community's understanding. I, therefore, recommend that the manuscript be accepted for publication, subject to the authors addressing some of the comments below, noting that there may be challenges with some of the points raised.
Specific Comments
- I wonder whether the authors considered running an additional sensitivity experiment to capture the responses due to the radiative effects of the stratospheric ozone layer, i.e., “dyn”. The abstract mentions non-linearities and one question is whether the full response is equal to the sum of the chemical and dynamical responses, i.e., non-linearity in the modelled responses.
- I think the manuscript would benefit from a re-organization in relation to the models involved in the study and the experimental setup. I’d suggest that you start off with the models, then introduce the generation of the time-evolving stratospheric aerosol layer from a coupled WACCM simulation, and then move on to describe the experiments. I think this would make the descriptions of senD2-sai and senD2-chem easier and would help to avoid multiple repetitions about the WACCM-produced dataset (e.g., in Section 2.1.3).
- It would also be good to make clear which models ran which experiments. At present, most model descriptions include how photolysis rates are calculated and whether they include the effects of aerosols on photolysis rates but this hasn’t been described consistently across all models (e.g., WACCM). While discussion around this point has focussed on its relevance to those models that have run the senD2-chem simulation, it is also relevant for the responses from the senD2-sai experiment.
- With those models that use pre-computed photolysis rates, there is a missed opportunity to assess the chemical effects of the prescribed stratospheric aerosol layer, both including and excluding the effects of the aerosol on photolysis rates. How feasible would it be to set up such an experiment?
- In Section 3.5, it would be good here to link the positive anomalies in ch4 and n2o abundances with the previous analysis on age of air. There appears to be some correlation between the strength of the ch4 and n2o anomalies with the age of air responses.
- I think the section on synthesis and outlook in the manuscript ended quite abruptly and I guess that I had been expecting more of a discussion and outlook. For example, there was no discussion about potential non-linearities and the focus seemed to be more about how the aerosol forcing was prescribed rather than model responses. The abstract highlighted that “significant nonlinearities from feedbacks between chemistry and dynamics, highlighting where model development and sensitivity experiments are most needed”. However, I thought that there could have been further discussion about this. A clear conclusion with a vision for next steps and relevant research gaps would be of some benefit to the community.
Technical Comments
- Line 54: The acronym SADs is used before it is defined
- For readers not familiar with the simulations in CCMI-2022, the heading “refD2” is not very informative. How about something like “Heritage of Reference simulation senD2-fix”? This would provide a better linkage to the preceding section on this study’s model simulations and still allows you to introduce refD2 and how it relates to senD2-fix.
- There is some repetition in Section 2.1.2 in relation to SSTs/SIC and the prescribed stratospheric aerosol in senD2-fix
- The term WACCM is used without giving the model its full name (Line 88)
- Line 126: Missing closing bracket
- Lines 128-133: I think some of the phrasing in this portion of the manuscript is clumsy. Here are some examples of suggested changes.The phrasing “the stratospheric aerosol is considered to be fully radiatively inactive” could be replaced with “the stratospheric aerosol is radiatively inactive”. The sentences “Neglecting the aerosol effect on photolysis would therefore not just separate the "chemical-only" effect in senD2-chem, but more specifically, the "heterogeneous-chemistry" effect. The complete chemical effect, in turn, is separated by still accounting for the photolysis effect, while keeping the radiative aerosol properties at background (2025) levels” are other examples. How about “Neglecting the aerosol effect on photolysis would therefore only isolate the "heterogeneous-chemistry" effect of the aerosol. However, the full chemistry effect, in principle, should also account for the photolysis effect, while keeping the radiative aerosol properties at background (2025) levels.” The sentence “In practice, not every model can easily choose between simulating senD2-chem in one way or the other.” could be replaced with “In practice, the implementation is challenging and hence differs across the model ensemble.”
- Line 147: Maintained at what level? Specific to a particular time period? Please make clear.
- Lines 150 and 152: “as a function of”
- Line 161: Add full names for DJF and JJA and indicate that they represent Northern Hemisphere winter and summer.
- Figure 1 caption: I think it would be better here to indicate that this is the forcing applied in the models or the output from the coupled WACCM simulation that generated the stratospheric aerosol outputs, rather than state that it’s an output from senD2-sai. Figure 2 is more about verifying that the models have correctly interpreted the forcing and reflects model output from senD2-sai (Opening lines from Section 3.1).
- Section 2.2; It would be useful to indicate how the timeseries of stratospheric aerosol compares to scenarios used in the Geoengineering Model Intercomparison Project (GeoMIP), for example.
- Line 179: Correct spelling for version (i.e., version)
- Line 181: Did you really mean “solution species”? It isn’t a term that I’ve come across before in the context of chemistry-climate models!
- Line 187: change “configurations used here run” to “configuration used here runs”
- Lines 203-204: Change “which can result in too large reaction rates under in-situ low temperature.” to “which can result in reaction rates under in-situ low temperatures to be too large.”
- Line 215: Is there any need to include refD2? Can you add senD2-chem here?
- Line 225: Change “resolution 0.7 km” to “resolution of 0.7 km”
- Line 226: Change “the QBO” to “a QBO”
- Line 252: The term “Junge layer” was new to me – could you add a brief sentence explaining what it is? It might be useful for other readers!
- Line 278: Change “different extra-tropic latitudes” to “different extra-tropical latitudes”
- Line 281: Correct “in the the annual average”
- Lines 282-284: Two of the models (CMAM, MIROC) exhibit little variability on a decadal to multi-decadal timescales, and hence, do show positive anomalies (at the 10-20 DU level) in the Arctic. Please alter wording.
- Line 299: Although the preceding line refers to analysing senD2-chem, the opening line of this paragraph is referring to the temperature response in senD2-sai (i.e., 5 model responses shown in Figure 4). I think this should be made clearer.
- Figure 4: Please try to avoid having the “N/A” age of air panels for the models NIES and WACCM – if you can have them completely “whited out”, I think that would be better.
- Line 310: I think this is the first occurrence of “SH” and should be defined in full along with the abbreviated form. Same for BDC on line 314.
- Line 312: Changed “ideal” to “idealised”
- Line 329: Change “observed” to “simulated”
- Figure 5: It has a mix of timescales (2069-2079 in panel a and 2030-2043 and 2070-2083 in panel b). I wonder whether the time periods considered could be made consistent and two time periods plotted for the tropopause pressure anomalies.
- Line 333: Move the word “well” to the end of the sentence.
- Lines 345 and 347: Change “percent” to “percentage”
- Lines 349/350: Change “hydrogen monoxide” to the “hydroxyl (OH) radical”
- Line 364: Change “to play” to “play” and change “hydrogen oxide” to “odd hydrogen”
- Line 375: change “from water” to “from the water”
- Line 391: Please change to “nitric acid”
- Line 424: Region 1 here is in the tropics. Suggest that you change “lowermost stratosphere” to “tropical lowermost stratosphere”
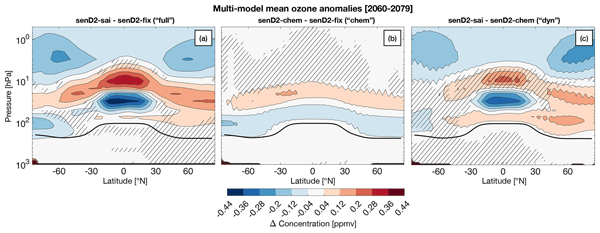
- Section 3.7: I really liked this section and how the interpretation of the ozone anomalies was broken down into regions, with the section text clearly linked with the annotated regions of the atmosphere on Figure 9.
- From Line 465: I would suggest that you break up this section into a number of paragraphs. For example, one break could be the start of presenting the results for the tropics, i.e., “In the “full” ….”. A second breaking point would be the switch from tropics to southern latitudes.
Citation: https://doi.org/10.5194/egusphere-2026-444-RC2 -
AC1: 'Comment on egusphere-2026-444', Andrin Jörimann, 01 Jun 2026
The comment was uploaded in the form of a supplement: https://egusphere.copernicus.org/preprints/2026/egusphere-2026-444/egusphere-2026-444-AC1-supplement.pdf
Peer review completion
Journal article(s) based on this preprint
Data sets
CCMI-2022 post-processed model data Andrin Jörimann https://zenodo.org/records/18331211
Viewed
| HTML | XML | Total | BibTeX | EndNote | |
|---|---|---|---|---|---|
| 1,342 | 679 | 152 | 2,173 | 302 | 337 |
- HTML: 1,342
- PDF: 679
- XML: 152
- Total: 2,173
- BibTeX: 302
- EndNote: 337
Viewed (geographical distribution)
| Country | # | Views | % |
|---|
| Total: | 0 |
| HTML: | 0 |
| PDF: | 0 |
| XML: | 0 |
- 1
Saved

Andrin Jörimann

Timofei Sukhodolov
Simone Tilmes
David Plummer
Shingo Watanabe
Hideharu Akiyoshi
Gabriel Chiodo
Daniele Visioni
Sandro Vattioni
Eugene Rozanov
Ewa M. Bednarz
Béatrice Jossé
Yousuke Yamashita
Thomas Peter
The requested preprint has a corresponding peer-reviewed final revised paper. You are encouraged to refer to the final revised version.
- Preprint
(78706 KB) - Metadata XML
Major comments
The paper contains a comparison of 5 chemistry climate models on geo-engineering in the framework of CCMI. The paper might be suitable for
Atmospheric Chemistry and Physics after some mostly minor revisions.
In the abstract the kind of simulation and the time period should be mentioned. Only acronyms for insiders are not sufficient. The abstract should also include more results. The description of the simulations requires some clarifications. It also looks like that one model has not simulated the full time period (without mentioning in text).
Specific comments
Line 7: Please mention simulation period and if the simulation is transient (or time slice?).
Line 82: Transient SAD?
Line 85: 'Forcings' or VMRs of radiatively active species like GHGs, ODS, sulfate? Refer at least to Table 1.
Table 1: Is the here mentioned WMO-Report used or the one of line 40? Please clarify or correct. Are GHGs and ODS transient? Please mention in caption and/or the corresponding rows. QBO nudged to what? References or links?
Line 97: 'SSTs and SIC' from model HadlSSTI? Please be clear here.
Line 104: Complete the WMO-citation here.
Line 135: Are there 2 ozone tracers in this scenario, one for radiation (solar and IR) and one for chemistry? Please clarify and add a sentence on that.
Line 175: Odd assumption. This may add biases.
Line 185: Assumptions for volcanoes in the future?
Line 194: Include '(T63)'.
Line 209: Is it possible, to convert this to a notation consistent with the one used in the other models?
Line 212: List the 6 halocarbons.
Line 256ff: Does TCO include model specific tropospheric ozone (which only partially cancels out in differences)? I also would prefer to use the abbreviation 'total ozone' later in the text.
Line 349: Photolysis of what? This sentence is confusing, please be more specific. Is more formation of O(1D) by photolysis of ozone and subsequent OH production meant?
Line 350: Insert 'and the largest increase in tropical upwelling'.
Line 401f: It might be too warm for the heterogeneous reactions HCl+ClONO2 and H2O+ClONO2 here.
Line 404: 'because of too high temperatures there...'
Line 411: 'key regions' should be in title of subsection for easier reading.
Line 413ff: It might be better to merge Fig. 9 and Fig. C1 for easier reading, especially concerning the panel with 'dyn'. The same holds for Fig. 10 and Fig. C2.
Figure 10: Inconsistent to Figure 2 concerning time period.
Line 517 : i.e. equivalent latitude.
Technical corrections
Line 79: Typo.
Table 1: Improve syntax of citation.
Figure 2: WACCM-results missing after 2082. Unit missing at y-axis of panel b.
Figure 3: 'ppmv'.
Line 423: Better ':' instead of '.'.
Line 452: Improve wording.
Line 484: Typo.
Line 569: Typo.
Line 622, 656, 665: DOI or link?
Line 739 and 742: Provide links to electronic version or DOI, available at least for WMO (2019).