
the Creative Commons Attribution 4.0 License.
the Creative Commons Attribution 4.0 License.
 | 21 Jan 2026
Arctic sea ice predictability on daily-to-weekly timescales: sensitivity to initial positional errors under different rheology formulations
Abstract. We investigates short-term (daily-to-weekly) winter Arctic sea-ice predictability using a coupled ice–ocean model, and focusing on how sensitive forecasts are to initial uncertainty in the location of sea ice features (e.g., leads, ridges, etc.). In this context, two rheologies are compared: elastic–viscous–plastic (aEVP) and brittle Bingham–Maxwell (BBM). For January–March 1997, we conduct 10-day ensemble forecasts, initialized by applying displacement perturbations to all sea-ice fields to represent initial positional errors, while keeping atmospheric forcing identical for all the ensemble members. Potential predictability is evaluated using a “perfect model” framework and probabilistic metrics for the ice-edge position errors, local state-variable errors (concentration, thickness, drift, deformation), and the spread of virtual drifters. Ice-edge forecasts are found to be largely insensitive to initial positional errors for both rheologies, indicating dominance of thermodynamic forcing rather than ice dynamics at short lead times. In contrast, BBM exhibits strong nonlinear sensitivity in pack ice: predictability is limited to 1–5 days for drift and deformation and 5–10 days for concentration. The aEVP model, on the other hand, quickly damps small-scale heterogeneities, yielding more convergent, and thus more predictable solutions. These findings have concrete implications: the BBM model produces larger regions with high probability of intense deformation and the spread of Lagrangian drifters up to an order of magnitude greater than in the aEVP model. Our results underscore the importance of ensemble forecasting for quantifying risks in a highly nonlinear and weakly predictable sea-ice system.
-
Notice on discussion status
The requested preprint has a corresponding peer-reviewed final revised paper. You are encouraged to refer to the final revised version.
-
Preprint
(11538 KB)
-
The requested preprint has a corresponding peer-reviewed final revised paper. You are encouraged to refer to the final revised version.
- Preprint
(11538 KB) - Metadata XML
- BibTeX
- EndNote
- Final revised paper


Journal article(s) based on this preprint
Interactive discussion
Status: closed
-
RC1: 'Comment on egusphere-2025-6379', Anonymous Referee #1, 03 Mar 2026
-
AC2: 'Reply on RC1', Stéphanie Leroux, 23 Apr 2026
We would like to thank the Reviewer for their careful evaluation of our manuscript and for the constructive comments provided that will greatly improve the final manuscript. Attached below are our detailed point-by-point response as well as the revised figures with improved size and quality, as requested.
-
AC2: 'Reply on RC1', Stéphanie Leroux, 23 Apr 2026
-
RC2: 'Comment on egusphere-2025-6379', Anonymous Referee #2, 05 Mar 2026
The manuscript compares the commonly used aEVP rheology with the recently introduced BBM rheology. In my opinion the manuscript is well written and see no immediate flaws in its science. However, I am unfamiliar with the topic.
There is one major technical issue, namely that the figures are of poor quality and often illegible.
Citation: https://doi.org/10.5194/egusphere-2025-6379-RC2 -
AC1: 'Reply on RC2', Stéphanie Leroux, 23 Apr 2026
We would like to thank the Reviewer for their evaluation of our manuscript.
Both Reviewers made a comment on the quality of the figures. We will provided improved figures (resolution and font sizes) in the revised manuscript (cf figures attached).
-
AC1: 'Reply on RC2', Stéphanie Leroux, 23 Apr 2026
Peer review completion


Interactive discussion
Status: closed
-
RC1: 'Comment on egusphere-2025-6379', Anonymous Referee #1, 03 Mar 2026
General Comments
This paper evaluates the short-term (daily-to-weekly) dynamical sensitivity of Arctic Sea ice to initial positional errors under two rheological frameworks: Elasto-Visco-Plastic (aEVP) and Brittle Bingham-Maxwell (BBM). Using a "perfect model" framework, the study highlights that the BBM model exhibits stronger nonlinear sensitivity in pack ice, reaching a predictability limit for drift and deformation within 1-5 days. These findings provide valuable insights into the choice of rheological models and have practical implications for operational polar ice forecasting and search-and-rescue efforts.
Overall, the experimental design is interesting, the workload is solid and the language is generally fluent, certain parts need to be streamlined. My concerns regarding this paper primarily focus on the following aspects: the interpretation of the model configuration, the depth of the physical explanations, and the applicability of the findings to the modern, thinner Arctic ice. If these issues can be fully discussed in this paper, I believe it will improve the contribution and research significance of this paper. Beyond that I think this work fits in the scope of TC and can be published after reasonably addressing the following concerns and recommending moderate to major revision.
Specific comments
- The authors selected January-March 1997 as the initial conditions for their simulations. While I understand that the year 1997 was chosen to take advantage of the RGPS assessment in Brodeau et al. (2024), the Arctic has transitioned into a "New Arctic" state characterized by thinner, more mobile, and more easily deformable first-year ice, alongside a warmer and more strongly stratified ocean. Readers will inevitably question how instructive predictability estimates based on the thick-ice conditions of 1997 are for contemporary Arctic forecasting. Given that the authors emphasize the operational relevance of this work, I strongly recommend they fully explain their reasons for selecting 1997 as the study period. I also recommend the author provide reasonable physical speculations in the Discussion section regarding how this shift to a "New Arctic" might alter their results. For instance, with a thinner and more fragile ice cover, the internal compressive strength of the ice decreases, thereby amplifying the dominant role of wind stress and ocean drag in the momentum balance. Consequently, is it highly likely that the "1-to-5-day predictability limit" derived from the 1997 thick-ice baseline essentially represents an upper bound under modern "New Arctic" conditions? And something like that…… Additionally, I also recommend clearly explain what are the substantive implications of this study for future model improvements and ‘new Arctic’ forecasting? I believe addressing these implications will significantly strengthen the paper.
- The experimental description in this manuscript encompasses multiple stages (Initialization, single unperturbed reference simulation, extraction of states for P1-P8, spatial perturbation, ensemble branching for BBM and aEVP….). However, I found the narrative somewhat scattered while reading, requiring me to read through the entire text to fully piece the setup together. This is not reader-friendly, because the readers are not familiar with your experimental logic and components. Therefore, I strongly recommend that the authors restructure this section to improve its logical flow. Adding a clear table or a flowchart to illustrate experimental description would greatly help clarify the overall framework.
- The authors briefly discuss the impact of the 15-day spin-up on sea ice thickness, this short spin-up period is also critical for the ocean module in the ice-ocean coupled model. When initializing the regional ocean model with GLORYS12 reanalysis data, the upper ocean mixed layer and surface currents inevitably undergo a geostrophic adjustment period to adapt to the new grid, bathymetry, and specific surface fluxes. Because ocean drag and ice-ocean flux is also an important term in the sea ice momentum/thermodynamics equation, any transient instabilities in the ocean surface currents during this initial phase could inadvertently force the sea ice, potentially affecting sea ice drift and LKFs. I am not asking that the authors rerun the computationally expensive ensemble simulations. However, to decrease the reader's doubts about this point, I recommend adding some sentences in the Discussion to explore how the transient state of the upper ocean might interact with sea ice rheology. This will greatly enrich the physical depth of the paper and provide better guidance for future modeling efforts.
- Lines 160-171: The method employs random displacement maps to initialize positional errors. While I am not intimately familiar with the specific technical details of this procedure, I am curious as to how this approach handles local mass conservation and sub-grid ice thickness categories. I suggest a clearer explanation of this in the text.
- Lines 350-365: Extensive paragraphs are devoted to explaining the differences in CRPS curves between specific periods. This distracts from the core message. Please synthesize this section (this also applies to the rest of Sections 3 and 4).
Minor Comments
Line 35: Please clearly define the metric or index used for "potential predictability" early in the text to help readers build an intuitive understanding.
Lines 45-46: The introduction mentions that the BBM framework was developed to more realistically capture linear deformation patterns. However, it lacks accessible physical explanation of the core differences between BBM and aEVP. A clearer physical explanation would make this section much more accessible.
Lines 108-110: Please clarify if the thermodynamic parameters are same between the two configurations.
Lines 103-104: The model configuration is 1/4 horizontal resolution. Given that actual sea ice deformation scales range from hundreds of meters to a few kilometers, I suggest the authors add some discussion about whether higher resolution models would make the discrepancy in sensitivity between aEVP and BBM even more pronounced.
Line 170: Only the sea ice state is perturbed, while the ocean state remains unperturbed. Perturbing only the sea ice immediately breaks the local atm-ice-ocean momentum balance. This maybe small in winter when the area of open water is very small, but I would still suggest that the authors add a few sentences discussing the potential impact of this initial change on the error growth rate.
Lines 222-224: There is a persistent 10°bias in the aEVP trajectories, but it lacks some physical explain. Could you add sentences to discuss if this is related to aEVP's strong viscous forces interfering with the ice pack's geostrophic adjustment to the Coriolis force? or is it due to other processes?
Lines 430-434: Defining high-deformation events using the 95th percentile is statistically sound. I suggest also providing the absolute physical threshold values would be highly beneficial for readers' intuition.
Lines 378-382: The authors found that thickness behaves entirely differently from other variables, retaining predictability beyond 10 days. Could the authors explain why thickness memory persists so long?
Technical corrections
Line 7: We investigates -- We investigate
Line 131: Janurary -- January
Line 144: heterogenities -- heterogeneities
Line 421: rapidely -- rapidly
Figure 8 caption: hincasts -- hindcasts
Figure 12 caption: intialized -- initialized
Most Figures’ labels and legends are much too small. Some require more than 200% magnification to read. Please increase the font sizes.
Figure A1, A2: axis lacks units.
Citation: https://doi.org/10.5194/egusphere-2025-6379-RC1 -
AC2: 'Reply on RC1', Stéphanie Leroux, 23 Apr 2026
We would like to thank the Reviewer for their careful evaluation of our manuscript and for the constructive comments provided that will greatly improve the final manuscript. Attached below are our detailed point-by-point response as well as the revised figures with improved size and quality, as requested.
-
RC2: 'Comment on egusphere-2025-6379', Anonymous Referee #2, 05 Mar 2026
The manuscript compares the commonly used aEVP rheology with the recently introduced BBM rheology. In my opinion the manuscript is well written and see no immediate flaws in its science. However, I am unfamiliar with the topic.
There is one major technical issue, namely that the figures are of poor quality and often illegible.
Citation: https://doi.org/10.5194/egusphere-2025-6379-RC2 -
AC1: 'Reply on RC2', Stéphanie Leroux, 23 Apr 2026
We would like to thank the Reviewer for their evaluation of our manuscript.
Both Reviewers made a comment on the quality of the figures. We will provided improved figures (resolution and font sizes) in the revised manuscript (cf figures attached).
-
AC1: 'Reply on RC2', Stéphanie Leroux, 23 Apr 2026
Peer review completion
Journal article(s) based on this preprint
Viewed
| HTML | XML | Total | BibTeX | EndNote | |
|---|---|---|---|---|---|
| 1,143 | 444 | 130 | 1,717 | 88 | 180 |
- HTML: 1,143
- PDF: 444
- XML: 130
- Total: 1,717
- BibTeX: 88
- EndNote: 180
Viewed (geographical distribution)
| Country | # | Views | % |
|---|
| Total: | 0 |
| HTML: | 0 |
| PDF: | 0 |
| XML: | 0 |
- 1
Stephanie Leroux
Pierre Rampal
Jean-Michel Brankart
The requested preprint has a corresponding peer-reviewed final revised paper. You are encouraged to refer to the final revised version.
- Preprint
(11538 KB) - Metadata XML
General Comments
This paper evaluates the short-term (daily-to-weekly) dynamical sensitivity of Arctic Sea ice to initial positional errors under two rheological frameworks: Elasto-Visco-Plastic (aEVP) and Brittle Bingham-Maxwell (BBM). Using a "perfect model" framework, the study highlights that the BBM model exhibits stronger nonlinear sensitivity in pack ice, reaching a predictability limit for drift and deformation within 1-5 days. These findings provide valuable insights into the choice of rheological models and have practical implications for operational polar ice forecasting and search-and-rescue efforts.
Overall, the experimental design is interesting, the workload is solid and the language is generally fluent, certain parts need to be streamlined. My concerns regarding this paper primarily focus on the following aspects: the interpretation of the model configuration, the depth of the physical explanations, and the applicability of the findings to the modern, thinner Arctic ice. If these issues can be fully discussed in this paper, I believe it will improve the contribution and research significance of this paper. Beyond that I think this work fits in the scope of TC and can be published after reasonably addressing the following concerns and recommending moderate to major revision.
Specific comments
Minor Comments
Line 35: Please clearly define the metric or index used for "potential predictability" early in the text to help readers build an intuitive understanding.
Lines 45-46: The introduction mentions that the BBM framework was developed to more realistically capture linear deformation patterns. However, it lacks accessible physical explanation of the core differences between BBM and aEVP. A clearer physical explanation would make this section much more accessible.
Lines 108-110: Please clarify if the thermodynamic parameters are same between the two configurations.
Lines 103-104: The model configuration is 1/4 horizontal resolution. Given that actual sea ice deformation scales range from hundreds of meters to a few kilometers, I suggest the authors add some discussion about whether higher resolution models would make the discrepancy in sensitivity between aEVP and BBM even more pronounced.
Line 170: Only the sea ice state is perturbed, while the ocean state remains unperturbed. Perturbing only the sea ice immediately breaks the local atm-ice-ocean momentum balance. This maybe small in winter when the area of open water is very small, but I would still suggest that the authors add a few sentences discussing the potential impact of this initial change on the error growth rate.
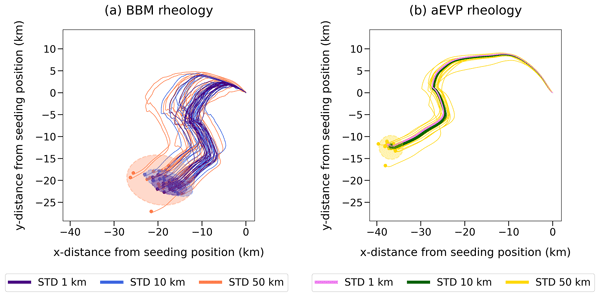
Lines 222-224: There is a persistent 10°bias in the aEVP trajectories, but it lacks some physical explain. Could you add sentences to discuss if this is related to aEVP's strong viscous forces interfering with the ice pack's geostrophic adjustment to the Coriolis force? or is it due to other processes?
Lines 430-434: Defining high-deformation events using the 95th percentile is statistically sound. I suggest also providing the absolute physical threshold values would be highly beneficial for readers' intuition.
Lines 378-382: The authors found that thickness behaves entirely differently from other variables, retaining predictability beyond 10 days. Could the authors explain why thickness memory persists so long?
Technical corrections
Line 7: We investigates -- We investigate
Line 131: Janurary -- January
Line 144: heterogenities -- heterogeneities
Line 421: rapidely -- rapidly
Figure 8 caption: hincasts -- hindcasts
Figure 12 caption: intialized -- initialized
Most Figures’ labels and legends are much too small. Some require more than 200% magnification to read. Please increase the font sizes.
Figure A1, A2: axis lacks units.