
the Creative Commons Attribution 4.0 License.
the Creative Commons Attribution 4.0 License.
 | 18 Feb 2026
Fertilizer regimes reshape microbial interaction networks without altering sugarcane rhizosphere diversity
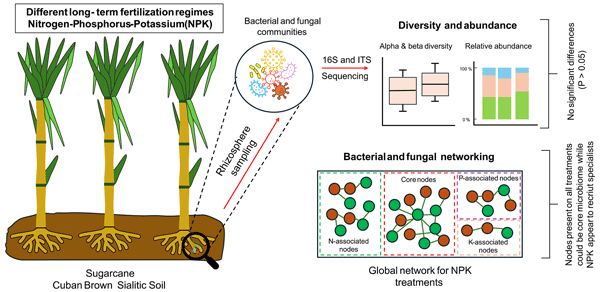
Abstract. Sugarcane (Saccharum spp.), an economically important crop in the food and bioenergy industries, has historically played a central role in the economy of Cuba, shaping its agricultural landscape and international relations. Although production has declined in recent decades, sugarcane remains a strategic crop, with its byproducts contributing to national energy and industrial outputs. However, the way in which long-term fertilization interacts with soil microbial communities under varying edaphoclimatic conditions remains largely unknown. Here, we investigated a traditional sugarcane plantation to evaluate how distinct fertilizer formulations varying in nitrogen, phosphorus, and potassium affect the soil and rhizosphere microbiota. Using high-throughput sequencing of 16S rRNA (bacterial) and internal transcribed spacer (fungal) genes, we identified 421 bacterial and 471 fungal genera from 5,741 amplicon sequence variants across different fertilization regimes. While microbial composition and diversity did not differ significantly between treatments, co-occurrence network analysis showed clear nutrient-specific patterns. This indicated that each fertilizer regime shaped distinct interaction networks among microbial taxa. These shifts suggest modifications in soil and rhizosphere functioning linked to nutrient availability rather than to taxonomic turnover alone. The findings provide a detailed characterization of the rhizosphere microbiome of Saccharum spp. in brown sialitic soils (inceptisol), offering ecological insights into its bacterial–fungal associations. This highlights the importance of understanding how long-term fertilization regimes influence rhizosphere microbial dynamics, which is key to designing more sustainable soil management and fertilization practices in sugarcane production systems.
-
Notice on discussion status
The requested preprint has a corresponding peer-reviewed final revised paper. You are encouraged to refer to the final revised version.
-
Preprint
(3265 KB)
-
Supplement
(1928 KB)
-
The requested preprint has a corresponding peer-reviewed final revised paper. You are encouraged to refer to the final revised version.
- Preprint
(3265 KB) - Metadata XML
-
Supplement
(1928 KB) - BibTeX
- EndNote
- Final revised paper


Journal article(s) based on this preprint
Interactive discussion
Status: closed
-
RC1: 'Comment on egusphere-2026-629', Anonymous Referee #1, 01 Apr 2026
-
AC1: 'Reply on RC1', Manuel Paneque, 22 May 2026
- AC3: 'Reply on AC1', Manuel Paneque, 20 Jul 2026
-
AC1: 'Reply on RC1', Manuel Paneque, 22 May 2026
-
RC2: 'Comment on egusphere-2026-629', Anonymous Referee #2, 06 Apr 2026
The manuscript “Fertilizer regimes reshape microbial interaction networks without altering sugarcane rhizosphere diversity” by Zamora-Leiva et al. addresses an interesting and relevant question of how long-term NPK fertilization affects the microbial community in sugarcane rhizosphere soils. The core question is interesting and the data from a long-term study site in tropical agroecosystems is valuable. The writing is generally clear. However, the manuscript has substantial methodological concerns that need to be addressed before it is suitable for publication. The per-treatment network analysis which represents the central claim of the paper, is unclear and statistically weak with n=3 samples. Key methodological details (like replication plots, samples, stats) need clarification.
Section-by-Section Comments:
- Introduction
Ln 79-81: Sentence is not clear. Please rephrase.
- Materials and methods
Section 2.1.1:
- The paper states the trial was established in 1998 but planting in the current study cycle was in spring 2020 with sampling in March 2022. Was there a gap in management between 1998 and 2020? How many cycles have occurred and what was the fertilization history in prior cycles? Please include this information; important for interpreting "legacy effects."
Section 2.1.2:
- N5 treatment labels do not match in text and Table 1. Please check this throughout the manuscript.
- Table 1 and 2 : Include the unit kg/ha in the table headers.
- Ln 142: Instead of “control 1” and “control 2”, suggest mentioning “control” and “blank” here in brackets as those are the terms used in figures and tables.
- For "Blank" (rhizosphere without fertilization): Was this plot never fertilized since 1998? Or not fertilized during the three fertilizer applications for other plots? Was it part of the same experimental block? This control is important but underspecified.
- Ln 143: Are the three replicates per treatment true biological replicates (independent plots) or subsamples from the same plot?
Section 2.1.3:
- This section begins mid-sentence ("These were shaken to remove excess soil..."). This needs to be corrected.
- Not clear at all how the rhizosphere was collected. Please include details on how the rhizosphere was operationally defined for sampling and how it was collected. It’s not clear if only the rhizosphere is being compared for fertilization treatments.
- How many root systems were pooled per replicate?
- What was the sampling depth?
- Ln 152: What do the authors mean by “enriched soil samples”?
Section 2.1.4:
- Ln, 163: Was DNA extracted from the rhizosphere or bulk soil?
- How many replicates per treatment?
Section 2.1.5:
- Ln 184: How many samples with <1,000 reads were excluded? This is critical as there appears to be only 3 reps per treatment.
- Ln 185: “Samples were analyzed with both unassigned ASVs removed and retained" — Which version is reported in the results? Removing unclassified ASVs before alpha and beta diversity calculations would bias the results. Please clarify which analyses were conducted with “unassigned ASVs removed” and how that will affect the conclusions.
- Ln 192: Suggest replacing “prokaryotic” with “microbial” for avoiding confusion and staying consistent.
- Ln 194-196: These analyses are mentioned in the methods but completely absent from the results. If differential abundance analyses were performed, the results must be reported. If they yielded no significant results, that itself is a result worth reporting. This needs to be addressed.
- Ln 197: Were the fungal and bacterial datasets merged at the ASV level? Please specify.
- Does the combined network include control samples?
- Ln 205-207: “between taxa”. Clarify that the taxa here represent ASVs.
- Ln 205-207: Please justify why only positive correlations were retained.
- Ln 207-209: The construction of per-treatment network is not clear. Please clarify how and why the same rarefaction, correlation, and filtering criteria were applied as the combined network. For each treatment, there are only 3 samples. But the combined network has 33 (?). Was the same significance filtering applied here for rho > 0.6? Were each treatment's 3 samples rarefied to 11,248 reads (same depth, different subset of samples)? Or the full rarefied table is subset to only the 3 samples of that treatment after rarefaction? Were only positive correlations retained here as well? It’s not clear to me why they were constructed the same way as the combined network if the comparisons are only based on treatments.
- Results
Section 3.1
- Table 3 : Include units of measurement for all variables; missing for Ca and Mg
- Ln 232: Suggest using one term: “soil respiration” or “microbial respiration” in text and Table 3.
- "No significant differences among treatments": Which statistical tests were applied to the physicochemical data? What were the p-values? Please include the test and p-values.
- The stats used for both soil properties and microbiome analyses should be mentioned in the methods.
Section 3.2
- Ln 240: This information should go under methods. Clearly specify reps per treatment.
Section 3.5
- Fig 5: The methods say only positive correlations were retained, but the results and figure explicitly describe and display five negative correlations as red edges. Please explain this contradiction.
- Ln 335 - 339: If negative correlations were filtered out by design, how are the authors interpreting this?
- Ln 355-360: “2,116 to 1,450 nodes”. Please check the language. The number of edges is being discussed as nodes.
- Figure 6: Why are the edges so high for the per-treatment networks? It looks like a subset of samples (n=3 for any single treatment) produces a network with similar or greater node counts but dramatically more edges than the full combined network. Was the significance filter not applied to per-treatment networks? If so, this would contradict the methods and needs to be clarified. If the networks are built without significance filtering, how are they comparable across treatments?
- Discussion
Section 4.2
- Ln 437- 439: The unclassified taxa discussion is very interesting. Considering that the percentage is so high for bacteria, how do these findings affect the conclusions about community stability? Does the proportion of unclassified ASVs differ across treatments? It’s not clear to me if these taxa were not included in diversity analyses. If not, this would be problematic and bias the results.
Section 4.3
- Ln 462-467: The methods need clarity on how the per-treatment networks are being compared. Also considering that there are only 3 reps per treatment, the interpretation needs to be substantially softened for this section as well as the community composition statements.
- Ln 466: The comparisons of these network properties are not present. Suggest including a table with these measurements.
- Conclusions
Recommend moderating the language. "long-term fertilization in brown sialitic soils can profoundly influence the organization of rhizosphere microbial communities" is overstated given the methodological caveats, particularly the n=3 per treatment network analysis.
-
AC2: 'Reply on RC2', Manuel Paneque, 22 May 2026
- AC4: 'Reply on AC2', Manuel Paneque, 20 Jul 2026
Peer review completion


Interactive discussion
Status: closed
-
RC1: 'Comment on egusphere-2026-629', Anonymous Referee #1, 01 Apr 2026
Fertilizer regimes reshape microbial interaction networks without
altering sugarcane rhizosphere diversity
Overview:
In this effort, the authors work to address an important gap in current knowledge about microbial structure in sialitic soils and how monoculture practices with sugarcane in the Caribbean can influence the reactivity of soil microbial structure to varying fertilizer strategies. The team highlights how the longstanding agriculture practices have potentially stabilized the microbial community structure in a way where there are minimal shifts in microbial community members and their abundance in response to fertilizer but rather the interactions restructure based on what nutrient is abundantly applied. The work highlights the need for improved profiling of these soils which could act as a new source of microbial isolates for Ag biotechnology and serve to inform current and future Ag management.
Comments:
Major:
- This is not a concern but more of an intrigue. The rigor of this experimental design is substantial, but I am curious if there is any temporal data that is available. Sampling in the third cycle can certainly highlight what interactions or microbial structures have stably shifted compared to control plots, but I am curious how things changed over time. I would say more data is not necessary, but I am curious about the author’s comments.
- Figure 6 and Supplemental 8S show some important data and I am curious what a breakdown would look like for those ASVs from the Venn diagrams. What are the classifications of the ASVs that overlap across the different fertilizer strategies? Are some consistently overlapping across all the fertilizer strategies? I think zooming in on this analysis more could provide more interesting results to strengthen the paper further similarly to how the network analysis data (Figure 5 and corresponding supplemental) was dissected. Also, the descriptions in the results and discussion around the Venn diagram data are inconsistent at times. In lines 345-350, the comparison of basal (N1—which is not labeled correctly in figure 6?) to nitrogen only (N0) seems inaccurate unless compartments are referring to the edges but there seems to be less overlap between the two controls and the treatment. Additionally, in the discussion in lines 500-505, it seems like the data suggests that at least phosphorus is another major driver besides just nitrogen?
- Given the manuscript relies heavily on the network analysis, were other calculation approaches considered (e.g., SparCC/SPIEC-EASI)? These approaches are robust with microbiome data and can help reduce false positives and more acutely pull out interactions. No method is perfect but these might be superior over standard Spearman—curious on authors thoughts here.
Minor:
- Line 149 could use some clarifying. These samples were collected after shaking the roots to remove excess soil?
- Looks like a typo regarding Walkley-Black in line 155
- I would suggest moving the supplemental table (regarding yields) up to top of supplemental file to follow the chronological order of results—additionally believe this table is not referenced in the text especially in lines 235-239
- I would say Line 240 needs clarity of breakdown of samples which could be added to methods. Based on beta diversity, it seems like all conditions including controls included three biological replicates so the total would be 39 when factoring in controls?
- Chao1 richness is not readily compatible with ASVs generated from DADA2—would consider removing completely and just using observed richness as that is sufficient
- I am assuming weighted unifrac or other beta diversity calculations did not show anything interesting? These were mentioned in the methods but only Bray-Curtis shown. I would suspect the results to follow Bray-Curtis given the limited variance in the PCoA axes
- I might prefer swapping supplemental figure 7 with the primary network analysis figure as the supplemental is more informative to me.
- I would consider adding a section break at line 340 especially if the authors decide to do more analysis on figure 6
- General comment on discussion, I personally enjoy long discussions to really dive into the data. Yet, this discussion section is a bit lengthy with some repetition in spots (the first two sections build on each other but tend to repeat). It isn’t critical, but attempting to reduce length could help with ease of working through the discussion
Citation: https://doi.org/10.5194/egusphere-2026-629-RC1 -
AC1: 'Reply on RC1', Manuel Paneque, 22 May 2026
- AC3: 'Reply on AC1', Manuel Paneque, 20 Jul 2026
-
RC2: 'Comment on egusphere-2026-629', Anonymous Referee #2, 06 Apr 2026
The manuscript “Fertilizer regimes reshape microbial interaction networks without altering sugarcane rhizosphere diversity” by Zamora-Leiva et al. addresses an interesting and relevant question of how long-term NPK fertilization affects the microbial community in sugarcane rhizosphere soils. The core question is interesting and the data from a long-term study site in tropical agroecosystems is valuable. The writing is generally clear. However, the manuscript has substantial methodological concerns that need to be addressed before it is suitable for publication. The per-treatment network analysis which represents the central claim of the paper, is unclear and statistically weak with n=3 samples. Key methodological details (like replication plots, samples, stats) need clarification.
Section-by-Section Comments:
- Introduction
Ln 79-81: Sentence is not clear. Please rephrase.
- Materials and methods
Section 2.1.1:
- The paper states the trial was established in 1998 but planting in the current study cycle was in spring 2020 with sampling in March 2022. Was there a gap in management between 1998 and 2020? How many cycles have occurred and what was the fertilization history in prior cycles? Please include this information; important for interpreting "legacy effects."
Section 2.1.2:
- N5 treatment labels do not match in text and Table 1. Please check this throughout the manuscript.
- Table 1 and 2 : Include the unit kg/ha in the table headers.
- Ln 142: Instead of “control 1” and “control 2”, suggest mentioning “control” and “blank” here in brackets as those are the terms used in figures and tables.
- For "Blank" (rhizosphere without fertilization): Was this plot never fertilized since 1998? Or not fertilized during the three fertilizer applications for other plots? Was it part of the same experimental block? This control is important but underspecified.
- Ln 143: Are the three replicates per treatment true biological replicates (independent plots) or subsamples from the same plot?
Section 2.1.3:
- This section begins mid-sentence ("These were shaken to remove excess soil..."). This needs to be corrected.
- Not clear at all how the rhizosphere was collected. Please include details on how the rhizosphere was operationally defined for sampling and how it was collected. It’s not clear if only the rhizosphere is being compared for fertilization treatments.
- How many root systems were pooled per replicate?
- What was the sampling depth?
- Ln 152: What do the authors mean by “enriched soil samples”?
Section 2.1.4:
- Ln, 163: Was DNA extracted from the rhizosphere or bulk soil?
- How many replicates per treatment?
Section 2.1.5:
- Ln 184: How many samples with <1,000 reads were excluded? This is critical as there appears to be only 3 reps per treatment.
- Ln 185: “Samples were analyzed with both unassigned ASVs removed and retained" — Which version is reported in the results? Removing unclassified ASVs before alpha and beta diversity calculations would bias the results. Please clarify which analyses were conducted with “unassigned ASVs removed” and how that will affect the conclusions.
- Ln 192: Suggest replacing “prokaryotic” with “microbial” for avoiding confusion and staying consistent.
- Ln 194-196: These analyses are mentioned in the methods but completely absent from the results. If differential abundance analyses were performed, the results must be reported. If they yielded no significant results, that itself is a result worth reporting. This needs to be addressed.
- Ln 197: Were the fungal and bacterial datasets merged at the ASV level? Please specify.
- Does the combined network include control samples?
- Ln 205-207: “between taxa”. Clarify that the taxa here represent ASVs.
- Ln 205-207: Please justify why only positive correlations were retained.
- Ln 207-209: The construction of per-treatment network is not clear. Please clarify how and why the same rarefaction, correlation, and filtering criteria were applied as the combined network. For each treatment, there are only 3 samples. But the combined network has 33 (?). Was the same significance filtering applied here for rho > 0.6? Were each treatment's 3 samples rarefied to 11,248 reads (same depth, different subset of samples)? Or the full rarefied table is subset to only the 3 samples of that treatment after rarefaction? Were only positive correlations retained here as well? It’s not clear to me why they were constructed the same way as the combined network if the comparisons are only based on treatments.
- Results
Section 3.1
- Table 3 : Include units of measurement for all variables; missing for Ca and Mg
- Ln 232: Suggest using one term: “soil respiration” or “microbial respiration” in text and Table 3.
- "No significant differences among treatments": Which statistical tests were applied to the physicochemical data? What were the p-values? Please include the test and p-values.
- The stats used for both soil properties and microbiome analyses should be mentioned in the methods.
Section 3.2
- Ln 240: This information should go under methods. Clearly specify reps per treatment.
Section 3.5
- Fig 5: The methods say only positive correlations were retained, but the results and figure explicitly describe and display five negative correlations as red edges. Please explain this contradiction.
- Ln 335 - 339: If negative correlations were filtered out by design, how are the authors interpreting this?
- Ln 355-360: “2,116 to 1,450 nodes”. Please check the language. The number of edges is being discussed as nodes.
- Figure 6: Why are the edges so high for the per-treatment networks? It looks like a subset of samples (n=3 for any single treatment) produces a network with similar or greater node counts but dramatically more edges than the full combined network. Was the significance filter not applied to per-treatment networks? If so, this would contradict the methods and needs to be clarified. If the networks are built without significance filtering, how are they comparable across treatments?
- Discussion
Section 4.2
- Ln 437- 439: The unclassified taxa discussion is very interesting. Considering that the percentage is so high for bacteria, how do these findings affect the conclusions about community stability? Does the proportion of unclassified ASVs differ across treatments? It’s not clear to me if these taxa were not included in diversity analyses. If not, this would be problematic and bias the results.
Section 4.3
- Ln 462-467: The methods need clarity on how the per-treatment networks are being compared. Also considering that there are only 3 reps per treatment, the interpretation needs to be substantially softened for this section as well as the community composition statements.
- Ln 466: The comparisons of these network properties are not present. Suggest including a table with these measurements.
- Conclusions
Recommend moderating the language. "long-term fertilization in brown sialitic soils can profoundly influence the organization of rhizosphere microbial communities" is overstated given the methodological caveats, particularly the n=3 per treatment network analysis.
-
AC2: 'Reply on RC2', Manuel Paneque, 22 May 2026
- AC4: 'Reply on AC2', Manuel Paneque, 20 Jul 2026
Peer review completion
Journal article(s) based on this preprint
Viewed
| HTML | XML | Total | Supplement | BibTeX | EndNote | |
|---|---|---|---|---|---|---|
| 779 | 484 | 120 | 1,383 | 159 | 86 | 102 |
- HTML: 779
- PDF: 484
- XML: 120
- Total: 1,383
- Supplement: 159
- BibTeX: 86
- EndNote: 102
Viewed (geographical distribution)
| Country | # | Views | % |
|---|
| Total: | 0 |
| HTML: | 0 |
| PDF: | 0 |
| XML: | 0 |
- 1
Leonardo Zamora-Leiva
Jorge Soto
Ignacio Ramos-Tapia

The requested preprint has a corresponding peer-reviewed final revised paper. You are encouraged to refer to the final revised version.
- Preprint
(3265 KB) - Metadata XML
-
Supplement
(1928 KB) - BibTeX
- EndNote
- Final revised paper
Fertilizer regimes reshape microbial interaction networks without
altering sugarcane rhizosphere diversity
Overview:
In this effort, the authors work to address an important gap in current knowledge about microbial structure in sialitic soils and how monoculture practices with sugarcane in the Caribbean can influence the reactivity of soil microbial structure to varying fertilizer strategies. The team highlights how the longstanding agriculture practices have potentially stabilized the microbial community structure in a way where there are minimal shifts in microbial community members and their abundance in response to fertilizer but rather the interactions restructure based on what nutrient is abundantly applied. The work highlights the need for improved profiling of these soils which could act as a new source of microbial isolates for Ag biotechnology and serve to inform current and future Ag management.
Comments:
Major:
Minor: