
the Creative Commons Attribution 4.0 License.
the Creative Commons Attribution 4.0 License.
 | 06 Jul 2026
Multiscalar and nonlinear controls of drought impacts in Spain revealed from media-reported data
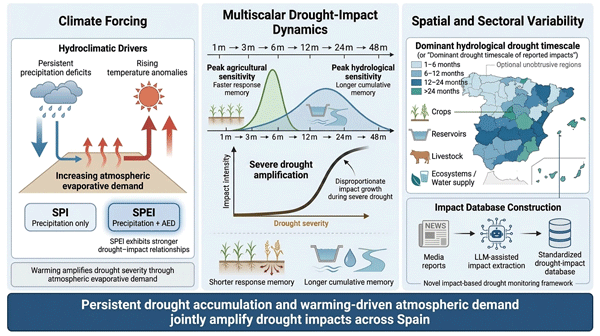
Abstract. This study assesses the multiscalar and nonlinear relationships between drought severity, characterized by the Standardized Precipitation Index (SPI) and the Standardized Precipitation Evapotranspiration Index (SPEI), and media-reported hydrological and agricultural impacts across Spain during 1976–2023. Drought indices were derived from a high-resolution gridded climate dataset (1.1 km), while impact data were obtained from standardized monthly frequencies of drought-related newspaper articles at the provincial scale. Results demonstrate robust temporal coherence between drought conditions and impacts, with major drought episodes associated with anomalies exceeding +1 to +2 standard deviations. Drought–impact relationships strengthen markedly with accumulation timescale, reaching maximum correlations at 12–24 months (|r| ≈ 0.6–0.8), while short timescales (1–3 months) show weak associations (|r| < 0.3). Hydrological impacts are primarily associated with accumulated medium- and long-term moisture deficits (12–48 months), whereas agricultural systems respond more rapidly to short- and intermediate-term drought conditions (3–12 months). However, both sectors shift to longer time scales as drought severity increases. Sensitivity analyses reveal pronounced nonlinear responses, with impacts increasing disproportionately during severe drought conditions with a peak at 12–36 months. The consistently stronger association of SPEI relative to SPI, especially in case of agricultural impacts, suggesting a dominant contribution of atmospheric evaporative demand. Our results indicate that drought impacts are governed by the accumulation and nonlinear propagation of moisture deficits modulated by temperature-dependent processes and provide a framework for improved impact-based drought monitoring in a warming climate.
-
Notice on discussion status
The requested preprint has a corresponding peer-reviewed final revised paper. You are encouraged to refer to the final revised version.
-
Preprint
(1642 KB)
-
The requested preprint has a corresponding peer-reviewed final revised paper. You are encouraged to refer to the final revised version.
- Preprint
(1642 KB) - Metadata XML
- BibTeX
- EndNote
- Final revised paper


Journal article(s) based on this preprint
Interactive discussion
Status: closed
-
RC1: 'Comment on egusphere-2026-3003', Anonymous Referee #1, 26 Jul 2026
-
AC1: 'Reply on RC1', Ahmed Kenawy, 04 Aug 2026
Response to Reviewer Comments
Dear editor,
We sincerely thank you and the reviewer for the careful, constructive, and highly valuable assessment of our manuscript. We greatly appreciate the time and effort devoted to evaluating the work and providing detailed comments. The reviewer’s observations were particularly helpful in improving the clarity, precision, and overall presentation of the manuscript.
We have considered all comments carefully and have revised the manuscript accordingly. In preparing the revised version, we aimed to address each point thoroughly. We believe that the manuscript has benefited substantially from this review process. Below, we provide a point-by-point response to the reviewer’s comments. For ease of assessment, each comment is reproduced, followed by our response. Where relevant, we also include the corresponding revised manuscript text in blue, together with line-number references to the clean revised manuscript, so that the changes can be located easily.
We are grateful for the opportunity to revise and resubmit our manuscript, and we hope that the revised version satisfactorily addresses the reviewer’s concerns.
Sincerely,
Ahmed Kenawy
On behalf of all coauthors
Point-by-point response
- This paper uses a dataset of news articles about drought to compare drought indicators with reported hydrologic and agricultural drought impacts. For impact data, the authors use standardized monthly frequencies of news articles, by province. For climate data, they use 48 different lengths (1–48 months) of Standardized Precipitation-Evapotranspiration Index and Standardized Precipitation Index. Comparing differences in the relationships between SPI and impacts and SPEI and impacts, they assess the contributions to impacts of temperature-driven processes vs. precipitation-driven processes. They find stronger relationships over longer time periods, 3–12 months for agricultural impacts and 12–48 months for hydrologic impacts. Their findings are consistent with what one would expect, but/and provide a novel way to quantify the effects of SPI and SPEI, including which timescales are most relevant. Using a dataset of media articles with counts standardized by month and location is a novel and substantial methodological contribution. The authors find extensive spatial heterogeneity between provinces in the relationships between drought indicators and drought impacts. I believe this study provides a robust methodological approach that could be used to begin exploring the contributions of different social and environmental variables to local resilience.
We thank the reviewer for this positive and constructive overall assessment. We appreciate the recognition of the methodological contribution of the media-derived drought-impact dataset and the multiscalar analysis linking SPI/SPEI to reported hydrological and agricultural impacts. In revising the manuscript, we retained the main analytical framework while clarifying the methodological and interpretive issues raised in the specific comments below. We also made the interpretation of spatial heterogeneity more cautious by clarifying that socioeconomic, management, irrigation, reservoir-operation, and vulnerability variables were not directly included in the PCA.
Lines 415–419: “Because socioeconomic, agricultural-management, irrigation, reservoir-operation, and vulnerability variables were not included directly in the PCA, the resulting spatial components should be interpreted as empirical modes of reported drought-impact variability rather than as direct explanations of the socioeconomic causes of impact heterogeneity.”
- On line 90 it says news articles published from May 1976 to December 2023 were analyzed. That would be 572 months. But line 144 refers to 576 months. Please reconcile the difference.
We agree with the reviewer. The period from May 1976 to December 2023 corresponds to 572 monthly observations, not 576.
Lines 87–91: “All articles published from its foundation on 11 May 1976 to 31 December 2023 were analysed. Articles were initially pre-filtered for drought relevance using a supervised classifier based on a fine-tuned Longformer model within the SeqIA framework (López Otal et al., 2025). This binary classifier identified 15,102 drought-relevant news articles over the study period. ... In each sector-specific analysis, the input matrix consisted of monthly observations from 1976–2023 as rows (n = 572) and Spanish provinces as columns (n = 48).”
- Starting on line 94, drought impact extraction – are the bins of agricultural or hydrologic impact articles mutually exclusive, or how much overlap is there? I ask because Fig 1c illustrates a fairly tight relationship between agricultural and hydrologic impacts, or, as described on line 211, “coherent cross-sector drought propagation.” It makes sense that they would be occurring at the same time, but differences would be masked if a substantial portion is being reported in the same articles. News framing could be “drought is causing problems such as [ag impact], [hydro impact].”
We thank the reviewer for this important clarification. We revised the Methods section to state explicitly that impact extraction was multi-label rather than mutually exclusive. Thus, an individual article could contribute to more than one sectoral series when it reported multiple drought consequences. We also revised the interpretation of Fig. 1c so that the strong agricultural–hydrological relationship is described as cross-sector drought reporting and impact co-occurrence, rather than fully independent evidence of causal propagation between sectors.
Lines 108–115: “Monthly impact frequencies were quantified as the number of drought-related articles published for each province and impact category. The extraction was multi-label rather than mutually exclusive. Therefore, a single article could contribute to more than one impact category when it reported multiple drought consequences, such as crop losses together with reservoir depletion or water-use restrictions. The agricultural and hydrological series should therefore be interpreted as sector-specific monthly reporting frequencies, not as disjoint sets of articles. To assess the possible influence of co-reporting, we quantified the article-level overlap between the two broad sectors and considered this overlap when interpreting the relationship between agricultural and hydrological impact series.”
Lines 209–215: “The strong relationship between agricultural and hydrological impacts (r = 0.89, Fig. 1c) should be interpreted with caution because the impact categories are not mutually exclusive at the article level. Some articles report multiple drought consequences simultaneously and therefore contribute to both sectoral series. Accordingly, Fig. 1c reflects both genuine temporal co-occurrence of sectoral impacts during major drought episodes and partial co-reporting within the same media articles. We therefore interpret this relationship as coherent cross-sector drought reporting and impact co-occurrence, rather than as fully independent evidence of causal propagation between sectors.”
- Line 148 refers to a covariance matrix, but I am not finding what variables are being analyzed. Please explicitly describe them. Is it the 48 timescales of SPI and SPEI, hydro vs ag, and province? I found myself looking for socio-economic variables, particularly in light of the references to non-linear responses and spatial heterogeneity.
We agree that the original wording was ambiguous. We revised Section 2.4 to specify that the covariance matrix was calculated from standardized monthly media-reported impact time series across provinces. PCA was performed separately for hydrological and agricultural impacts. Rows represent months and columns represent provinces. SPI/SPEI timescales, drought-index values, both impact sectors jointly, and socioeconomic variables were not included in the PCA. To avoid overinterpretation, we also added a Discussion statement clarifying that PCA components should be interpreted as empirical modes of reported impact variability, not as direct explanations of socioeconomic causes.
Lines 145–153: “To reduce dimensionality and identify dominant spatial-temporal patterns in drought-related impact reporting, we applied Principal Component Analysis (PCA) to the standardized monthly drought-impact time series. PCA was conducted separately for hydrological and agricultural impacts. In each sector-specific analysis, the input matrix consisted of monthly observations from 1976–2023 as rows (n = 572) and Spanish provinces as columns (n = 48). Therefore, the covariance matrix represented covariation among provincial impact-reporting time series within a given sector. SPI and SPEI were analysed subsequently in the drought–impact correlation and sensitivity analyses. The PCA was used only to identify the dominant spatial modes of reported impact variability and the provinces contributing most strongly to those modes.”
Lines 415–419: “Because socioeconomic, agricultural-management, irrigation, reservoir-operation, and vulnerability variables were not included directly in the PCA, the resulting spatial components should be interpreted as empirical modes of reported drought-impact variability rather than as direct explanations of the socioeconomic causes of impact heterogeneity.”
- 3: It would be helpful to have a little more contrast between the two colors.
We thank the reviewer for this helpful suggestion. We revised Fig. 3 by increasing the visual contrast between the sectoral series, using more distinguishable colors for hydrological and agricultural impacts while retaining line style differences to distinguish SPI and SPEI.
- Line 441: The discussion of using media coverage as data beginning on line 61 is good and nuanced. It stands in contrast with the sentence beginning on line 441.
We agree with the reviewer. We revised the Discussion to make it consistent with the nuanced framing of media coverage in the Introduction. The revised Discussion now describes media-reported data as complementary to climate-based drought indicators and clarifies that news articles provide a credible but not exhaustive record of drought effects at specific places and times. This avoids implying that media reports are superior to climate-based indicators and instead emphasizes their value as a best-available proxy for observed societal consequences.
Lines 60–68: “Media coverage plays an important role in shaping the societal interpretation of drought impacts. Newspaper articles provide information on the timing, location, and sectoral manifestation of drought impacts (Bachmair et al., 2016; Murphy et al., 2017; Wang et al., 2020; O’Connor et al., 2023; Jobbová et al., 2024), which allows us to understand physical conditions and social responses. They are often used for reconstruction of past droughts and interpretation of human behaviour in relation to climate change (Brazil et al., 2018; Nash et al., 2019).”
Lines 440–450: “Although news articles are written for purposes other than systematically documenting drought impacts, they provide a credible, though not exhaustive, record of drought’s effects at specific places and times (Dow, 2010). In contrast to SPI and SPEI, which quantify meteorological moisture deficits and atmospheric evaporative demand, media-reported impact data document how drought was observed, narrated, and experienced through effects on people, livelihoods, ecosystems, water resources, agriculture, and socio-economic systems. In this study, these records are therefore treated not as direct physical measurements of drought damage or as a comprehensive inventory of all impacts, but as a best-available proxy for the societal visibility, timing, location, and sectoral framing of drought events. Because news coverage is shaped by editorial priorities, institutional context, public attention, event novelty, perceived severity, and uneven spatial coverage, low reporting frequencies should not necessarily be interpreted as the absence of drought impacts. Rather, media-derived impact data identify when and where drought became socially salient, problematic, or publicly visible, making them useful for relating climate-based drought indicators to observed societal consequences.”
- Line 442: What does “also” refer to? If you are comparing drought impacts reported by media to drought impacts that are physical effects derived from climatological indicators, please define your terms in much greater detail. Same comment re/ “another” on line 443.
We removed the ambiguous comparison implied by “also” and “another” and replaced it with an explicit distinction between climate-based drought indicators and media-reported impact data. The revised text now defines SPI/SPEI as indicators of meteorological moisture deficits and atmospheric evaporative demand, while media-reported impact data are defined as records of how drought was observed, narrated, and experienced through societal and sectoral effects.
Lines 441–445: “In contrast to SPI and SPEI, which quantify meteorological moisture deficits and atmospheric evaporative demand, media-reported impact data document how drought was observed, narrated, and experienced through effects on people, livelihoods, ecosystems, water resources, agriculture, and socio-economic systems. In this study, these records are therefore treated not as direct physical measurements of drought damage or as a comprehensive inventory of all impacts, but as a best-available proxy for the societal visibility, timing, location, and sectoral framing of drought events.”
- Lines 443 & 446: You mention media bias without going into any depth about what you mean or what it may mean for your analysis. I urge researchers using news as data to avoid routinely mentioning bias without explaining what they are referring to. News media are indeed constrained and shaped by cultural and institutional norms and are sometimes designed to express explicit viewpoints. (Science is also constrained and shaped by cultural and institutional norms, including the methods, preferences and interests of various disciplines.) But more germane than “bias” is the reality that news is not intended to be a comprehensive record of drought impacts. It is broader-brush, focusing societal attention where it’s needed, on what’s novel or problematic, serving an issue-identification function (Dow 2007). Using news as drought impact data is valuable in that it helps us understand drought’s effects at specific places and times. But in calibrating drought indices, news-derived impacts can be thought of as “best-available” data or “reasonably proxy” data, rather than the data that would exist if researchers or policymakers had the resources to collect data that was tailored for purpose. To call that “bias” seems a bit off-point.
We thank the reviewer for this insightful comment. We revised the text to avoid using “bias” as a vague or routine qualifier. The revised version now explains the specific issue more clearly: news articles are not designed as a comprehensive drought-impact inventory, but they provide a credible, historically grounded, best-available proxy for when and where drought became visible, problematic, or socially salient. We also added Dow (2010) and specified the mechanisms shaping coverage, including editorial priorities, institutional context, public attention, novelty, perceived severity, and uneven spatial coverage. We therefore no longer present the limitation as generic “bias,” but as the non-comprehensive and socially mediated nature of news-derived impact records.
Lines 440–452: “Although news articles are written for purposes other than systematically documenting drought impacts, they provide a credible, though not exhaustive, record of drought’s effects at specific places and times (Dow, 2010). In contrast to SPI and SPEI, which quantify meteorological moisture deficits and atmospheric evaporative demand, media-reported impact data document how drought was observed, narrated, and experienced through effects on people, livelihoods, ecosystems, water resources, agriculture, and socio-economic systems. In this study, these records are therefore treated not as direct physical measurements of drought damage or as a comprehensive inventory of all impacts, but as a best-available proxy for the societal visibility, timing, location, and sectoral framing of drought events. Because news coverage is shaped by editorial priorities, institutional context, public attention, event novelty, perceived severity, and uneven spatial coverage, low reporting frequencies should not necessarily be interpreted as the absence of drought impacts. Rather, media-derived impact data identify when and where drought became socially salient, problematic, or publicly visible, making them useful for relating climate-based drought indicators to observed societal consequences. Recent research has demonstrated that media-based data sets can record drought effects at relatively high spatiotemporal resolution (Madruga de Brito et al., 2020; Wang et al., 2025), although they entail reporting biases and changes in media practices (Stahl et al., 2015; Serrano-Acebedo et al., 2026; Pita Costa et al., 2024).”
- Line 443: “… and subject to varied media coverage” … the sequence of clauses in this sentence leaves the object of this thought in question.
We revised the sentence to remove the unclear clause structure. The revised paragraph now explicitly states what is shaped by coverage processes and what this means analytically. Specifically, news coverage is identified as the object shaped by editorial priorities, institutional context, public attention, novelty, perceived severity, and uneven spatial coverage, and we clarify that low reporting frequency should not automatically be interpreted as absence of impacts.
Lines 445–449: “Because news coverage is shaped by editorial priorities, institutional context, public attention, event novelty, perceived severity, and uneven spatial coverage, low reporting frequencies should not necessarily be interpreted as the absence of drought impacts. Rather, media-derived impact data identify when and where drought became socially salient, problematic, or publicly visible, making them useful for relating climate-based drought indicators to observed societal consequences.”
- On line 444, instead of “consumed,” do you mean “experienced” or “framed” or “interpreted”? People are said to consume news but are not said to consume drought.
We agree with the reviewer. We removed the word “consumed” and replaced it with more precise wording. The revised text now states that media-reported data document how drought was “observed, narrated, and experienced,” which more accurately describes the role of news articles in recording societal and sectoral consequences of drought.
Lines 441–444: “In contrast to SPI and SPEI, which quantify meteorological moisture deficits and atmospheric evaporative demand, media-reported impact data document how drought was observed, narrated, and experienced through effects on people, livelihoods, ecosystems, water resources, agriculture, and socio-economic systems.”
- A possible rewrite of this important sentence: Although news articles are written for purposes other than systematically documenting drought impacts, they provide a credible representative record of drought’s effects at specific places and times. News articles go beyond the physical effects of drought, providing historic documentation of how drought affected people, livelihoods, ecosystems and socio-economic systems.
We thank the reviewer for the suggested wording. We incorporated the core idea into the Discussion while slightly modifying the phrasing to avoid overstating representativeness. Specifically, we used “credible, though not exhaustive, record” and added Dow (2010). We also retained the reviewer’s point that news articles go beyond physical drought indicators by documenting effects on people, livelihoods, ecosystems, water resources, agriculture, and socio-economic systems.
Lines 440–444: “Although news articles are written for purposes other than systematically documenting drought impacts, they provide a credible, though not exhaustive, record of drought’s effects at specific places and times (Dow, 2010). In contrast to SPI and SPEI, which quantify meteorological moisture deficits and atmospheric evaporative demand, media-reported impact data document how drought was observed, narrated, and experienced through effects on people, livelihoods, ecosystems, water resources, agriculture, and socio-economic systems.”
We again thank the editor and reviewer for their constructive comments, which substantially improved the clarity, precision, and interpretive balance of the manuscript.
- AC3: 'Reply on AC1', Ahmed Kenawy, 18 Sep 2026
- AC5: 'Reply on RC1', Ahmed Kenawy, 18 Sep 2026
-
AC1: 'Reply on RC1', Ahmed Kenawy, 04 Aug 2026
-
RC2: 'Comment on egusphere-2026-3003', Anonymous Referee #2, 16 Sep 2026
This study investigates the relationship between drought severity and reported agricultural and hydrological drought impacts in Spain using long-term dataset derived from corpus of El País covering the 1976 to 2023 period. LLM extracted data for impacts are consequently compared with SPI and SPEI at accumulation periods from 1 to 48 months and further investigation of drought impact sensitivity coefficient is handled using correlation and PCA analyses. Overall, I find the topic relevant for NHESS and the dataset potentially valuable. In particular, the long temporal coverage and the attempt to move beyond simple drought indicator–impact correlations towards analyzing changes in impact sensitivity across drought severity levels are interesting contributions. The manuscript also addresses an important challenge in drought research: connecting hydroclimatic hazard indicators with observed societal and sectoral impacts.
However, I found several methodological steps difficult to follow and reconstruct from the current description. My main concerns relate to 3 points, specifically i) the definition and temporal/spatial attribution of media-derived drought impacts, ii) the construction and interpretation of the drought-impact sensitivity coefficient, and iii) the distinction between drought accumulation timescale, temporal lag and impact response. I feel these clarifications are particularly important because the response variable represents media reporting of impacts rather than direct observations of physical impact magnitude. Some interpretations in the Results and Discussion sections appear stronger than what can currently be inferred from this data. I therefore recommend addition of further methodological clarifications and, where possible also sensitivity analysis, addressing and supporting the robustness of the main results.
Specific comments
- Temporal attribution of reported impacts
- I could not clearly determine how the timing of an impact was assigned. Section 2.1 indicates that monthly impact frequencies correspond to the number of relevant articles published each month. Does this mean that the publication date was used as the date of the reported impact, or was the temporal information extracted from the article text? Please clarify how impacts were temporally attributed and discuss the implications of possible delays between impact occurrence and media reporting. If temporal information was extracted from article content, more details on this procedure and its validation would be needed.
- Repeated reporting of ongoing impacts and independence of observations
- Related to the previous point, it is unclear how repeated descriptions of the same ongoing impacts were handled. A persistent impact such as low reservoir levels may be described in several articles across consecutive months. Were these cases treated as separate observations, or was any procedure used to identify duplicate or continuous impacts? From my understanding this could influence the further estimated drought-impact sensitivity coefficient, when long-lasting drought may remain “newsworthy” and therefore generate reporting of the same underlying impacts.
- Spatial attribution of impacts
- In a similar manner, I would also appreciate clarification of how individual impacts were linked to individual provinces. The manuscript states that province extraction was performed separately from impact extraction. How are impact type and location subsequently connected when an article contains several impacts and/or mentions several provinces? For example, if one article describes agricultural impacts in one province and hydrological impacts in another, does the extraction procedure retain the relationship between each impact and its corresponding location, or are all extracted impact categories assigned to all provinces mentioned in the article? (This could potentially introduce false province–impact combinations and is particularly relevant for the province-level analyses.)
- Definition and transformation of the impact variable used for the drought-impact sensitivity coefficient
- I found Sect. 2.5 particularly difficult to reproduce from the current description. Earlier in the Methods, monthly impact frequencies are transformed into standardized values with a mean of zero, meaning that negative impact anomalies are possible. Section 2.5 subsequently states that both drought magnitude and impact data were transformed using the natural logarithm and that observations with zero impact values were removed. It is therefore unclear to me which impact variable enters the equation. The natural logarithm cannot be applied directly to negative standardized values, and removing only zero observations would not resolve this problem. Please specify precisely whether the regression uses raw article counts, relative frequencies, standardized impact values, a shifted standardized variable, or another transformation. Any filtering or transformation applied before logarithmic transformation should be explicitly described. If observations with non-positive standardized impacts were excluded, this should also be stated and its potential influence on the estimated sensitivity coefficient discussed.
- Robustness and uncertainty of the drought-impact sensitivity coefficient
- The proposed sensitivity coefficient is an interesting part of the study, but I have concerns about estimating it independently within relatively narrow drought-severity classes. Within categories such as 1.28–1.65, the explanatory variable spans only a limited range, while severe and extreme drought observations are presumably relatively rare. This may result in unstable slope estimates, particularly when models are further separated by province, sector, drought indicator, and accumulation period. I suggest reporting the number of observations underlying these regressions and providing uncertainty estimates (e.g. confidence intervals) for the sensitivity coefficients. It would also be useful to demonstrate that the main patterns are not driven by a small number of observations in the severe and extreme classes.
- Temporal autocorrelation and statistical independence
- Both drought indices and impact-reporting time series are likely to exhibit substantial temporal autocorrelation. This is particularly important for SPI/SPEI calculated at long accumulation periods, since successive monthly values at, for example, 24- or 48-month accumulation periods contain strongly overlapping climatic information. It is unclear whether temporal autocorrelation was considered when evaluating correlation significance or uncertainty in the regression models. Please clarify whether this issue was accounted for, and additional consideration for statistical significance and uncertainty should be also discussed.
- Accumulation timescale versus lagged impact response
- The manuscript frequently discusses delayed responses, propagation, and the characteristic timescale of drought impacts. However, as I understand the methodology, impacts occurring in month t are compared with SPI/SPEI ending in the same month t at different accumulation periods (1–48 months). This identifies the climatic accumulation period most strongly associated with reported impacts, but it does not explicitly quantify the lag between drought conditions and subsequent impact occurrence/reporting. For example, an impact occurring several months after the maximum meteorological drought severity may correlate strongly with a long-accumulation SPEI even if the actual response involves a substantial temporal lag. Accumulation period, drought duration, and impact-response lag are therefore related but conceptually different quantities. This issue is additionally connected to Comment 1: if impact timing is based on article publication dates, the observed lag may combine both physical drought-impact propagation and delays in media reporting.
- Interpretation of media-derived impact frequency
- More generally, I think the manuscript should maintain a clearer distinction between reported impact frequency and physical impact magnitude. Article counts provide valuable information about the societal visibility, timing, and spatial distribution of drought impacts, but one article describing severe losses does not necessarily represent a smaller impact than several articles describing the same moderate impact. This distinction becomes particularly important when interpreting the sensitivity coefficient. Statements that impacts "increase disproportionately" with drought magnitude could be interpreted as referring to physical impact severity, whereas the analysis directly demonstrates a disproportionate increase in media-reported impact frequency. I recommend reviewing the terminology throughout the manuscript and ensuring that conclusions remain tied to what is directly represented by the response variable. This does not diminish the usefulness of the dataset, but it provides a more precise interpretation of the results.
Minor and technical comments
- Please check terminology related to “drought duration”, “accumulation period”, “response time”, and “lag”, as these currently appear to be used somewhat interchangeably in parts of the manuscript
- Please state clearly whether one article can contribute to both agricultural and hydrological categories
- The aggregation of crop and livestock impacts into “agricultural impacts” and water-resource and energy impacts into “hydrological impacts” should be further justified. These components may have substantially different response mechanisms and timescales
- Please clarify what is meant by "relative frequency" and whether impact counts were normalized by the overall number of articles published by El País within the corresponding period. (The study covers 1976–2023, during which the volume, format, and editorial practices of newspaper publishing have changed considerably, particularly with the transition towards digital publishing. I am not fully convinced that standardizing provincial impact-frequency distributions alone removes temporal changes in reporting intensity)
- The spatial heterogeneity shown in the results is interesting, but I think the Discussion could go further in considering why provinces differ in their drought-impact relationships.
Citation: https://doi.org/10.5194/egusphere-2026-3003-RC2 -
AC2: 'Reply on RC2', Ahmed Kenawy, 18 Sep 2026
The comment was uploaded in the form of a supplement: https://egusphere.copernicus.org/preprints/2026/egusphere-2026-3003/egusphere-2026-3003-AC2-supplement.pdf
- AC4: 'Reply on AC2', Ahmed Kenawy, 18 Sep 2026
- AC6: 'Please, find attached the tracked-changes version.', Ahmed Kenawy, 18 Sep 2026
Peer review completion


Interactive discussion
Status: closed
-
RC1: 'Comment on egusphere-2026-3003', Anonymous Referee #1, 26 Jul 2026
This paper uses a dataset of news articles about drought (Lopez-Otal 2025) to compare drought indicators with reported hydrologic and agricultural drought impacts. For impact data, the authors use standardized monthly frequencies of news articles, by province. For climate data, they use 48 different lengths (1-48 months) of Standardized Precipitation-Evapotranspiration Index and Standardized Precipitation Index. Comparing differences in the relationships between SPI and impacts and SPEI and impacts, they assess the contributions to impacts of temperature-driven processes vs. precipitation-driven processes. They find stronger relationships over longer time periods, 3-12 months for agricultural impacts and 12-48 months for hydrologic impacts.
Their findings are consistent with what one would expect, but/and provide a novel way to quantify the effects of SPI and SPEI, including which timescales are most relevant. Using a dataset of media articles with counts standardized by month and location is a novel and substantial methodological contribution.
The authors find extensive spatial heterogeneity between provinces in the relationships between drought indicators and drought impacts. I believe this study provides a robust methodological approach that could be used to begin exploring the contributions of different social and environmental variables to local resilience.
Specific items
On line 90 it says news articles published from May 1976 to December 2023 were analyzed. That would be 572 months. But line 144 refers to 576 months. Please reconcile the difference.
Starting on line 94, drought impact extraction – are the bins of agricultural or hydrologic impact articles mutually exclusive, or how much overlap is there? I ask because Fig 1c illustrates a fairly tight relationship between agricultural and hydrologic impacts, or, as described on line 211, “coherent cross-sector drought propagation.” It makes sense that they would be occurring at the same time, but differences would be masked if a substantial portion is being reported in the same articles. News framing could be “drought is causing problems such as [ag impact], [hydro impact].”
Line 148 refers to a covariance matrix, but I am not finding what variables are being analyzed. Please explicitly describe them. Is it the 48 timescales of SPI and SPEI, hydro vs ag, and province? I found myself looking for socio-economic variables, particularly in light of the references to non-linear responses and spatial heterogeneity.
Fig. 3: It would be helpful to have a little more contrast between the two colors.
Line 441: The discussion of using media coverage as data beginning on line 61 is good and nuanced. It stands in contrast with the sentence beginning on line 441.
Line 442: What does “also” refer to? If you are comparing drought impacts reported by media to drought impacts that are physical effects derived from climatological indicators, please define your terms in much greater detail. Same comment re/ “another” on line 443.
Lines 443 & 446: You mention media bias without going into any depth about what you mean or what it may mean for your analysis. I urge researchers using news as data to avoid routinely mentioning bias without explaining what they are referring to. News media are indeed constrained and shaped by cultural and institutional norms and are sometimes designed to express explicit viewpoints. (Science is also constrained and shaped by cultural and institutional norms, including the methods, preferences and interests of various disciplines.) But more germane than “bias” is the reality that news is not intended to be a comprehensive record of drought impacts. It is broader-brush, focusing societal attention where it’s needed, on what’s novel or problematic, serving an issue-identification function (Dow 2007). Using news as drought impact data is valuable in that it helps us understand drought’s effects at specific places and times. But in calibrating drought indices, news-derived impacts can be thought of as “best-available” data or “reasonably proxy” data, rather than the data that would exist if researchers or policymakers had the resources to collect data that was tailored for purpose. To call that “bias” seems a bit off-point.
Line 443: “… and subject to varied media coverage” … the sequence of clauses in this sentence leaves the object of this thought in question.
On line 444, instead of “consumed,” do you mean “experienced” or “framed” or “interpreted”? People are said to consume news but are not said to consume drought.
A possible rewrite of this important sentence:
Although news articles are written for purposes other than systematically documenting drought impacts, they provide a credible representative record of drought’s effects at specific places and times. News articles go beyond the physical effects of drought, providing historic documentation of how drought affected people, livelihoods, ecosystems and socio-economic systems.
References
Dow, K. (2010). News coverage of drought impacts and vulnerability in the US Carolinas, 1998–2007. Natural hazards, 54(2), 497-518.
Citation: https://doi.org/10.5194/egusphere-2026-3003-RC1 -
AC1: 'Reply on RC1', Ahmed Kenawy, 04 Aug 2026
Response to Reviewer Comments
Dear editor,
We sincerely thank you and the reviewer for the careful, constructive, and highly valuable assessment of our manuscript. We greatly appreciate the time and effort devoted to evaluating the work and providing detailed comments. The reviewer’s observations were particularly helpful in improving the clarity, precision, and overall presentation of the manuscript.
We have considered all comments carefully and have revised the manuscript accordingly. In preparing the revised version, we aimed to address each point thoroughly. We believe that the manuscript has benefited substantially from this review process. Below, we provide a point-by-point response to the reviewer’s comments. For ease of assessment, each comment is reproduced, followed by our response. Where relevant, we also include the corresponding revised manuscript text in blue, together with line-number references to the clean revised manuscript, so that the changes can be located easily.
We are grateful for the opportunity to revise and resubmit our manuscript, and we hope that the revised version satisfactorily addresses the reviewer’s concerns.
Sincerely,
Ahmed Kenawy
On behalf of all coauthors
Point-by-point response
- This paper uses a dataset of news articles about drought to compare drought indicators with reported hydrologic and agricultural drought impacts. For impact data, the authors use standardized monthly frequencies of news articles, by province. For climate data, they use 48 different lengths (1–48 months) of Standardized Precipitation-Evapotranspiration Index and Standardized Precipitation Index. Comparing differences in the relationships between SPI and impacts and SPEI and impacts, they assess the contributions to impacts of temperature-driven processes vs. precipitation-driven processes. They find stronger relationships over longer time periods, 3–12 months for agricultural impacts and 12–48 months for hydrologic impacts. Their findings are consistent with what one would expect, but/and provide a novel way to quantify the effects of SPI and SPEI, including which timescales are most relevant. Using a dataset of media articles with counts standardized by month and location is a novel and substantial methodological contribution. The authors find extensive spatial heterogeneity between provinces in the relationships between drought indicators and drought impacts. I believe this study provides a robust methodological approach that could be used to begin exploring the contributions of different social and environmental variables to local resilience.
We thank the reviewer for this positive and constructive overall assessment. We appreciate the recognition of the methodological contribution of the media-derived drought-impact dataset and the multiscalar analysis linking SPI/SPEI to reported hydrological and agricultural impacts. In revising the manuscript, we retained the main analytical framework while clarifying the methodological and interpretive issues raised in the specific comments below. We also made the interpretation of spatial heterogeneity more cautious by clarifying that socioeconomic, management, irrigation, reservoir-operation, and vulnerability variables were not directly included in the PCA.
Lines 415–419: “Because socioeconomic, agricultural-management, irrigation, reservoir-operation, and vulnerability variables were not included directly in the PCA, the resulting spatial components should be interpreted as empirical modes of reported drought-impact variability rather than as direct explanations of the socioeconomic causes of impact heterogeneity.”
- On line 90 it says news articles published from May 1976 to December 2023 were analyzed. That would be 572 months. But line 144 refers to 576 months. Please reconcile the difference.
We agree with the reviewer. The period from May 1976 to December 2023 corresponds to 572 monthly observations, not 576.
Lines 87–91: “All articles published from its foundation on 11 May 1976 to 31 December 2023 were analysed. Articles were initially pre-filtered for drought relevance using a supervised classifier based on a fine-tuned Longformer model within the SeqIA framework (López Otal et al., 2025). This binary classifier identified 15,102 drought-relevant news articles over the study period. ... In each sector-specific analysis, the input matrix consisted of monthly observations from 1976–2023 as rows (n = 572) and Spanish provinces as columns (n = 48).”
- Starting on line 94, drought impact extraction – are the bins of agricultural or hydrologic impact articles mutually exclusive, or how much overlap is there? I ask because Fig 1c illustrates a fairly tight relationship between agricultural and hydrologic impacts, or, as described on line 211, “coherent cross-sector drought propagation.” It makes sense that they would be occurring at the same time, but differences would be masked if a substantial portion is being reported in the same articles. News framing could be “drought is causing problems such as [ag impact], [hydro impact].”
We thank the reviewer for this important clarification. We revised the Methods section to state explicitly that impact extraction was multi-label rather than mutually exclusive. Thus, an individual article could contribute to more than one sectoral series when it reported multiple drought consequences. We also revised the interpretation of Fig. 1c so that the strong agricultural–hydrological relationship is described as cross-sector drought reporting and impact co-occurrence, rather than fully independent evidence of causal propagation between sectors.
Lines 108–115: “Monthly impact frequencies were quantified as the number of drought-related articles published for each province and impact category. The extraction was multi-label rather than mutually exclusive. Therefore, a single article could contribute to more than one impact category when it reported multiple drought consequences, such as crop losses together with reservoir depletion or water-use restrictions. The agricultural and hydrological series should therefore be interpreted as sector-specific monthly reporting frequencies, not as disjoint sets of articles. To assess the possible influence of co-reporting, we quantified the article-level overlap between the two broad sectors and considered this overlap when interpreting the relationship between agricultural and hydrological impact series.”
Lines 209–215: “The strong relationship between agricultural and hydrological impacts (r = 0.89, Fig. 1c) should be interpreted with caution because the impact categories are not mutually exclusive at the article level. Some articles report multiple drought consequences simultaneously and therefore contribute to both sectoral series. Accordingly, Fig. 1c reflects both genuine temporal co-occurrence of sectoral impacts during major drought episodes and partial co-reporting within the same media articles. We therefore interpret this relationship as coherent cross-sector drought reporting and impact co-occurrence, rather than as fully independent evidence of causal propagation between sectors.”
- Line 148 refers to a covariance matrix, but I am not finding what variables are being analyzed. Please explicitly describe them. Is it the 48 timescales of SPI and SPEI, hydro vs ag, and province? I found myself looking for socio-economic variables, particularly in light of the references to non-linear responses and spatial heterogeneity.
We agree that the original wording was ambiguous. We revised Section 2.4 to specify that the covariance matrix was calculated from standardized monthly media-reported impact time series across provinces. PCA was performed separately for hydrological and agricultural impacts. Rows represent months and columns represent provinces. SPI/SPEI timescales, drought-index values, both impact sectors jointly, and socioeconomic variables were not included in the PCA. To avoid overinterpretation, we also added a Discussion statement clarifying that PCA components should be interpreted as empirical modes of reported impact variability, not as direct explanations of socioeconomic causes.
Lines 145–153: “To reduce dimensionality and identify dominant spatial-temporal patterns in drought-related impact reporting, we applied Principal Component Analysis (PCA) to the standardized monthly drought-impact time series. PCA was conducted separately for hydrological and agricultural impacts. In each sector-specific analysis, the input matrix consisted of monthly observations from 1976–2023 as rows (n = 572) and Spanish provinces as columns (n = 48). Therefore, the covariance matrix represented covariation among provincial impact-reporting time series within a given sector. SPI and SPEI were analysed subsequently in the drought–impact correlation and sensitivity analyses. The PCA was used only to identify the dominant spatial modes of reported impact variability and the provinces contributing most strongly to those modes.”
Lines 415–419: “Because socioeconomic, agricultural-management, irrigation, reservoir-operation, and vulnerability variables were not included directly in the PCA, the resulting spatial components should be interpreted as empirical modes of reported drought-impact variability rather than as direct explanations of the socioeconomic causes of impact heterogeneity.”
- 3: It would be helpful to have a little more contrast between the two colors.
We thank the reviewer for this helpful suggestion. We revised Fig. 3 by increasing the visual contrast between the sectoral series, using more distinguishable colors for hydrological and agricultural impacts while retaining line style differences to distinguish SPI and SPEI.
- Line 441: The discussion of using media coverage as data beginning on line 61 is good and nuanced. It stands in contrast with the sentence beginning on line 441.
We agree with the reviewer. We revised the Discussion to make it consistent with the nuanced framing of media coverage in the Introduction. The revised Discussion now describes media-reported data as complementary to climate-based drought indicators and clarifies that news articles provide a credible but not exhaustive record of drought effects at specific places and times. This avoids implying that media reports are superior to climate-based indicators and instead emphasizes their value as a best-available proxy for observed societal consequences.
Lines 60–68: “Media coverage plays an important role in shaping the societal interpretation of drought impacts. Newspaper articles provide information on the timing, location, and sectoral manifestation of drought impacts (Bachmair et al., 2016; Murphy et al., 2017; Wang et al., 2020; O’Connor et al., 2023; Jobbová et al., 2024), which allows us to understand physical conditions and social responses. They are often used for reconstruction of past droughts and interpretation of human behaviour in relation to climate change (Brazil et al., 2018; Nash et al., 2019).”
Lines 440–450: “Although news articles are written for purposes other than systematically documenting drought impacts, they provide a credible, though not exhaustive, record of drought’s effects at specific places and times (Dow, 2010). In contrast to SPI and SPEI, which quantify meteorological moisture deficits and atmospheric evaporative demand, media-reported impact data document how drought was observed, narrated, and experienced through effects on people, livelihoods, ecosystems, water resources, agriculture, and socio-economic systems. In this study, these records are therefore treated not as direct physical measurements of drought damage or as a comprehensive inventory of all impacts, but as a best-available proxy for the societal visibility, timing, location, and sectoral framing of drought events. Because news coverage is shaped by editorial priorities, institutional context, public attention, event novelty, perceived severity, and uneven spatial coverage, low reporting frequencies should not necessarily be interpreted as the absence of drought impacts. Rather, media-derived impact data identify when and where drought became socially salient, problematic, or publicly visible, making them useful for relating climate-based drought indicators to observed societal consequences.”
- Line 442: What does “also” refer to? If you are comparing drought impacts reported by media to drought impacts that are physical effects derived from climatological indicators, please define your terms in much greater detail. Same comment re/ “another” on line 443.
We removed the ambiguous comparison implied by “also” and “another” and replaced it with an explicit distinction between climate-based drought indicators and media-reported impact data. The revised text now defines SPI/SPEI as indicators of meteorological moisture deficits and atmospheric evaporative demand, while media-reported impact data are defined as records of how drought was observed, narrated, and experienced through societal and sectoral effects.
Lines 441–445: “In contrast to SPI and SPEI, which quantify meteorological moisture deficits and atmospheric evaporative demand, media-reported impact data document how drought was observed, narrated, and experienced through effects on people, livelihoods, ecosystems, water resources, agriculture, and socio-economic systems. In this study, these records are therefore treated not as direct physical measurements of drought damage or as a comprehensive inventory of all impacts, but as a best-available proxy for the societal visibility, timing, location, and sectoral framing of drought events.”
- Lines 443 & 446: You mention media bias without going into any depth about what you mean or what it may mean for your analysis. I urge researchers using news as data to avoid routinely mentioning bias without explaining what they are referring to. News media are indeed constrained and shaped by cultural and institutional norms and are sometimes designed to express explicit viewpoints. (Science is also constrained and shaped by cultural and institutional norms, including the methods, preferences and interests of various disciplines.) But more germane than “bias” is the reality that news is not intended to be a comprehensive record of drought impacts. It is broader-brush, focusing societal attention where it’s needed, on what’s novel or problematic, serving an issue-identification function (Dow 2007). Using news as drought impact data is valuable in that it helps us understand drought’s effects at specific places and times. But in calibrating drought indices, news-derived impacts can be thought of as “best-available” data or “reasonably proxy” data, rather than the data that would exist if researchers or policymakers had the resources to collect data that was tailored for purpose. To call that “bias” seems a bit off-point.
We thank the reviewer for this insightful comment. We revised the text to avoid using “bias” as a vague or routine qualifier. The revised version now explains the specific issue more clearly: news articles are not designed as a comprehensive drought-impact inventory, but they provide a credible, historically grounded, best-available proxy for when and where drought became visible, problematic, or socially salient. We also added Dow (2010) and specified the mechanisms shaping coverage, including editorial priorities, institutional context, public attention, novelty, perceived severity, and uneven spatial coverage. We therefore no longer present the limitation as generic “bias,” but as the non-comprehensive and socially mediated nature of news-derived impact records.
Lines 440–452: “Although news articles are written for purposes other than systematically documenting drought impacts, they provide a credible, though not exhaustive, record of drought’s effects at specific places and times (Dow, 2010). In contrast to SPI and SPEI, which quantify meteorological moisture deficits and atmospheric evaporative demand, media-reported impact data document how drought was observed, narrated, and experienced through effects on people, livelihoods, ecosystems, water resources, agriculture, and socio-economic systems. In this study, these records are therefore treated not as direct physical measurements of drought damage or as a comprehensive inventory of all impacts, but as a best-available proxy for the societal visibility, timing, location, and sectoral framing of drought events. Because news coverage is shaped by editorial priorities, institutional context, public attention, event novelty, perceived severity, and uneven spatial coverage, low reporting frequencies should not necessarily be interpreted as the absence of drought impacts. Rather, media-derived impact data identify when and where drought became socially salient, problematic, or publicly visible, making them useful for relating climate-based drought indicators to observed societal consequences. Recent research has demonstrated that media-based data sets can record drought effects at relatively high spatiotemporal resolution (Madruga de Brito et al., 2020; Wang et al., 2025), although they entail reporting biases and changes in media practices (Stahl et al., 2015; Serrano-Acebedo et al., 2026; Pita Costa et al., 2024).”
- Line 443: “… and subject to varied media coverage” … the sequence of clauses in this sentence leaves the object of this thought in question.
We revised the sentence to remove the unclear clause structure. The revised paragraph now explicitly states what is shaped by coverage processes and what this means analytically. Specifically, news coverage is identified as the object shaped by editorial priorities, institutional context, public attention, novelty, perceived severity, and uneven spatial coverage, and we clarify that low reporting frequency should not automatically be interpreted as absence of impacts.
Lines 445–449: “Because news coverage is shaped by editorial priorities, institutional context, public attention, event novelty, perceived severity, and uneven spatial coverage, low reporting frequencies should not necessarily be interpreted as the absence of drought impacts. Rather, media-derived impact data identify when and where drought became socially salient, problematic, or publicly visible, making them useful for relating climate-based drought indicators to observed societal consequences.”
- On line 444, instead of “consumed,” do you mean “experienced” or “framed” or “interpreted”? People are said to consume news but are not said to consume drought.
We agree with the reviewer. We removed the word “consumed” and replaced it with more precise wording. The revised text now states that media-reported data document how drought was “observed, narrated, and experienced,” which more accurately describes the role of news articles in recording societal and sectoral consequences of drought.
Lines 441–444: “In contrast to SPI and SPEI, which quantify meteorological moisture deficits and atmospheric evaporative demand, media-reported impact data document how drought was observed, narrated, and experienced through effects on people, livelihoods, ecosystems, water resources, agriculture, and socio-economic systems.”
- A possible rewrite of this important sentence: Although news articles are written for purposes other than systematically documenting drought impacts, they provide a credible representative record of drought’s effects at specific places and times. News articles go beyond the physical effects of drought, providing historic documentation of how drought affected people, livelihoods, ecosystems and socio-economic systems.
We thank the reviewer for the suggested wording. We incorporated the core idea into the Discussion while slightly modifying the phrasing to avoid overstating representativeness. Specifically, we used “credible, though not exhaustive, record” and added Dow (2010). We also retained the reviewer’s point that news articles go beyond physical drought indicators by documenting effects on people, livelihoods, ecosystems, water resources, agriculture, and socio-economic systems.
Lines 440–444: “Although news articles are written for purposes other than systematically documenting drought impacts, they provide a credible, though not exhaustive, record of drought’s effects at specific places and times (Dow, 2010). In contrast to SPI and SPEI, which quantify meteorological moisture deficits and atmospheric evaporative demand, media-reported impact data document how drought was observed, narrated, and experienced through effects on people, livelihoods, ecosystems, water resources, agriculture, and socio-economic systems.”
We again thank the editor and reviewer for their constructive comments, which substantially improved the clarity, precision, and interpretive balance of the manuscript.
- AC3: 'Reply on AC1', Ahmed Kenawy, 18 Sep 2026
- AC5: 'Reply on RC1', Ahmed Kenawy, 18 Sep 2026
-
AC1: 'Reply on RC1', Ahmed Kenawy, 04 Aug 2026
-
RC2: 'Comment on egusphere-2026-3003', Anonymous Referee #2, 16 Sep 2026
This study investigates the relationship between drought severity and reported agricultural and hydrological drought impacts in Spain using long-term dataset derived from corpus of El País covering the 1976 to 2023 period. LLM extracted data for impacts are consequently compared with SPI and SPEI at accumulation periods from 1 to 48 months and further investigation of drought impact sensitivity coefficient is handled using correlation and PCA analyses. Overall, I find the topic relevant for NHESS and the dataset potentially valuable. In particular, the long temporal coverage and the attempt to move beyond simple drought indicator–impact correlations towards analyzing changes in impact sensitivity across drought severity levels are interesting contributions. The manuscript also addresses an important challenge in drought research: connecting hydroclimatic hazard indicators with observed societal and sectoral impacts.
However, I found several methodological steps difficult to follow and reconstruct from the current description. My main concerns relate to 3 points, specifically i) the definition and temporal/spatial attribution of media-derived drought impacts, ii) the construction and interpretation of the drought-impact sensitivity coefficient, and iii) the distinction between drought accumulation timescale, temporal lag and impact response. I feel these clarifications are particularly important because the response variable represents media reporting of impacts rather than direct observations of physical impact magnitude. Some interpretations in the Results and Discussion sections appear stronger than what can currently be inferred from this data. I therefore recommend addition of further methodological clarifications and, where possible also sensitivity analysis, addressing and supporting the robustness of the main results.
Specific comments
- Temporal attribution of reported impacts
- I could not clearly determine how the timing of an impact was assigned. Section 2.1 indicates that monthly impact frequencies correspond to the number of relevant articles published each month. Does this mean that the publication date was used as the date of the reported impact, or was the temporal information extracted from the article text? Please clarify how impacts were temporally attributed and discuss the implications of possible delays between impact occurrence and media reporting. If temporal information was extracted from article content, more details on this procedure and its validation would be needed.
- Repeated reporting of ongoing impacts and independence of observations
- Related to the previous point, it is unclear how repeated descriptions of the same ongoing impacts were handled. A persistent impact such as low reservoir levels may be described in several articles across consecutive months. Were these cases treated as separate observations, or was any procedure used to identify duplicate or continuous impacts? From my understanding this could influence the further estimated drought-impact sensitivity coefficient, when long-lasting drought may remain “newsworthy” and therefore generate reporting of the same underlying impacts.
- Spatial attribution of impacts
- In a similar manner, I would also appreciate clarification of how individual impacts were linked to individual provinces. The manuscript states that province extraction was performed separately from impact extraction. How are impact type and location subsequently connected when an article contains several impacts and/or mentions several provinces? For example, if one article describes agricultural impacts in one province and hydrological impacts in another, does the extraction procedure retain the relationship between each impact and its corresponding location, or are all extracted impact categories assigned to all provinces mentioned in the article? (This could potentially introduce false province–impact combinations and is particularly relevant for the province-level analyses.)
- Definition and transformation of the impact variable used for the drought-impact sensitivity coefficient
- I found Sect. 2.5 particularly difficult to reproduce from the current description. Earlier in the Methods, monthly impact frequencies are transformed into standardized values with a mean of zero, meaning that negative impact anomalies are possible. Section 2.5 subsequently states that both drought magnitude and impact data were transformed using the natural logarithm and that observations with zero impact values were removed. It is therefore unclear to me which impact variable enters the equation. The natural logarithm cannot be applied directly to negative standardized values, and removing only zero observations would not resolve this problem. Please specify precisely whether the regression uses raw article counts, relative frequencies, standardized impact values, a shifted standardized variable, or another transformation. Any filtering or transformation applied before logarithmic transformation should be explicitly described. If observations with non-positive standardized impacts were excluded, this should also be stated and its potential influence on the estimated sensitivity coefficient discussed.
- Robustness and uncertainty of the drought-impact sensitivity coefficient
- The proposed sensitivity coefficient is an interesting part of the study, but I have concerns about estimating it independently within relatively narrow drought-severity classes. Within categories such as 1.28–1.65, the explanatory variable spans only a limited range, while severe and extreme drought observations are presumably relatively rare. This may result in unstable slope estimates, particularly when models are further separated by province, sector, drought indicator, and accumulation period. I suggest reporting the number of observations underlying these regressions and providing uncertainty estimates (e.g. confidence intervals) for the sensitivity coefficients. It would also be useful to demonstrate that the main patterns are not driven by a small number of observations in the severe and extreme classes.
- Temporal autocorrelation and statistical independence
- Both drought indices and impact-reporting time series are likely to exhibit substantial temporal autocorrelation. This is particularly important for SPI/SPEI calculated at long accumulation periods, since successive monthly values at, for example, 24- or 48-month accumulation periods contain strongly overlapping climatic information. It is unclear whether temporal autocorrelation was considered when evaluating correlation significance or uncertainty in the regression models. Please clarify whether this issue was accounted for, and additional consideration for statistical significance and uncertainty should be also discussed.
- Accumulation timescale versus lagged impact response
- The manuscript frequently discusses delayed responses, propagation, and the characteristic timescale of drought impacts. However, as I understand the methodology, impacts occurring in month t are compared with SPI/SPEI ending in the same month t at different accumulation periods (1–48 months). This identifies the climatic accumulation period most strongly associated with reported impacts, but it does not explicitly quantify the lag between drought conditions and subsequent impact occurrence/reporting. For example, an impact occurring several months after the maximum meteorological drought severity may correlate strongly with a long-accumulation SPEI even if the actual response involves a substantial temporal lag. Accumulation period, drought duration, and impact-response lag are therefore related but conceptually different quantities. This issue is additionally connected to Comment 1: if impact timing is based on article publication dates, the observed lag may combine both physical drought-impact propagation and delays in media reporting.
- Interpretation of media-derived impact frequency
- More generally, I think the manuscript should maintain a clearer distinction between reported impact frequency and physical impact magnitude. Article counts provide valuable information about the societal visibility, timing, and spatial distribution of drought impacts, but one article describing severe losses does not necessarily represent a smaller impact than several articles describing the same moderate impact. This distinction becomes particularly important when interpreting the sensitivity coefficient. Statements that impacts "increase disproportionately" with drought magnitude could be interpreted as referring to physical impact severity, whereas the analysis directly demonstrates a disproportionate increase in media-reported impact frequency. I recommend reviewing the terminology throughout the manuscript and ensuring that conclusions remain tied to what is directly represented by the response variable. This does not diminish the usefulness of the dataset, but it provides a more precise interpretation of the results.
Minor and technical comments
- Please check terminology related to “drought duration”, “accumulation period”, “response time”, and “lag”, as these currently appear to be used somewhat interchangeably in parts of the manuscript
- Please state clearly whether one article can contribute to both agricultural and hydrological categories
- The aggregation of crop and livestock impacts into “agricultural impacts” and water-resource and energy impacts into “hydrological impacts” should be further justified. These components may have substantially different response mechanisms and timescales
- Please clarify what is meant by "relative frequency" and whether impact counts were normalized by the overall number of articles published by El País within the corresponding period. (The study covers 1976–2023, during which the volume, format, and editorial practices of newspaper publishing have changed considerably, particularly with the transition towards digital publishing. I am not fully convinced that standardizing provincial impact-frequency distributions alone removes temporal changes in reporting intensity)
- The spatial heterogeneity shown in the results is interesting, but I think the Discussion could go further in considering why provinces differ in their drought-impact relationships.
Citation: https://doi.org/10.5194/egusphere-2026-3003-RC2 -
AC2: 'Reply on RC2', Ahmed Kenawy, 18 Sep 2026
The comment was uploaded in the form of a supplement: https://egusphere.copernicus.org/preprints/2026/egusphere-2026-3003/egusphere-2026-3003-AC2-supplement.pdf
- AC4: 'Reply on AC2', Ahmed Kenawy, 18 Sep 2026
- AC6: 'Please, find attached the tracked-changes version.', Ahmed Kenawy, 18 Sep 2026
Peer review completion
Journal article(s) based on this preprint
Viewed
| HTML | XML | Total | BibTeX | EndNote | |
|---|---|---|---|---|---|
| 292 | 71 | 45 | 408 | 28 | 26 |
- HTML: 292
- PDF: 71
- XML: 45
- Total: 408
- BibTeX: 28
- EndNote: 26
Viewed (geographical distribution)
| Country | # | Views | % |
|---|
| Total: | 0 |
| HTML: | 0 |
| PDF: | 0 |
| XML: | 0 |
- 1

Fernando Domínguez-Castro
Santiago Beguería
Javier Vela-Tambo
Amar Halifa-Marín
Maria Adell-Michavila
Alex Crespillo
Borja Latorre
Magí Franquesa
Sergio M. Vicente-Serrano
The requested preprint has a corresponding peer-reviewed final revised paper. You are encouraged to refer to the final revised version.
- Preprint
(1642 KB) - Metadata XML
This paper uses a dataset of news articles about drought (Lopez-Otal 2025) to compare drought indicators with reported hydrologic and agricultural drought impacts. For impact data, the authors use standardized monthly frequencies of news articles, by province. For climate data, they use 48 different lengths (1-48 months) of Standardized Precipitation-Evapotranspiration Index and Standardized Precipitation Index. Comparing differences in the relationships between SPI and impacts and SPEI and impacts, they assess the contributions to impacts of temperature-driven processes vs. precipitation-driven processes. They find stronger relationships over longer time periods, 3-12 months for agricultural impacts and 12-48 months for hydrologic impacts.
Their findings are consistent with what one would expect, but/and provide a novel way to quantify the effects of SPI and SPEI, including which timescales are most relevant. Using a dataset of media articles with counts standardized by month and location is a novel and substantial methodological contribution.
The authors find extensive spatial heterogeneity between provinces in the relationships between drought indicators and drought impacts. I believe this study provides a robust methodological approach that could be used to begin exploring the contributions of different social and environmental variables to local resilience.
Specific items
On line 90 it says news articles published from May 1976 to December 2023 were analyzed. That would be 572 months. But line 144 refers to 576 months. Please reconcile the difference.
Starting on line 94, drought impact extraction – are the bins of agricultural or hydrologic impact articles mutually exclusive, or how much overlap is there? I ask because Fig 1c illustrates a fairly tight relationship between agricultural and hydrologic impacts, or, as described on line 211, “coherent cross-sector drought propagation.” It makes sense that they would be occurring at the same time, but differences would be masked if a substantial portion is being reported in the same articles. News framing could be “drought is causing problems such as [ag impact], [hydro impact].”
Line 148 refers to a covariance matrix, but I am not finding what variables are being analyzed. Please explicitly describe them. Is it the 48 timescales of SPI and SPEI, hydro vs ag, and province? I found myself looking for socio-economic variables, particularly in light of the references to non-linear responses and spatial heterogeneity.
Fig. 3: It would be helpful to have a little more contrast between the two colors.
Line 441: The discussion of using media coverage as data beginning on line 61 is good and nuanced. It stands in contrast with the sentence beginning on line 441.
Line 442: What does “also” refer to? If you are comparing drought impacts reported by media to drought impacts that are physical effects derived from climatological indicators, please define your terms in much greater detail. Same comment re/ “another” on line 443.
Lines 443 & 446: You mention media bias without going into any depth about what you mean or what it may mean for your analysis. I urge researchers using news as data to avoid routinely mentioning bias without explaining what they are referring to. News media are indeed constrained and shaped by cultural and institutional norms and are sometimes designed to express explicit viewpoints. (Science is also constrained and shaped by cultural and institutional norms, including the methods, preferences and interests of various disciplines.) But more germane than “bias” is the reality that news is not intended to be a comprehensive record of drought impacts. It is broader-brush, focusing societal attention where it’s needed, on what’s novel or problematic, serving an issue-identification function (Dow 2007). Using news as drought impact data is valuable in that it helps us understand drought’s effects at specific places and times. But in calibrating drought indices, news-derived impacts can be thought of as “best-available” data or “reasonably proxy” data, rather than the data that would exist if researchers or policymakers had the resources to collect data that was tailored for purpose. To call that “bias” seems a bit off-point.
Line 443: “… and subject to varied media coverage” … the sequence of clauses in this sentence leaves the object of this thought in question.
On line 444, instead of “consumed,” do you mean “experienced” or “framed” or “interpreted”? People are said to consume news but are not said to consume drought.
A possible rewrite of this important sentence:
Although news articles are written for purposes other than systematically documenting drought impacts, they provide a credible representative record of drought’s effects at specific places and times. News articles go beyond the physical effects of drought, providing historic documentation of how drought affected people, livelihoods, ecosystems and socio-economic systems.
References
Dow, K. (2010). News coverage of drought impacts and vulnerability in the US Carolinas, 1998–2007. Natural hazards, 54(2), 497-518.