
the Creative Commons Attribution 4.0 License.
the Creative Commons Attribution 4.0 License.
 | 01 Jun 2026
Toward shellfish aquaculture circularity: stimulating mussel shell dissolution in marine sediments
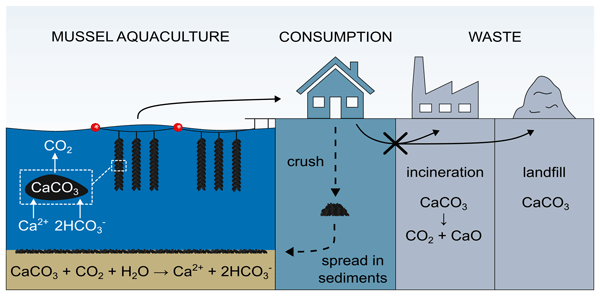
Abstract. Ocean alkalinity enhancement (OAE) is receiving considerable attention as a carbon dioxide (CO2) removal strategy, and novel approaches to increase the total alkalinity (AT) of the surface ocean are being explored. In bivalve aquaculture, calcification during shell growth consumes AT, thus leading to CO2 emissions. After consumption, shells are typically landfilled or incinerated, which can generate additional CO2 emissions. Here, we investigate whether bivalve shells could be a potential resource for mineral-based OAE. The idea is to grind the calcium carbonate (CaCO3) shells to increase the reactive surface area and distribute them into permeable, oxygen-rich sediments, where their dissolution produces AT that could then compensate the CO2 emitted during calcification. To evaluate this concept, we conducted microcosm incubations of sediments amended with crushed mussel shells (~8 wt%), and monitored the sediment geochemistry and sediment-water exchange over 24 weeks. Control sediments exhibited low and constant CaCO3 dissolution rates (Rdiss = 0.9 ± 0.5 mmol m-2 d-1) and AT fluxes (FAT = 3.2 ± 1.1 mmol m-2 d-1). In contrast, shell-amended sediments showed markedly higher Rdiss and FAT values, which exhibited a transient response modulated by oxygen and organic matter availability. Initially, shell dissolution was restricted by oxygen availability due to the intense mineralization of shell-associated organic matter. Subsequently, following gradual sediment reoxygenation, dissolution rates increased, reaching a maximum Rdiss of 22.7 ± 2.6 mmol m-2 d-1 after 9 weeks, corresponding to a measured FAT of 43.0 ± 6.0 mmol m-2 d-1. After that, CaCO3 dissolution rates declined as organic matter availability decreased, thus reducing dissolution toward a constant steady-state Rdiss of 2.2 ± 1.1 mmol m-2 d-1. After 6 months, ~6 % of the initial shell mass had dissolved, and extrapolation of the new quasi-steady-state dissolution rate at the end of the experiment suggests that complete dissolution would take ~38 years. Our results suggest that organic matter availability limits CaCO3 dissolution in the permeable sediment investigated. This constraint, however, can be alleviated by targeting environments with high organic matter deposition for in-situ applications, such as sediments beneath mussel farms, thereby promoting mussel aquaculture circularity.
Competing interests: At least one of the (co-)authors is a member of the editorial board of Biogeosciences. The peer-review process was guided by an independent editor, and the authors also have no other competing interests to declare.
Publisher's note: Copernicus Publications remains neutral with regard to jurisdictional claims made in the text, published maps, institutional affiliations, or any other geographical representation in this paper. While Copernicus Publications makes every effort to include appropriate place names, the final responsibility lies with the authors. Views expressed in the text are those of the authors and do not necessarily reflect the views of the publisher.-
Notice on discussion status
The requested preprint has a corresponding peer-reviewed final revised paper. You are encouraged to refer to the final revised version.
-
Preprint
(1528 KB)
-
Supplement
(1701 KB)
-
The requested preprint has a corresponding peer-reviewed final revised paper. You are encouraged to refer to the final revised version.
- Preprint
(1528 KB) - Metadata XML
-
Supplement
(1701 KB) - BibTeX
- EndNote
- Final revised paper


Journal article(s) based on this preprint
Interactive discussion
Status: closed
-
RC1: 'Comment on egusphere-2026-2930', Anonymous Referee #1, 22 Jun 2026
- AC1: 'Reply on RC1', Cedric Goossens, 23 Jul 2026
-
RC2: 'Comment on egusphere-2026-2930', Anonymous Referee #2, 25 Jun 2026
Review Goossens et al
Summary of the study:
The presented study investigates the potential use of mussel shells to offset the CO2 emissions associated with mussel farming. In a 24-week long sediment incubation crushed mussel shells were added to homogenised permeable sediment to investigate in what way the biomass still attached to the shells would enhance their dissolution. The calculated O2, DIC and At fluxes and the ∂C13-based dissolution rates suggest that during the early phase of the experiment, oxygen availability limited dissolution, while towards the end, Corg scarcity reduced the dissolution efficiency.
A back of the envelope calculation reveals that an application would lead to 6.1 % reduction of calcification-based emissions within 24 weeks.
General comments:
Overall, I want to express my respect for the huge amount of work that went into this study. Such experiments are very work-intense and the authors backed this up with thorough analytical efforts. Hence, I am convinced that the study and related data definitely should be published.
The result and methods section are in overall good shape and only need minor editing (see line-by-line comments).
The discussion is in principle ok, but needs some rephrasing in section 4.2
Section 4.3 is also ok, but lacks rigor. The authors start nicely in laying out the rates the calculated, how the fraction of compensated emissions can be estimated and where an application is possible. But then they don’t present an actual number. A quick statement about 6.1 % in 24 weeks, but no explanation as to what that implies. It would be very interesting to get a better idea over what time which amount of mussel shell could dissolve given typical residence times in the bioturbated mixed layer of sediments.
Likewise, I miss the comparison with other studies that investigated CaCO3 dissolution in sediments. Are the rates per surface comparable? Is the efficiency higher or lower? Also, a quick calculation of the emissions created by grinding the mussels would be helpful.
The speculations about possible application areas is comparably long and somewhat detached from the rest of the study as the implications for an application and the global potential are not really clarified.
Last, I miss a better estimate of the limitations of this study. What effect would resuspension have? How often would a sediment of this grainsize be resuspended in a natural environment? Were there any bioturbators in the incubated sediment?
Maybe this could be covered in a section together with the side-effects that are discussed in section 4.3. This would lead to a more comprehensive structure like: What have we found (also in comparison to previous findings), how do we have to interpret these new findings and what are the implications.
Again, I want to highlight the scientific quality of this study and encourage the authors to elevate the (already not bad at all) discussion to a level that this study deserves.
Line by line
Line 42: Add Fuhr et al. 2025.
Line 44: Here You should include all studies that have looked into olivine as a potential feed stock for OAE.
Line 55: Not sure, figure 1a is really needed. This correlation has been shown in many publications. I would rather try and improve Figure 1b in a way that it clearly encompasses the information contained in Fig. 1a.Line 74: The formula appears a bit lost here.
Line 75: The entire explanations around incineration are a bit difficult to follow. Why is this done anyways, and why is the resulting product buried?
Line 86: Here you should cite work from Aller et al. 1980 and 1981 where they investigated these processes at FOAM.
Line 94/95: This sentence is repeating what you stated in line 78.
Line 149/150: I like the detail with which the authors describe their experimental procedure. At the same time, I believe the SOP for calibrating an oxygen sensor should be clear.
Line 163: Was the removed volume replaced?
Lines 225 ff.: Please provide units for all parameters that are used in these equations. Is the final RDiss reported per m2 of surface area of added material or per m2 of sediment? If the latter please report the values also relative to the reactive surface of the added mineral for comparability.
Line 273: Figure 3e: Why this range on the y-axis? Please add information on which incubation session this is.
Lines 265 – 270: Here you only describe data that is all in the supplement. While I can understand that the amount of data is very large, it is not very convenient to switch to the supplementary information every other sentence. Is this amount of detail needed? If it is really necessary, find a way to present all relevant data in the main script, if it is not, concentrate on the relevant data in the main script.
Line 288: I would prefer to see the NH4+ fluxes in the main script as part of Fig. 3. And having seen Fig. 4 I would transfer Fig 3 and the section that describes it (lines 262 – 273) entirely to the supplement section. Eventually, the fluxes are the important bit. The concentrations in the single sessions are not necessary to understand the discussion.
Line 326: How exactly can pore-water analysis at the end confirm a development over time? Furthermore, this sentence and partly those before, have a quite discussing character. I suggest focusing on results here, and leaving discussions, explanations and interpretations for the discussion section.
Lines 337 ff. This is discussion of the data. Please move these ideas to a suitable section.
Line 399: This opening statement is not correct as it is: There are several studies that have shown undersaturation of pore waters in anoxic pore-waters with both either oxygenated or anoxic overlaying bottom waters. Please clarify under which conditions you believe this statement holds true and provide a suitable reference.
Lines 406 ff: This paragraph nicely describes findings from Dale et al. 2024.
Line 417: Why do you believe it was oxygen limitation in the first weeks? Is there any data supporting this (except from black colour and apparently lower dissolution rates)?
Lines 421-431: Nice explanation, but try to state things more carefully. As long as there is no measurable evidence of FeS formation, it is just a possible explanation. Likewise, it is possible, that the saturation state in pore waters has changed, but there is no evidence for this. Micro-profiling and subsequent calculation of integrated ΩCal values would have resolved this. The authors should consider this for their next experiments.
Line 433: Again, is there any evidence for more oxygenated porewaters? Not really. It is a plausible and likely explanation for the observed fluxes and colour of the sediments.
Line 443: A data point obtained after 24 weeks does not inform at which point in time the process responsible for this data point has taken place. It informs what has happened, not when it has happened. Please rephrase this in a factually correct way.
For entire section 4.2.2: I agree with the authors explanations as they appear most likely. Still, the way the authors state these explanations is too strong.
There is no evidence, of FeS formation, the abundance of labile or non-labile Corg. Please rephrase this section in a way that it becomes clear what is fact-based and what is the most likely explanation for the observations.Citation: https://doi.org/10.5194/egusphere-2026-2930-RC2 - AC2: 'Reply on RC2', Cedric Goossens, 23 Jul 2026
-
RC3: 'Comment on egusphere-2026-2930', Anonymous Referee #3, 06 Jul 2026
The study by Goossens et al. focuses on mineral-based ocean alkalinity enhancement, specifically on the reintroduction of ground bivalve shells to permeable sediments to enhance alkalinity fluxes and thus offset CO2 emissions associated with shell and aquaculture production. Using lab-based flux chamber incubations over a 24-week period, the authors show that shell-amended, permeable sediments exhibit significantly higher dissolution rates than unamended controls, partially driven by enhanced organic matter availability and degradation.
Overall, the manuscript is well written and clearly structured. The methodology is straightforward, appropriately explained, and well suited to address the key questions. I only have minor comments, mainly regarding the structure and clarity of the results and discussion sections.
Line-by-line comments:
Line 149: Please add some details on the specific optodes used here.
Lines 152-154: Can you give a range here for the duration of the ‘closed’ part (e.g., 1-3 days)?
Line 155: Please state somewhere the volume of seawater enclosed in the chambers and whether any correction for seawater dilution was done for the closed incubations.
Line 156: Can you be more specific here; e.g., sampled every time O2 dropped by 10 %?
Line 210: Move definition of ICP-OES to line 171 (first occurrence).
Line 263: I recommend changing to ‘in the closed (a, b) and open (c-e) incubations’…
Figure 3: I find the setup of Figure 3 slightly confusing (e.g., mix between open and closed incubations). Maybe move c) to middle panel and clearly state that upper panel shows closed incubations and middle panel open incubations. I would also recommend reducing the range for ammonium concentrations (y axis in e). Keeping it at the same level as nitrate is somewhat meaningless here. Also, why did you choose to only depict a representative incubation rather than showing the variability as well? Wouldn’t mean plus standard deviation be more meaningful here?
Figure 4: I find using positive fluxes to indicate both a flux into the overlying water (DIC, alkalinity) as well as a flux into the sediment (oxygen) confusing. Consider changing oxygen fluxes to negative values. Also, consider adding nutrient fluxes to the main figure here rather than the supplements.
Lines 372-373: This sentence feels out of place and raises more questions than it answers. Please provide a better transition to sections 4.2 and elaborate on these additional alkalinity sources and sinks here or elsewhere in the discussion.
Lines 406-407: Can you be more specific here, i.e., state specific reactions and/or metabolites.
Lines 422-424: Very fine shell material was likely also added to the sediment given that all ground shell material smaller than 0.25mm was retained for the experiment. Can you speculate on potential impacts of clogging of pore space on oxygen penetration and observed solute fluxes? Was the grain size distribution of the ground shell material measured?
Line 460: Is this a new steady-state? It seems that additional timepoints would be required to show whether this is a new steady-state or if it decreases further to meet control values.
Citation: https://doi.org/10.5194/egusphere-2026-2930-RC3 - AC3: 'Reply on RC3', Cedric Goossens, 23 Jul 2026
Peer review completion


Interactive discussion
Status: closed
-
RC1: 'Comment on egusphere-2026-2930', Anonymous Referee #1, 22 Jun 2026
This paper explores the addition of crushed mussel shells to carbonate-poor, irrigated, permeable sediment as a technique for mitigating CO2 production during bivalve aquaculture. Rather than disposing of the shells into landfills or via incineration, the authors suggest crushing and spreading them along coastal areas. There, dissolution produces alkalinity that can drive atmospheric CO2 uptake that would offset CO2 produced during calcification. The addition of shells to the surface 2 cm of sediments incubated in chambers outfitted with a rotating disk used to induce advection resulted in enhanced alkalinity production via metabolic CaCO3 dissolution. The results indicate CaCO3 dissolution is limited by competing oxygen and organic matter availability over the course of the experiment. Therefore, the authors suggest maximum alkalinity production efficiency would be achieved by adding crushed shells to well irrigated areas that receive high organic matter loading to maintain metabolic CO2 production via aerobic respiration.
General Comments:
This paper is both well-written and timely and warrants publication with some minor revisions. I think the paper could benefit from further exploration of the rate of exchange between the OLW and pore water in terms of driving dissolution and the resultant enhanced alkalinity fluxes in their incubations. The authors address the importance of exchange rate and pore water residence time, so it would be interesting to see an estimate of their exchange rate, how it relates to measured exchange rates along the continental shelf, and how pore water chemistry evolves with depth in the sediment according to pore water residence time.
Additionally, when discussing optimal locations for shell amendment, some discussion of natural sediment deposition and burial rate could be useful. When these shells are buried below the oxygenated zone, they could result in enhanced CaCO3 precipitation rather than dissolution. However, overall I think this is a very good and interesting paper. See some specific comments below.
Specific Comments:
L24: Looking at Figure 5b, is it correct to say there is a new steady-state dissolution rate in the treatments? Seems like it’s still decreasing.
L78- The placement of “(i.e. the reverse of Eq. 1)” is a little confusing here. Should be moved to the end of the sentence, otherwise it sounds like calcification is the reverse of Eq. 1.
L108-109: Was the sediment sieved to remove macrofauna?
L145-146: Were you able to determine an OLW-pore water exchange rate?
L165: How long were At samples stored unpoisoned before analysis?
L248: Should the MCDE be 100*2*fcarb? Looks like it is reported as % in results rather than a fraction.
Table 1- Why don’t you report isotopic values for the organic and inorganic carbon from the mussel shells? If not measured, can you calculate values based on the 8% amendment and how much the isotopic composition of the top 2cm changed following amendment? Also, why is there no error on the mussel shell solid analysis results?
Figure 3: Why are you only showing results from one set of control and treatment incubations rather than all three of each? Can you show a plot of how OLW Ω changed in the control and treatment incubations? Also, the starting δ13C of the OLW seems pretty light. Do you know why that is the case?
L325: Is there any correlation between the depth of the grey/black transition depth in the sediment and the CaCO3 dissolution rate/alkalinity flux?
L401-405: Was there any attempt to determine pore water residence time with depth in the sediment column? Especially over the oxygenated zone?
L410-411: Could be helpful to readers if you show the reaction stoichiometry.
L492-495: The deposition of fresh organic matter is clearly important, however some note about burial would be useful as natural sediment deposition will eventually bury the added shells below the oxygenated zone and where precipitation of CaCO3 would be more likely.
Technical:
L23- Try to consistently use weeks or months rather than switch between the two.
L71- Consistently use CaCO3 or calcium carbonate.
L204- Redundant to say flux calculations were performed using the software that allows for the calculation of sediment-water fluxes
L393- “as such” seems out of place
Figure 1- somewhat difficult to see the green arrows on the blue background.
Citation: https://doi.org/10.5194/egusphere-2026-2930-RC1 - AC1: 'Reply on RC1', Cedric Goossens, 23 Jul 2026
-
RC2: 'Comment on egusphere-2026-2930', Anonymous Referee #2, 25 Jun 2026
Review Goossens et al
Summary of the study:
The presented study investigates the potential use of mussel shells to offset the CO2 emissions associated with mussel farming. In a 24-week long sediment incubation crushed mussel shells were added to homogenised permeable sediment to investigate in what way the biomass still attached to the shells would enhance their dissolution. The calculated O2, DIC and At fluxes and the ∂C13-based dissolution rates suggest that during the early phase of the experiment, oxygen availability limited dissolution, while towards the end, Corg scarcity reduced the dissolution efficiency.
A back of the envelope calculation reveals that an application would lead to 6.1 % reduction of calcification-based emissions within 24 weeks.
General comments:
Overall, I want to express my respect for the huge amount of work that went into this study. Such experiments are very work-intense and the authors backed this up with thorough analytical efforts. Hence, I am convinced that the study and related data definitely should be published.
The result and methods section are in overall good shape and only need minor editing (see line-by-line comments).
The discussion is in principle ok, but needs some rephrasing in section 4.2
Section 4.3 is also ok, but lacks rigor. The authors start nicely in laying out the rates the calculated, how the fraction of compensated emissions can be estimated and where an application is possible. But then they don’t present an actual number. A quick statement about 6.1 % in 24 weeks, but no explanation as to what that implies. It would be very interesting to get a better idea over what time which amount of mussel shell could dissolve given typical residence times in the bioturbated mixed layer of sediments.
Likewise, I miss the comparison with other studies that investigated CaCO3 dissolution in sediments. Are the rates per surface comparable? Is the efficiency higher or lower? Also, a quick calculation of the emissions created by grinding the mussels would be helpful.
The speculations about possible application areas is comparably long and somewhat detached from the rest of the study as the implications for an application and the global potential are not really clarified.
Last, I miss a better estimate of the limitations of this study. What effect would resuspension have? How often would a sediment of this grainsize be resuspended in a natural environment? Were there any bioturbators in the incubated sediment?
Maybe this could be covered in a section together with the side-effects that are discussed in section 4.3. This would lead to a more comprehensive structure like: What have we found (also in comparison to previous findings), how do we have to interpret these new findings and what are the implications.
Again, I want to highlight the scientific quality of this study and encourage the authors to elevate the (already not bad at all) discussion to a level that this study deserves.
Line by line
Line 42: Add Fuhr et al. 2025.
Line 44: Here You should include all studies that have looked into olivine as a potential feed stock for OAE.
Line 55: Not sure, figure 1a is really needed. This correlation has been shown in many publications. I would rather try and improve Figure 1b in a way that it clearly encompasses the information contained in Fig. 1a.Line 74: The formula appears a bit lost here.
Line 75: The entire explanations around incineration are a bit difficult to follow. Why is this done anyways, and why is the resulting product buried?
Line 86: Here you should cite work from Aller et al. 1980 and 1981 where they investigated these processes at FOAM.
Line 94/95: This sentence is repeating what you stated in line 78.
Line 149/150: I like the detail with which the authors describe their experimental procedure. At the same time, I believe the SOP for calibrating an oxygen sensor should be clear.
Line 163: Was the removed volume replaced?
Lines 225 ff.: Please provide units for all parameters that are used in these equations. Is the final RDiss reported per m2 of surface area of added material or per m2 of sediment? If the latter please report the values also relative to the reactive surface of the added mineral for comparability.
Line 273: Figure 3e: Why this range on the y-axis? Please add information on which incubation session this is.
Lines 265 – 270: Here you only describe data that is all in the supplement. While I can understand that the amount of data is very large, it is not very convenient to switch to the supplementary information every other sentence. Is this amount of detail needed? If it is really necessary, find a way to present all relevant data in the main script, if it is not, concentrate on the relevant data in the main script.
Line 288: I would prefer to see the NH4+ fluxes in the main script as part of Fig. 3. And having seen Fig. 4 I would transfer Fig 3 and the section that describes it (lines 262 – 273) entirely to the supplement section. Eventually, the fluxes are the important bit. The concentrations in the single sessions are not necessary to understand the discussion.
Line 326: How exactly can pore-water analysis at the end confirm a development over time? Furthermore, this sentence and partly those before, have a quite discussing character. I suggest focusing on results here, and leaving discussions, explanations and interpretations for the discussion section.
Lines 337 ff. This is discussion of the data. Please move these ideas to a suitable section.
Line 399: This opening statement is not correct as it is: There are several studies that have shown undersaturation of pore waters in anoxic pore-waters with both either oxygenated or anoxic overlaying bottom waters. Please clarify under which conditions you believe this statement holds true and provide a suitable reference.
Lines 406 ff: This paragraph nicely describes findings from Dale et al. 2024.
Line 417: Why do you believe it was oxygen limitation in the first weeks? Is there any data supporting this (except from black colour and apparently lower dissolution rates)?
Lines 421-431: Nice explanation, but try to state things more carefully. As long as there is no measurable evidence of FeS formation, it is just a possible explanation. Likewise, it is possible, that the saturation state in pore waters has changed, but there is no evidence for this. Micro-profiling and subsequent calculation of integrated ΩCal values would have resolved this. The authors should consider this for their next experiments.
Line 433: Again, is there any evidence for more oxygenated porewaters? Not really. It is a plausible and likely explanation for the observed fluxes and colour of the sediments.
Line 443: A data point obtained after 24 weeks does not inform at which point in time the process responsible for this data point has taken place. It informs what has happened, not when it has happened. Please rephrase this in a factually correct way.
For entire section 4.2.2: I agree with the authors explanations as they appear most likely. Still, the way the authors state these explanations is too strong.
There is no evidence, of FeS formation, the abundance of labile or non-labile Corg. Please rephrase this section in a way that it becomes clear what is fact-based and what is the most likely explanation for the observations.Citation: https://doi.org/10.5194/egusphere-2026-2930-RC2 - AC2: 'Reply on RC2', Cedric Goossens, 23 Jul 2026
-
RC3: 'Comment on egusphere-2026-2930', Anonymous Referee #3, 06 Jul 2026
The study by Goossens et al. focuses on mineral-based ocean alkalinity enhancement, specifically on the reintroduction of ground bivalve shells to permeable sediments to enhance alkalinity fluxes and thus offset CO2 emissions associated with shell and aquaculture production. Using lab-based flux chamber incubations over a 24-week period, the authors show that shell-amended, permeable sediments exhibit significantly higher dissolution rates than unamended controls, partially driven by enhanced organic matter availability and degradation.
Overall, the manuscript is well written and clearly structured. The methodology is straightforward, appropriately explained, and well suited to address the key questions. I only have minor comments, mainly regarding the structure and clarity of the results and discussion sections.
Line-by-line comments:
Line 149: Please add some details on the specific optodes used here.
Lines 152-154: Can you give a range here for the duration of the ‘closed’ part (e.g., 1-3 days)?
Line 155: Please state somewhere the volume of seawater enclosed in the chambers and whether any correction for seawater dilution was done for the closed incubations.
Line 156: Can you be more specific here; e.g., sampled every time O2 dropped by 10 %?
Line 210: Move definition of ICP-OES to line 171 (first occurrence).
Line 263: I recommend changing to ‘in the closed (a, b) and open (c-e) incubations’…
Figure 3: I find the setup of Figure 3 slightly confusing (e.g., mix between open and closed incubations). Maybe move c) to middle panel and clearly state that upper panel shows closed incubations and middle panel open incubations. I would also recommend reducing the range for ammonium concentrations (y axis in e). Keeping it at the same level as nitrate is somewhat meaningless here. Also, why did you choose to only depict a representative incubation rather than showing the variability as well? Wouldn’t mean plus standard deviation be more meaningful here?
Figure 4: I find using positive fluxes to indicate both a flux into the overlying water (DIC, alkalinity) as well as a flux into the sediment (oxygen) confusing. Consider changing oxygen fluxes to negative values. Also, consider adding nutrient fluxes to the main figure here rather than the supplements.
Lines 372-373: This sentence feels out of place and raises more questions than it answers. Please provide a better transition to sections 4.2 and elaborate on these additional alkalinity sources and sinks here or elsewhere in the discussion.
Lines 406-407: Can you be more specific here, i.e., state specific reactions and/or metabolites.
Lines 422-424: Very fine shell material was likely also added to the sediment given that all ground shell material smaller than 0.25mm was retained for the experiment. Can you speculate on potential impacts of clogging of pore space on oxygen penetration and observed solute fluxes? Was the grain size distribution of the ground shell material measured?
Line 460: Is this a new steady-state? It seems that additional timepoints would be required to show whether this is a new steady-state or if it decreases further to meet control values.
Citation: https://doi.org/10.5194/egusphere-2026-2930-RC3 - AC3: 'Reply on RC3', Cedric Goossens, 23 Jul 2026
Peer review completion
Journal article(s) based on this preprint
Viewed
| HTML | XML | Total | Supplement | BibTeX | EndNote | |
|---|---|---|---|---|---|---|
| 273 | 105 | 39 | 417 | 49 | 26 | 32 |
- HTML: 273
- PDF: 105
- XML: 39
- Total: 417
- Supplement: 49
- BibTeX: 26
- EndNote: 32
Viewed (geographical distribution)
| Country | # | Views | % |
|---|
| Total: | 0 |
| HTML: | 0 |
| PDF: | 0 |
| XML: | 0 |
- 1
Cedric Goossens

Steven Bouillon
Filip J. R. Meysman
Sebastiaan J. van de Velde
The requested preprint has a corresponding peer-reviewed final revised paper. You are encouraged to refer to the final revised version.
- Preprint
(1528 KB) - Metadata XML
-
Supplement
(1701 KB) - BibTeX
- EndNote
- Final revised paper
This paper explores the addition of crushed mussel shells to carbonate-poor, irrigated, permeable sediment as a technique for mitigating CO2 production during bivalve aquaculture. Rather than disposing of the shells into landfills or via incineration, the authors suggest crushing and spreading them along coastal areas. There, dissolution produces alkalinity that can drive atmospheric CO2 uptake that would offset CO2 produced during calcification. The addition of shells to the surface 2 cm of sediments incubated in chambers outfitted with a rotating disk used to induce advection resulted in enhanced alkalinity production via metabolic CaCO3 dissolution. The results indicate CaCO3 dissolution is limited by competing oxygen and organic matter availability over the course of the experiment. Therefore, the authors suggest maximum alkalinity production efficiency would be achieved by adding crushed shells to well irrigated areas that receive high organic matter loading to maintain metabolic CO2 production via aerobic respiration.
General Comments:
This paper is both well-written and timely and warrants publication with some minor revisions. I think the paper could benefit from further exploration of the rate of exchange between the OLW and pore water in terms of driving dissolution and the resultant enhanced alkalinity fluxes in their incubations. The authors address the importance of exchange rate and pore water residence time, so it would be interesting to see an estimate of their exchange rate, how it relates to measured exchange rates along the continental shelf, and how pore water chemistry evolves with depth in the sediment according to pore water residence time.
Additionally, when discussing optimal locations for shell amendment, some discussion of natural sediment deposition and burial rate could be useful. When these shells are buried below the oxygenated zone, they could result in enhanced CaCO3 precipitation rather than dissolution. However, overall I think this is a very good and interesting paper. See some specific comments below.
Specific Comments:
L24: Looking at Figure 5b, is it correct to say there is a new steady-state dissolution rate in the treatments? Seems like it’s still decreasing.
L78- The placement of “(i.e. the reverse of Eq. 1)” is a little confusing here. Should be moved to the end of the sentence, otherwise it sounds like calcification is the reverse of Eq. 1.
L108-109: Was the sediment sieved to remove macrofauna?
L145-146: Were you able to determine an OLW-pore water exchange rate?
L165: How long were At samples stored unpoisoned before analysis?
L248: Should the MCDE be 100*2*fcarb? Looks like it is reported as % in results rather than a fraction.
Table 1- Why don’t you report isotopic values for the organic and inorganic carbon from the mussel shells? If not measured, can you calculate values based on the 8% amendment and how much the isotopic composition of the top 2cm changed following amendment? Also, why is there no error on the mussel shell solid analysis results?
Figure 3: Why are you only showing results from one set of control and treatment incubations rather than all three of each? Can you show a plot of how OLW Ω changed in the control and treatment incubations? Also, the starting δ13C of the OLW seems pretty light. Do you know why that is the case?
L325: Is there any correlation between the depth of the grey/black transition depth in the sediment and the CaCO3 dissolution rate/alkalinity flux?
L401-405: Was there any attempt to determine pore water residence time with depth in the sediment column? Especially over the oxygenated zone?
L410-411: Could be helpful to readers if you show the reaction stoichiometry.
L492-495: The deposition of fresh organic matter is clearly important, however some note about burial would be useful as natural sediment deposition will eventually bury the added shells below the oxygenated zone and where precipitation of CaCO3 would be more likely.
Technical:
L23- Try to consistently use weeks or months rather than switch between the two.
L71- Consistently use CaCO3 or calcium carbonate.
L204- Redundant to say flux calculations were performed using the software that allows for the calculation of sediment-water fluxes
L393- “as such” seems out of place
Figure 1- somewhat difficult to see the green arrows on the blue background.