
the Creative Commons Attribution 4.0 License.
the Creative Commons Attribution 4.0 License.
 | 04 May 2026
From Paper to Proof: Revealing Congo Basin Warming Through Rescued Climate Archives
Abstract. The Congo Basin in Central Africa remains one of the few regions globally where the Intergovernmental Panel on Climate Change has neither assessed changes in hot extremes and extreme precipitation since the 1950s nor attributed such changes to anthropogenic influences, primarily due to the sparsity of in situ observational data. Although extensive daily weather records exist, spanning from the 1900s to the early 2000s and covering numerous stations across the basin, the majority of these remain archived on paper, limiting their accessibility for climate analysis. Here we present and analyse over 1 million temperature and precipitation observations from 37 weather stations in the Democratic Republic of the Congo, which have until now been unavailable to the research community. To produce this dataset, we first digitized (imaged) 9,885 paper sheets stored in local archives during two dedicated field campaigns. We subsequently apply an improved version of the MeteoSaver software (version 1.1) to transcribe the imaged sheets, yielding daily time series of maximum, minimum, and average temperatures, precipitation, as well as dry bulb and wet bulb temperatures measured at three times per day (06:00, 15:00, and 18:00 local time). After quality control, analysis of multi-decadal temperature data across the basin reveals a consistent and accelerating warming signal since the 1960s, characterized by a warming shift in the distribution of daily maximum, minimum, and average temperatures with each successive decade. Median trends across 21 of the 37 stations with sufficient data availability are 0.22 °C, 0.10 °C, and 0.15 °C per decade for daily maximum, minimum, and average temperatures, respectively, corresponding to approximately 0.7 °C, 0.3 °C, and 0.5 °C of warming during the 1961–1990 period. We further find an increasing frequency of hot extremes and a decreasing frequency of cold extremes with each successive decade, with the most recent decade exhibiting nearly twice as many hot days per year and fewer cold days compared to the earliest decade. Analysis of precipitation at three stations with sufficient data indicates an increased frequency of heavy precipitation events at two stations and no substantial change at the third; however, limited spatial coverage due to data availability restricts broader conclusions for the DRC. Overall, this analysis of rescued weather data from Central Africa highlights the urgent need to close the knowledge gap on climate trends in the Congo Basin, one of the world’s most data-sparse yet climatically significant regions.
-
Notice on discussion status
The requested preprint has a corresponding peer-reviewed final revised paper. You are encouraged to refer to the final revised version.
-
Preprint
(15117 KB)
-
The requested preprint has a corresponding peer-reviewed final revised paper. You are encouraged to refer to the final revised version.
- Preprint
(15117 KB) - Metadata XML
- BibTeX
- EndNote
- Final revised paper


Journal article(s) based on this preprint
Interactive discussion
Status: closed
-
RC1: 'Comment on egusphere-2026-2107', Anonymous Referee #1, 31 May 2026
-
AC1: 'Reply on RC1', Derrick Muheki, 03 Aug 2026
We thank the reviewer for their time and valuable suggestions to improve the manuscript. We agree that the manuscript would benefit from a discussion of possible reasons for differences in trend magnitude and sign among stations. In the revised manuscript, we will expand the Discussion to mention possible contributors to station-level differences, including large-scale climate variability, local environmental conditions, local and remote land-use or land-cover change, and station-specific non-climatic effects (noting that while we performed quality control, we did not undertake a formal homogenization exercise). We will also clarify that this study does not perform a formal attribution analysis, and therefore we cannot quantify the relative contributions of these possible drivers to the observed trends. In the attached document, we propose updated text in the Discussion Section 4.2.
-
AC1: 'Reply on RC1', Derrick Muheki, 03 Aug 2026
-
RC2: 'Comment on egusphere-2026-2107', Anonymous Referee #2, 06 Jul 2026
The article documents, recovers and analyses historical weather records of Congo basin in present-day DRC. The weather records considered in this analysis are primarily from 1960s to 1990s, some records extending into early 2000s. The study undertakes digitalisation (imaging) of 9,885 sheets of paper from 37 weather stations in DRC. Using previously developed ML-based data transcription python-module ‘Meteosaver’ to recover more than one million observations of temperature and precipitation. The resulting dataset consists of daily maximum, minimum, and average temperatures (dry bulb and wet bulb) measured three times a day, and daily precipitation.
The analysis was shown to have marked warming in daily maximum, minimum, and average temperatures, corresponding to approximately 0.7°C, 0.3°C, and 0.5°C, respectively, of warming during the 1961–1990 period. It was also reported that increasing frequency of hot days and fewer cold days as compared to earlier decades in the dataset. Due to limited rainfall data, only two stations were found to experience increased frequency of heavy rainfall. Though the changes inferred from this study can not be applied to whole of DRC due to limited spatial coverage, but this study enhances our understanding of changes in climate in DRC, one of the most data sparse region in the world.
Specific comments:
The article is generally well-written and undertakes substantial data-rescue work to produce climate dataset and analyse past climate of Congo basin. The authors describe the current state of data (un)availability in Central Africa for understanding climate change in the region. They use numerous paper records archived in DRC and Belgium to fill in the data gap, and the sources and paper format is described in sufficient detail to understand background of the work being undertaken. The dataset produced has potential to answer many questions regarding scale and impact of climate change in the equatorial Africa.
This paper presents historical climate dataset for DRC, using ML-based transcription process and using statistical QC/QA steps to ensure data accuracy. While ML-based transcriptions have been researched in number of fields, using it to produce a published climate dataset of this size is probably first documented case. This attempt opens a realistic possibility of using ML-based transcriptions to extract historical observations from elsewhere.
The region’s climate has been quantitatively assessed by analyzing long-term in-situ weather observations for the first time. The analysis performed within the limited spatiotemporal dataset shows that the climate has gotten warmer and maybe wetter as well. The results based on limited data support conclusions drawn, subject to further investigations.
Though the paper transcribes and analyses historical weather observations, discussion on observation techniques or instrument metadata has been largely absent. As the biases and offsets are often strongly linked to weather measurement techniques, e.g. how temperature scale was read, was a correction scale was provided/used, bucket size of rain gauge etc. The instrument make and model can also be helpful in assessing systematic biases and can be used to perform QA/QC checks and corrections.
Some discussion on why we expect to find these temperature or rainfall trends in Central Africa will be helpful. Has any earlier studies found similar trends either in observational data or model data?
Citation: https://doi.org/10.5194/egusphere-2026-2107-RC2 -
AC2: 'Reply on RC2', Derrick Muheki, 03 Aug 2026
We thank the reviewer for their time and valuable suggestions to improve the manuscript. In the attached pdf, we respond to the individual comments and illustrate proposed modifications to the manuscript to accommodate the concerns raised. We believe that the manuscript will benefit from these modifications.
-
AC2: 'Reply on RC2', Derrick Muheki, 03 Aug 2026
-
RC3: 'Comment on egusphere-2026-2107', Anonymous Referee #3, 06 Jul 2026
The manuscript titled “From Paper to Proof: Revealing Congo Basin Warming Through Rescued Climate Archives” by Derrick Muheki et al. presents a valuable community resource by rescuing and digitizing historical meteorological observations from the Democratic Republic of the Congo (DRC). The development of a QA/QC workflow and the creation of a long-term observational dataset with more than 1 million observations from 37 stations represent an important contribution to climate research in a data-sparse region.
The manuscript is well written, and the workflow and results are clearly presented. The comments below are primarily intended to improve methodological clarity and reproducibility.
- The dataset combines observations collected over several decades across multiple weather stations. During this period, instrumentation, measurement precision, calibration procedures, and observational practices may have changed. It would be helpful if the authors could comment on whether such temporal and interstation inconsistencies were assessed or accounted for (e. g., through homogenization or other quality-control procedures), and discuss their potential influence on the derived long-term climate trends.
- The QA/QC procedure uses a fixed uncertainty range of 0.2°C for temperature and 0.2% for relative humidity. Could the authors comment on how these thresholds were selected? In particular, were these based on empirical validation, rounding, or sensitivity analysis. Also, is it uncertainty in the range of the reported variable or an acceptance criterion?
- In section 2.3.4, the authors mention that when U, e, and Δe are internally consistent but the reconstructed dry-bulb temperature, T, differs from the transcribed value, the algorithm replaces the transcribed T using equations (5) and (6). This appears to assume that the discrepancy is mainly attributed to T rather than to uncertainties in e and Δe. Since small uncertainty in e and Δe can also propagate into the reconstructed T, could the authors comment on why an asymmetric criterion is considered.
- In section 2.4, the authors mention that the software obtained transcription for 37 stations was validated against manually transcribed records from five stations. It would be helpful to discuss how representative these stations are of the broader archive in terms of climatic regions, handwriting styles, and temporal coverage.
- In section 3.1, the authors mention that 1, 011, 297 records achieved the “highest internal quality flag.” Could the authors briefly describe the flagging scheme used here. Also, the confirmed fraction for precipitation is substantially lower (30%). It would be useful to clarify how this lower confirmation rate affects the reliability and representativeness of the precipitation analyses.
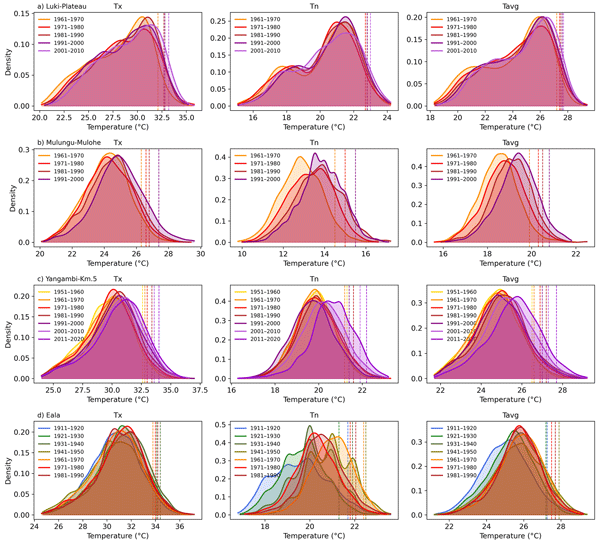
- In the methodology section, the authors describe the construction of kernel density estimation (KDEs) for individual stations, but it is not clear how the aggregated temperature distributions (Fig. 10) are obtained from these station-level KDEs. In particular, whether the aggregated distributions are generated by pooling all daily observations or by combining station-level distributions, and whether any weighting is applied to account for differences in data availability among stations.
Overall, I appreciate the authors for their substantial effort involved in rescuing, digitizing, quality-controlling, and analyzing the historical meteorological dataset for the DRC. The dataset fills an important observational gap and will provide a useful resource for future climate and environmental studies. I believe the manuscript is suitable for publication after the authors have addressed the above mentioned minor points.
Citation: https://doi.org/10.5194/egusphere-2026-2107-RC3 -
AC3: 'Reply on RC3', Derrick Muheki, 03 Aug 2026
We thank the reviewer for their time, positive remarks, and valuable suggestions to improve the manuscript. In the attached PDF, we respond to the individual comments and illustrate modifications to the manuscript to accommodate the concerns raised. We believe that the manuscript will benefit from these modifications.
Peer review completion


Interactive discussion
Status: closed
-
RC1: 'Comment on egusphere-2026-2107', Anonymous Referee #1, 31 May 2026
This manuscript deals with stringent problem in conflict prone Central Africa: Data scarceness, data gaps and sometimes errenous recordings.
While the technical description of the recovery period and the trend anaylis provide an excellent basis for future research, I miss a statement on possible reasons for differences in trends throughout the paper. At least one paragraph in the discussion (e.g at the end of section 4.6) exploring possible drivers of the differences in trends would round up the manuscript. Is it just differences in manifestation of global circulation changes due to climate change? Or it could be due to differences in Land Use Change around the site or further away? May it be attributable to logging or agriculture, to mining or construction, etc. ... . Emphasising such issues would greatly increase the possible audience and the impact of this important recovery mission.
Citation: https://doi.org/10.5194/egusphere-2026-2107-RC1 -
AC1: 'Reply on RC1', Derrick Muheki, 03 Aug 2026
We thank the reviewer for their time and valuable suggestions to improve the manuscript. We agree that the manuscript would benefit from a discussion of possible reasons for differences in trend magnitude and sign among stations. In the revised manuscript, we will expand the Discussion to mention possible contributors to station-level differences, including large-scale climate variability, local environmental conditions, local and remote land-use or land-cover change, and station-specific non-climatic effects (noting that while we performed quality control, we did not undertake a formal homogenization exercise). We will also clarify that this study does not perform a formal attribution analysis, and therefore we cannot quantify the relative contributions of these possible drivers to the observed trends. In the attached document, we propose updated text in the Discussion Section 4.2.
-
AC1: 'Reply on RC1', Derrick Muheki, 03 Aug 2026
-
RC2: 'Comment on egusphere-2026-2107', Anonymous Referee #2, 06 Jul 2026
The article documents, recovers and analyses historical weather records of Congo basin in present-day DRC. The weather records considered in this analysis are primarily from 1960s to 1990s, some records extending into early 2000s. The study undertakes digitalisation (imaging) of 9,885 sheets of paper from 37 weather stations in DRC. Using previously developed ML-based data transcription python-module ‘Meteosaver’ to recover more than one million observations of temperature and precipitation. The resulting dataset consists of daily maximum, minimum, and average temperatures (dry bulb and wet bulb) measured three times a day, and daily precipitation.
The analysis was shown to have marked warming in daily maximum, minimum, and average temperatures, corresponding to approximately 0.7°C, 0.3°C, and 0.5°C, respectively, of warming during the 1961–1990 period. It was also reported that increasing frequency of hot days and fewer cold days as compared to earlier decades in the dataset. Due to limited rainfall data, only two stations were found to experience increased frequency of heavy rainfall. Though the changes inferred from this study can not be applied to whole of DRC due to limited spatial coverage, but this study enhances our understanding of changes in climate in DRC, one of the most data sparse region in the world.
Specific comments:
The article is generally well-written and undertakes substantial data-rescue work to produce climate dataset and analyse past climate of Congo basin. The authors describe the current state of data (un)availability in Central Africa for understanding climate change in the region. They use numerous paper records archived in DRC and Belgium to fill in the data gap, and the sources and paper format is described in sufficient detail to understand background of the work being undertaken. The dataset produced has potential to answer many questions regarding scale and impact of climate change in the equatorial Africa.
This paper presents historical climate dataset for DRC, using ML-based transcription process and using statistical QC/QA steps to ensure data accuracy. While ML-based transcriptions have been researched in number of fields, using it to produce a published climate dataset of this size is probably first documented case. This attempt opens a realistic possibility of using ML-based transcriptions to extract historical observations from elsewhere.
The region’s climate has been quantitatively assessed by analyzing long-term in-situ weather observations for the first time. The analysis performed within the limited spatiotemporal dataset shows that the climate has gotten warmer and maybe wetter as well. The results based on limited data support conclusions drawn, subject to further investigations.
Though the paper transcribes and analyses historical weather observations, discussion on observation techniques or instrument metadata has been largely absent. As the biases and offsets are often strongly linked to weather measurement techniques, e.g. how temperature scale was read, was a correction scale was provided/used, bucket size of rain gauge etc. The instrument make and model can also be helpful in assessing systematic biases and can be used to perform QA/QC checks and corrections.
Some discussion on why we expect to find these temperature or rainfall trends in Central Africa will be helpful. Has any earlier studies found similar trends either in observational data or model data?
Citation: https://doi.org/10.5194/egusphere-2026-2107-RC2 -
AC2: 'Reply on RC2', Derrick Muheki, 03 Aug 2026
We thank the reviewer for their time and valuable suggestions to improve the manuscript. In the attached pdf, we respond to the individual comments and illustrate proposed modifications to the manuscript to accommodate the concerns raised. We believe that the manuscript will benefit from these modifications.
-
AC2: 'Reply on RC2', Derrick Muheki, 03 Aug 2026
-
RC3: 'Comment on egusphere-2026-2107', Anonymous Referee #3, 06 Jul 2026
The manuscript titled “From Paper to Proof: Revealing Congo Basin Warming Through Rescued Climate Archives” by Derrick Muheki et al. presents a valuable community resource by rescuing and digitizing historical meteorological observations from the Democratic Republic of the Congo (DRC). The development of a QA/QC workflow and the creation of a long-term observational dataset with more than 1 million observations from 37 stations represent an important contribution to climate research in a data-sparse region.
The manuscript is well written, and the workflow and results are clearly presented. The comments below are primarily intended to improve methodological clarity and reproducibility.
- The dataset combines observations collected over several decades across multiple weather stations. During this period, instrumentation, measurement precision, calibration procedures, and observational practices may have changed. It would be helpful if the authors could comment on whether such temporal and interstation inconsistencies were assessed or accounted for (e. g., through homogenization or other quality-control procedures), and discuss their potential influence on the derived long-term climate trends.
- The QA/QC procedure uses a fixed uncertainty range of 0.2°C for temperature and 0.2% for relative humidity. Could the authors comment on how these thresholds were selected? In particular, were these based on empirical validation, rounding, or sensitivity analysis. Also, is it uncertainty in the range of the reported variable or an acceptance criterion?
- In section 2.3.4, the authors mention that when U, e, and Δe are internally consistent but the reconstructed dry-bulb temperature, T, differs from the transcribed value, the algorithm replaces the transcribed T using equations (5) and (6). This appears to assume that the discrepancy is mainly attributed to T rather than to uncertainties in e and Δe. Since small uncertainty in e and Δe can also propagate into the reconstructed T, could the authors comment on why an asymmetric criterion is considered.
- In section 2.4, the authors mention that the software obtained transcription for 37 stations was validated against manually transcribed records from five stations. It would be helpful to discuss how representative these stations are of the broader archive in terms of climatic regions, handwriting styles, and temporal coverage.
- In section 3.1, the authors mention that 1, 011, 297 records achieved the “highest internal quality flag.” Could the authors briefly describe the flagging scheme used here. Also, the confirmed fraction for precipitation is substantially lower (30%). It would be useful to clarify how this lower confirmation rate affects the reliability and representativeness of the precipitation analyses.
- In the methodology section, the authors describe the construction of kernel density estimation (KDEs) for individual stations, but it is not clear how the aggregated temperature distributions (Fig. 10) are obtained from these station-level KDEs. In particular, whether the aggregated distributions are generated by pooling all daily observations or by combining station-level distributions, and whether any weighting is applied to account for differences in data availability among stations.
Overall, I appreciate the authors for their substantial effort involved in rescuing, digitizing, quality-controlling, and analyzing the historical meteorological dataset for the DRC. The dataset fills an important observational gap and will provide a useful resource for future climate and environmental studies. I believe the manuscript is suitable for publication after the authors have addressed the above mentioned minor points.
Citation: https://doi.org/10.5194/egusphere-2026-2107-RC3 -
AC3: 'Reply on RC3', Derrick Muheki, 03 Aug 2026
We thank the reviewer for their time, positive remarks, and valuable suggestions to improve the manuscript. In the attached PDF, we respond to the individual comments and illustrate modifications to the manuscript to accommodate the concerns raised. We believe that the manuscript will benefit from these modifications.
Peer review completion
Journal article(s) based on this preprint
Data sets
Daily and Sub-daily Temperature and Daily Precipitation Records from 37 INERA stations across the Democratic Republic of the Congo D. Muheki et al. https://doi.org/10.5281/zenodo.18770063
Viewed
| HTML | XML | Total | BibTeX | EndNote | |
|---|---|---|---|---|---|
| 480 | 386 | 44 | 910 | 42 | 39 |
- HTML: 480
- PDF: 386
- XML: 44
- Total: 910
- BibTeX: 42
- EndNote: 39
Viewed (geographical distribution)
| Country | # | Views | % |
|---|
| Total: | 0 |
| HTML: | 0 |
| PDF: | 0 |
| XML: | 0 |
- 1

Koen Hufkens
Kim Jacobsen
Hans Verbeeck
Pascal Boeckx
Dominique Kankonde Ntumba
Olivier Kapalay Moulasa
Bas Vercruysse
Julie M. Birkholz
Christophe Verbruggen
Ed Hawkins
Seppe Lampe
Emmanuel Kasongo Yakusu
Fils Makanzu Imwangana
José Mbifo
Théophile Besango Likwela
Félicien Meunier
Olivier Dewitte
Peter Thorne
Wim Thiery
The requested preprint has a corresponding peer-reviewed final revised paper. You are encouraged to refer to the final revised version.
- Preprint
(15117 KB) - Metadata XML
This manuscript deals with stringent problem in conflict prone Central Africa: Data scarceness, data gaps and sometimes errenous recordings.
While the technical description of the recovery period and the trend anaylis provide an excellent basis for future research, I miss a statement on possible reasons for differences in trends throughout the paper. At least one paragraph in the discussion (e.g at the end of section 4.6) exploring possible drivers of the differences in trends would round up the manuscript. Is it just differences in manifestation of global circulation changes due to climate change? Or it could be due to differences in Land Use Change around the site or further away? May it be attributable to logging or agriculture, to mining or construction, etc. ... . Emphasising such issues would greatly increase the possible audience and the impact of this important recovery mission.