
the Creative Commons Attribution 4.0 License.
the Creative Commons Attribution 4.0 License.
 | 01 Apr 2026
How beech ecophysiology shapes temperate forest gross primary productivity – Part 1: A wavelet-based framework for extracting seasonal dynamics
Abstract. Long-term eddy covariance (EC) records provide unique opportunities to investigate how seasonal carbon dynamics shape interannual and decadal trends in forest carbon uptake. Yet extracting reproducible phenological and structural information from noisy, non‑stationary gross primary productivity (GPP) time series remains challenging. Here we present a wavelet‑based analytical framework that directly exploits the time-frequency structure of GPP signals to identify repeated seasonal features. This approach departs from standard wavelet applications by analyzing the full set of wavelet coefficients as an interpretable structure to systematically detect and characterize recurrent patterns, including moderate‑amplitude events that are typically overlooked by significance‑based or visually driven wavelet analyses. Building on this foundation, we introduce a novel Wavelet Area Interpretation (WAI) method that extracts three complementary indicators of seasonal GPP dynamics (IRise for rising rate; IPeak for peak productivity; IDrop for mid‑season decline) and derives carbon‑uptake phenological markers within a unified workflow. Together, these metrics provide a coherent representation of the timing, magnitude and shape of the seasonal GPP cycle. We apply this framework to long‑term EC records from three contrasting ICOS-labelled European beech‑dominated forests (DE‑Hai, DK‑Sor, FR‑Hes), demonstrating its ability to reveal both structural differences among sites and divergent long‑term trajectories in carbon uptake. Benchmarking against classic smoothed GPP reference values confirms the robustness of IRise and IPeak and clarifies the inherent uncertainties associated with mid‑season metrics. Ecologically, the indicators uncover consistent contrasts in seasonal structure: rapid spring rise at FR‑Hes, muted mid‑season decline at DK‑Sor, and early cessation of uptake at DE‑Hai. They reveal opposing multi‑decadal trends, with peak productivity increasing in the managed stands but declining in the unmanaged old‑growth forest. The negative association between IRise and mid-season drop timing further suggests intra‑seasonal trade‑off linking early‑season vigor to mid‑season susceptibility. Overall, this study provides a novel, scale‑aware approach for extracting seasonal information from noisy time series and demonstrates how WAI‑derived indicators can yield new insights into the mechanisms driving long‑term variability across sites and applications.
-
Notice on discussion status
The requested preprint has a corresponding peer-reviewed final revised paper. You are encouraged to refer to the final revised version.
-
Preprint
(2463 KB)
-
Supplement
(833 KB)
-
The requested preprint has a corresponding peer-reviewed final revised paper. You are encouraged to refer to the final revised version.
- Preprint
(2463 KB) - Metadata XML
-
Supplement
(833 KB) - BibTeX
- EndNote
- Final revised paper


Journal article(s) based on this preprint
Interactive discussion
Status: closed
-
RC1: 'Comment on egusphere-2026-1670', Anonymous Referee #1, 20 May 2026
- AC1: 'Reply on RC1', Jonathan Bitton, 28 Jun 2026
-
RC2: 'Comment on egusphere-2026-1670', Anonymous Referee #2, 14 Jun 2026
The manuscript introduces a new approach to use wavelets to understanding time-frequency signals in GPP inferred from long-term eddy covariance measurements. It is based on a novel wavelet area interpretation that reveals three indicators for GPP dynamics, i.e. for the rate of change during GPP rise, for peak GPP, and for mid-season decline.
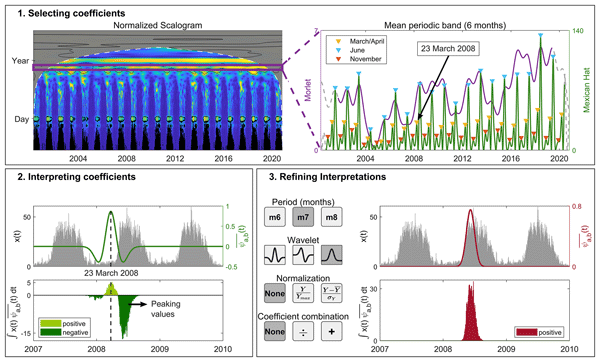
In my view, this is a new and interesting approach that has the potential to be used for similar questions across the Fluxnet sites. The approach is very well explained, particularly the figure 1 to 3 are really helpful for illustrating the approach step by step. The writing and figure are of high quality. In my view, there are not many issues that need to be addressed before publication.
The only major question is whether the selection of the wavelets and of the period length can be underpinned with a more quantitative approach. The text provides good qualitative arguments why a specific wavelet is more suited than another, similar why a certain period length is most appropriate. But we lack clear quantitative arguments. It would be nice to see how sensitive the final indicators are for these choices. Providing here a more systematic quantitative approach would make it easier to transfer the approach to dataset from other sites.
Minor issues:
Fig. 3 is very helpful. I suggest adding a bit more text to the caption so that the figure can stand for itself.
Line 365: why where the GPP data smoothed? How much would the results change if the data had not been smoothed? What are the implications of the smoothing when we have fast changes in GPP in spring?
Line 412: “which implies more CO2 emission proportionally to absorption over years”: maybe rephrase to e.g. “which implies less CO2 uptake over the years”.
Fig. 9: for the year 2014 and 2023 DE-Hai showed unusually high DOY for MSD. Why?
Entire manuscript: please check for C02 and place 2 in subscript.
Citation: https://doi.org/10.5194/egusphere-2026-1670-RC2 - AC2: 'Reply on RC2', Jonathan Bitton, 28 Jun 2026
Peer review completion


Interactive discussion
Status: closed
-
RC1: 'Comment on egusphere-2026-1670', Anonymous Referee #1, 20 May 2026
This manuscript presents a powerful and broadly applicable wavelet-based framework for extracting ecological information from noisy, non-stationary signals. The method successfully identifies recurrent seasonal events in ecosystem carbon-flux time series by exploiting the full structure of wavelet coefficients, rather than relying on a limited subset of statistically significant power regions.
The proposed WAI approach is extensively evaluated through detailed illustrations of the computational workflow and scatter-plot comparisons against EC-derived estimates. The method enables the extraction of consistent carbon-uptake phenological markers together with three structural indicators (IRise, IPeak, and IDrop) across three European forest EC sites. These metrics provide valuable insights into beech ecophysiology in temperate forests, including the timing, magnitude, and internal seasonal structure of the GPP cycle.
However, in my opinion, the manuscript lacks sufficient methodological rigor and robustness in several aspects related to the justification of key steps in the experimental procedure and in the extraction of the GPP reference indicators. In particular, I believe that some clarifications and improvements are necessary to enhance the overall quality of the paper:
- Refining interpretation and reducing uncertainties:
In Section 2.2, the selection procedure involves adjusting the WT to align coefficient values with a given interpretation, while a wide range of possible alternatives exists and is described in Supplement S3. However, none of these alternative approaches are tested using the data presented in the manuscript, nor is a clear justification provided for the selection of the specific method adopted by the authors. - Selection coefficients: In Section 2.3.3, I believe that the potential impact of the wavelet selection on the derived indicators has not been sufficiently analyzed. The choice of wavelets appears somewhat arbitrary, and no references or previous studies supporting these selections are provided in this section.
- Computation of smoothed-GPP references indicators: It is understandable that the authors require reference data to compare against the derived indicators. However, the proposed smoothed-GPP approach is not sufficiently justified. Several questions arise regarding this procedure. For instance, the manuscript does not clearly specify which smoothing method has been applied to the GPP data, despite the fact that GPP time series are typically very noisy and that the choice of filtering method may critically affect the extraction of the indicators. Furthermore, the definition of the indicators is not adequately introduced, and additional references to previous scientific studies should be included.
- Evaluating annual trends: I believe the proposed method (line 395) is not well introduced nor justified. References or scientific works where this approach is used should be included.
- Discussion: I believe that this section should include a brief discussion on if this method could be applied to other types of land cover.
Citation: https://doi.org/10.5194/egusphere-2026-1670-RC1 - AC1: 'Reply on RC1', Jonathan Bitton, 28 Jun 2026
- Refining interpretation and reducing uncertainties:
-
RC2: 'Comment on egusphere-2026-1670', Anonymous Referee #2, 14 Jun 2026
The manuscript introduces a new approach to use wavelets to understanding time-frequency signals in GPP inferred from long-term eddy covariance measurements. It is based on a novel wavelet area interpretation that reveals three indicators for GPP dynamics, i.e. for the rate of change during GPP rise, for peak GPP, and for mid-season decline.
In my view, this is a new and interesting approach that has the potential to be used for similar questions across the Fluxnet sites. The approach is very well explained, particularly the figure 1 to 3 are really helpful for illustrating the approach step by step. The writing and figure are of high quality. In my view, there are not many issues that need to be addressed before publication.
The only major question is whether the selection of the wavelets and of the period length can be underpinned with a more quantitative approach. The text provides good qualitative arguments why a specific wavelet is more suited than another, similar why a certain period length is most appropriate. But we lack clear quantitative arguments. It would be nice to see how sensitive the final indicators are for these choices. Providing here a more systematic quantitative approach would make it easier to transfer the approach to dataset from other sites.
Minor issues:
Fig. 3 is very helpful. I suggest adding a bit more text to the caption so that the figure can stand for itself.
Line 365: why where the GPP data smoothed? How much would the results change if the data had not been smoothed? What are the implications of the smoothing when we have fast changes in GPP in spring?
Line 412: “which implies more CO2 emission proportionally to absorption over years”: maybe rephrase to e.g. “which implies less CO2 uptake over the years”.
Fig. 9: for the year 2014 and 2023 DE-Hai showed unusually high DOY for MSD. Why?
Entire manuscript: please check for C02 and place 2 in subscript.
Citation: https://doi.org/10.5194/egusphere-2026-1670-RC2 - AC2: 'Reply on RC2', Jonathan Bitton, 28 Jun 2026
Peer review completion
Journal article(s) based on this preprint
Data sets
FR-Hes dataset (1997–2020) Jonathan Bitton and Bernard Longdoz https://doi.org/10.5281/zenodo.19207876
Model code and software
WAI matlab/python codes Jonathan Bitton https://doi.org/10.5281/zenodo.19207876
Viewed
| HTML | XML | Total | Supplement | BibTeX | EndNote | |
|---|---|---|---|---|---|---|
| 359 | 138 | 47 | 544 | 97 | 38 | 59 |
- HTML: 359
- PDF: 138
- XML: 47
- Total: 544
- Supplement: 97
- BibTeX: 38
- EndNote: 59
Viewed (geographical distribution)
| Country | # | Views | % |
|---|
| Total: | 0 |
| HTML: | 0 |
| PDF: | 0 |
| XML: | 0 |
- 1
Jonathan Bitton

Catherine Charles
Bernard Longdoz
Bernard Heinesch
The requested preprint has a corresponding peer-reviewed final revised paper. You are encouraged to refer to the final revised version.
- Preprint
(2463 KB) - Metadata XML
-
Supplement
(833 KB) - BibTeX
- EndNote
- Final revised paper
This manuscript presents a powerful and broadly applicable wavelet-based framework for extracting ecological information from noisy, non-stationary signals. The method successfully identifies recurrent seasonal events in ecosystem carbon-flux time series by exploiting the full structure of wavelet coefficients, rather than relying on a limited subset of statistically significant power regions.
The proposed WAI approach is extensively evaluated through detailed illustrations of the computational workflow and scatter-plot comparisons against EC-derived estimates. The method enables the extraction of consistent carbon-uptake phenological markers together with three structural indicators (IRise, IPeak, and IDrop) across three European forest EC sites. These metrics provide valuable insights into beech ecophysiology in temperate forests, including the timing, magnitude, and internal seasonal structure of the GPP cycle.
However, in my opinion, the manuscript lacks sufficient methodological rigor and robustness in several aspects related to the justification of key steps in the experimental procedure and in the extraction of the GPP reference indicators. In particular, I believe that some clarifications and improvements are necessary to enhance the overall quality of the paper:
In Section 2.2, the selection procedure involves adjusting the WT to align coefficient values with a given interpretation, while a wide range of possible alternatives exists and is described in Supplement S3. However, none of these alternative approaches are tested using the data presented in the manuscript, nor is a clear justification provided for the selection of the specific method adopted by the authors.