
the Creative Commons Attribution 4.0 License.
the Creative Commons Attribution 4.0 License.
 | 17 Apr 2026
Multiscale assessment of Indian monsoon rainfall using ICON and CMIP6 model simulations
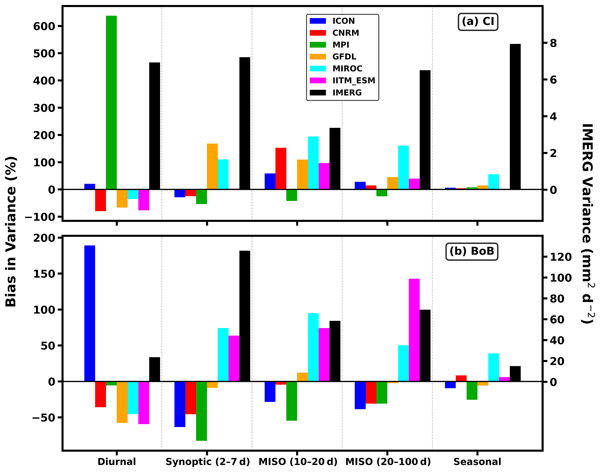
Abstract. Indian Summer Monsoon (ISM) rainfall is organized across multiple timescales, from diurnal convection to synoptic disturbances, intraseasonal oscillations, and the seasonal mean. Climate models often show different levels of skill at each of these timescales, raising an important question: how do scale-dependent biases shape overall monsoon variability? Here, we assess a medium-resolution (40 km), non-hydrostatic global model (ICON) together with five hydrostatic CMIP6-class models (CNRM, MPI, GFDL, MIROC6, and IITM-ESM; 50–190 km resolution). All simulations are evaluated in AMIP configuration against high-resolution IMERG observations during 1998–2014, allowing isolation of atmospheric sources of rainfall bias. Rainfall errors are strongly scale-dependent and exhibit clear land–ocean contrasts. At the diurnal scale, ICON reproduces amplitudes over the continent with a relatively small bias (∼5–10 %), whereas MPI overestimates land diurnal amplitude by more than 150 % with premature triggering. The CNRM and GFDL show early daytime convection and weak nocturnal rainfall, while MIROC6 and IITM-ESM exhibit reduced diurnal amplitude linked to convective and resolution limitations. Over the Bay of Bengal, ICON overestimates diurnal amplitude (∼60 %) and variance (∼180 %), whereas CMIP6 models underestimate nocturnal oceanic variability (amplitude < 40 %, variance < 60 %). At synoptic timescales (2–7 days), models differ in their ability to sustain organized monsoon disturbances. ICON and GFDL maintain realistic spatial structure with moderate suppression, while MPI underestimates synoptic variance by up to ∼70–80 %. Other models either has weakened synoptic activity or redistribute variability toward intermediate (10–20 day) bands. Across the ensemble, the 20–100-day intraseasonal band is systematically underestimated (by ∼30–60 %) in the AMIP framework, suggesting that coupled ocean–atmosphere feedbacks, among other factors, contribute to maintaining monsoon intraseasonal oscillations. Seasonal rainfall patterns reflect the combined effect of these multiscale biases. Models that maintain a balanced variance distribution across diurnal, synoptic, and intraseasonal bands show improved seasonal structure, whereas distortions at intermediate frequencies contribute to amplitude and migration errors. These results indicate that credible monsoon simulation depends not only on seasonal-mean accuracy but also on physically consistent variability across timescales. A scale-aware diagnostic framework is therefore essential for improving convective triggering, mesoscale organization, boundary-layer processes, and air–sea coupling in climate models.
-
Notice on discussion status
The requested preprint has a corresponding peer-reviewed final revised paper. You are encouraged to refer to the final revised version.
-
Preprint
(3270 KB)
-
Supplement
(927 KB)
-
The requested preprint has a corresponding peer-reviewed final revised paper. You are encouraged to refer to the final revised version.
- Preprint
(3270 KB) - Metadata XML
-
Supplement
(927 KB) - BibTeX
- EndNote
- Final revised paper


Journal article(s) based on this preprint
Interactive discussion
Status: closed
-
RC1: 'Comment on egusphere-2026-1644', Sugata Narsey, 22 May 2026
-
AC1: 'Reply on RC1', Samir Pokhrel, 10 Jun 2026
Dear Dr. Sugata Narsey,
We sincerely thank you for your constructive comments and insightful suggestions. These have greatly contributed to improving the manuscript. Find attached the pdf version of the review comments and replies. The point-by-point response to each of your comments is in blue font for ease of identification.
-
AC1: 'Reply on RC1', Samir Pokhrel, 10 Jun 2026
-
RC2: 'Comment on egusphere-2026-1644', Anonymous Referee #2, 24 Jun 2026
General Comments
The paper evaluates how well a medium-resolution (~40 km) non-hydrostatic global model (ICON, EXCLAIM/GT4Py version) reproduces Indian Summer Monsoon (ISM) rainfall variability compared with five hydrostatic CMIP6 AMIP models (CNRM-CM6-1-HR, MPI-ESM1.2-HR, GFDL-CM4, MIROC6, IITM-ESM; 50–190 km). The reference is GPM-IMERG V07. The topic is relevant and important to the model development community. However, the current version of the manuscript has some flaws that must be addressed before publication. I list my concerns below.
Specific Comments
1. The abstract specifies 1998-2014 as the analysis period. However, in the caption of Figure 3, it is mentioned that the analysis period is 1979-2014. Is there an inconsistency in the analysis using different datasets?
2. The major claim by the authors is that ICON (non-hydrostatic; 40 km resolution) is the best for the monsoon. The ICON model is compared with the AMIP simulations of a subset of CMIP6 models, which are much coarser in resolution. The gap between the resolutions of ICON and other models ranges from ~1.25 to ~5 times. This difference in resolution makes the comparison unfair. A fair comparison can be made with the hydrostatic version of the ICON model by keeping the resolution the same. Alternatively, the authors can use HighResMIP simulations.
3. The PDFs are computed on the native grids of each model (section 3.2.2, Figure 9). The rainfall PDFs are heavily dependent on resolution. In line with the specific comment #2, this is also an unfair comparison and a misleading analysis (coarser grids smooth extremes).
4. The claim that 20–100-d ISO underestimation reflects missing air–sea coupling is plausible but unverified here; a coupled run of any of these models is not included.
5. The discussion repeatedly highlights ICON's strengths while downplaying its weaknesses. E.g., a 180% variance bias and 60% amplitude bias over BoB (substantially worse than several CMIP6 models in absolute terms) is acknowledged but minimised as "over-responsive high-frequency convective adjustment."
Minor Comments
1. L324: Wrong figure reference. Fig. 5g is IMERG
2. L31: Citation "(N., 2005)" appears malformed.
Citation: https://doi.org/10.5194/egusphere-2026-1644-RC2 -
AC2: 'Reply on RC2', Samir Pokhrel, 29 Jun 2026
We sincerely thank the reviewer for the constructive comments and insightful suggestions, which have significantly improved the quality of this manuscript. We have provided a detailed, point-by-point response to each of the comments as an attachment. We have diligently incorporated all the suggestions and comments in the revised manuscript. The replies are in blue font.
-
AC2: 'Reply on RC2', Samir Pokhrel, 29 Jun 2026
Peer review completion


Interactive discussion
Status: closed
-
RC1: 'Comment on egusphere-2026-1644', Sugata Narsey, 22 May 2026
Title: Multiscale Assessment of Indian monsoon rainfall using ICON and CMIP6 model simulations
By: Pokhrel et al
Reviewer: Sugata Narsey, Australian Bureau of Meteorology
Recommendation: Accept with minor revisions
In this manuscript the authors systematically evaluate Indian monsoon rainfall at multiple time scales in the ICON non-hydrostatic model and 5 CMIP6 models under a prescribed SST set-up. They explore whether a non-hydrostatic model, and/or higher spatial resolution, improves the simulation of Indian monsoon rainfall across scales. Their findings are mixed – while ICON shows some improvements over the CMIP6 models it also has some larger deficiencies at some time scales and in geographic locations. Likewise, higher resolution alone was not a panacea for Indian monsoon rainfall, with relatively coarse models such as IITM-ESM outperforming or matching other models in some areas. The manuscript is well-written and presented, the analysis is of a high quality, the work is novel, and the conclusions are well-supported by evidence. I recommend that the manuscript is accepted with minor revisions.
Main comments:
- While the multiscale error assessment is useful, I would find this manuscript to be more useful overall if there were a summary figure or analysis specifically showing the cross-scale relationships of errors, e.g. a heatmap of metrics for each model. I would cite this paper for that specifically! The abstract asks how scale-dependent biases shape monsoon variability, but I feel that this was not addressed clearly in the paper (but could be with one more figure).
- A little more clarity on the model choices and methodological choices earlier in the manuscript would improve readability. Why ICON? Will it be used for some other purpose soon? Why these 5 CMIP models? Yes they vary across scales, but is this an ensemble of convenience (data availability) or is it a model subset choice? If the latter then justify it. Harmonic analysis is ubiquitous in math and physics, but less common in atmospheric science than perhaps it should be. Add a few references showing examples of how it has usefully been applied to gain insights.
- Well done on a nice manuscript! I enjoyed reading it and learned some interesting things about Indian monsoon rainfall.
Specific comments:
L27: what does block level mean?
L31: N. 2005 is a strange way to reference.
L45: There is some evidence that monsoon depressions are barotropic:
Diaz, M., & Boos, W. R. (2021). The influence of surface heat fluxes on the growth of idealized monsoon. Journal of the Atmospheric Sciences. https://doi.org/10.1175/JAS-D-20-0359.1
L56: no need for etc
L75: This is a key point that I think could be made much earlier!! Forgot full stop.
L102: why these 5 models? And what is the motivation for ICON specifically?
L170: can you provide some justification for using harmonic analysis? Some citations or examples of previous use. Pros and cons of this vs other potential methods.
L173: throughout the manuscript, please use the acronyms from Table 1.
Fig 2: I wonder how these biases would look as a percentage... I suspect ICON would look better!
L384: full stop.
L577: i can see how this is suggested by results, but its not clearly shown. here, and throughout the manuscript, the link between two or more evaluation metrics could be displayed through a figure (scatter plots for example).
L640: what specifically do you mean by higher-frequency variance? these two statements seem circular, since higher amplitude surely means higher variance.
L645: this seems important. i would clarify this earlier, perhaps even in the methodology.
L671: is this shown somewhere? I guess this indicates a larger-scale e.g. circulation (or finer scale e.g. microphysics) control on precipitation?
L677-681: this sentence is too long.
L694: though here you have prescribed SST so not really well-investigated?
L718: credible for what purpose? No parameterised convection scheme will represent squall lines, but may still be useful for other applications.
Citation: https://doi.org/10.5194/egusphere-2026-1644-RC1 -
AC1: 'Reply on RC1', Samir Pokhrel, 10 Jun 2026
Dear Dr. Sugata Narsey,
We sincerely thank you for your constructive comments and insightful suggestions. These have greatly contributed to improving the manuscript. Find attached the pdf version of the review comments and replies. The point-by-point response to each of your comments is in blue font for ease of identification.
-
RC2: 'Comment on egusphere-2026-1644', Anonymous Referee #2, 24 Jun 2026
General Comments
The paper evaluates how well a medium-resolution (~40 km) non-hydrostatic global model (ICON, EXCLAIM/GT4Py version) reproduces Indian Summer Monsoon (ISM) rainfall variability compared with five hydrostatic CMIP6 AMIP models (CNRM-CM6-1-HR, MPI-ESM1.2-HR, GFDL-CM4, MIROC6, IITM-ESM; 50–190 km). The reference is GPM-IMERG V07. The topic is relevant and important to the model development community. However, the current version of the manuscript has some flaws that must be addressed before publication. I list my concerns below.
Specific Comments
1. The abstract specifies 1998-2014 as the analysis period. However, in the caption of Figure 3, it is mentioned that the analysis period is 1979-2014. Is there an inconsistency in the analysis using different datasets?
2. The major claim by the authors is that ICON (non-hydrostatic; 40 km resolution) is the best for the monsoon. The ICON model is compared with the AMIP simulations of a subset of CMIP6 models, which are much coarser in resolution. The gap between the resolutions of ICON and other models ranges from ~1.25 to ~5 times. This difference in resolution makes the comparison unfair. A fair comparison can be made with the hydrostatic version of the ICON model by keeping the resolution the same. Alternatively, the authors can use HighResMIP simulations.
3. The PDFs are computed on the native grids of each model (section 3.2.2, Figure 9). The rainfall PDFs are heavily dependent on resolution. In line with the specific comment #2, this is also an unfair comparison and a misleading analysis (coarser grids smooth extremes).
4. The claim that 20–100-d ISO underestimation reflects missing air–sea coupling is plausible but unverified here; a coupled run of any of these models is not included.
5. The discussion repeatedly highlights ICON's strengths while downplaying its weaknesses. E.g., a 180% variance bias and 60% amplitude bias over BoB (substantially worse than several CMIP6 models in absolute terms) is acknowledged but minimised as "over-responsive high-frequency convective adjustment."
Minor Comments
1. L324: Wrong figure reference. Fig. 5g is IMERG
2. L31: Citation "(N., 2005)" appears malformed.
Citation: https://doi.org/10.5194/egusphere-2026-1644-RC2 -
AC2: 'Reply on RC2', Samir Pokhrel, 29 Jun 2026
We sincerely thank the reviewer for the constructive comments and insightful suggestions, which have significantly improved the quality of this manuscript. We have provided a detailed, point-by-point response to each of the comments as an attachment. We have diligently incorporated all the suggestions and comments in the revised manuscript. The replies are in blue font.
-
AC2: 'Reply on RC2', Samir Pokhrel, 29 Jun 2026
Peer review completion
Journal article(s) based on this preprint
Viewed
| HTML | XML | Total | Supplement | BibTeX | EndNote | |
|---|---|---|---|---|---|---|
| 418 | 212 | 35 | 665 | 62 | 31 | 34 |
- HTML: 418
- PDF: 212
- XML: 35
- Total: 665
- Supplement: 62
- BibTeX: 31
- EndNote: 34
Viewed (geographical distribution)
| Country | # | Views | % |
|---|
| Total: | 0 |
| HTML: | 0 |
| PDF: | 0 |
| XML: | 0 |
- 1

Verma Utkarsh
Patita Kalyana Sahoo
Praveen Pothapakula
Anusha Sunkisala
Nishant Gautam
Kolady P. Pribin
Shivamurthy Yashas
Hemant S. Chaudhari
Archana Rai
Hasibur Rahaman
Andreas F. Prein
Anurag Dipankar
Subodh K. Saha
The requested preprint has a corresponding peer-reviewed final revised paper. You are encouraged to refer to the final revised version.
- Preprint
(3270 KB) - Metadata XML
-
Supplement
(927 KB) - BibTeX
- EndNote
- Final revised paper
Title: Multiscale Assessment of Indian monsoon rainfall using ICON and CMIP6 model simulations
By: Pokhrel et al
Reviewer: Sugata Narsey, Australian Bureau of Meteorology
Recommendation: Accept with minor revisions
In this manuscript the authors systematically evaluate Indian monsoon rainfall at multiple time scales in the ICON non-hydrostatic model and 5 CMIP6 models under a prescribed SST set-up. They explore whether a non-hydrostatic model, and/or higher spatial resolution, improves the simulation of Indian monsoon rainfall across scales. Their findings are mixed – while ICON shows some improvements over the CMIP6 models it also has some larger deficiencies at some time scales and in geographic locations. Likewise, higher resolution alone was not a panacea for Indian monsoon rainfall, with relatively coarse models such as IITM-ESM outperforming or matching other models in some areas. The manuscript is well-written and presented, the analysis is of a high quality, the work is novel, and the conclusions are well-supported by evidence. I recommend that the manuscript is accepted with minor revisions.
Main comments:
Specific comments:
L27: what does block level mean?
L31: N. 2005 is a strange way to reference.
L45: There is some evidence that monsoon depressions are barotropic:
Diaz, M., & Boos, W. R. (2021). The influence of surface heat fluxes on the growth of idealized monsoon. Journal of the Atmospheric Sciences. https://doi.org/10.1175/JAS-D-20-0359.1
L56: no need for etc
L75: This is a key point that I think could be made much earlier!! Forgot full stop.
L102: why these 5 models? And what is the motivation for ICON specifically?
L170: can you provide some justification for using harmonic analysis? Some citations or examples of previous use. Pros and cons of this vs other potential methods.
L173: throughout the manuscript, please use the acronyms from Table 1.
Fig 2: I wonder how these biases would look as a percentage... I suspect ICON would look better!
L384: full stop.
L577: i can see how this is suggested by results, but its not clearly shown. here, and throughout the manuscript, the link between two or more evaluation metrics could be displayed through a figure (scatter plots for example).
L640: what specifically do you mean by higher-frequency variance? these two statements seem circular, since higher amplitude surely means higher variance.
L645: this seems important. i would clarify this earlier, perhaps even in the methodology.
L671: is this shown somewhere? I guess this indicates a larger-scale e.g. circulation (or finer scale e.g. microphysics) control on precipitation?
L677-681: this sentence is too long.
L694: though here you have prescribed SST so not really well-investigated?
L718: credible for what purpose? No parameterised convection scheme will represent squall lines, but may still be useful for other applications.