
the Creative Commons Attribution 4.0 License.
the Creative Commons Attribution 4.0 License.
 | 26 Mar 2026
Balancing nitrogen use efficiency, losses and soil nitrogen depletion to evaluate agri-environmental performance across spatial scales over 40 years
Abstract. Nitrogen (N) is essential for agricultural productivity, but excessive N inputs result in substantial losses to the environment. Conducting N assessments at national scales is challenging because observational data are limited, especially over long time periods. Here we compiled detailed datasets and performed high-resolution biogeochemical modelling to quantify N budgets for Switzerland's diverse agricultural ecosystems over four decades. Between the 1980s and the 2010s, N use efficiency improved from 47 % to 57 % in croplands and from 63 % to 71 % in grasslands, while losses through leaching and gas emissions decreased by 24 % in croplands and 4 % in grasslands. These improvements are closely linked to the implementation of national-scale agri-environmental policies that reduced fertilizer use in the 1990s. However, despite increased efficiency, cropland soils experienced substantial N depletion between 1995 and 2011 (−23 kg N ha-1 yr-1) in croplands. Our results demonstrate that policy reforms have improved agricultural system functioning and reduced losses, but also reveal risks associated with unbalanced soil N, underscoring the need for integrated N management for sustainable agriculture.
-
Notice on discussion status
The requested preprint has a corresponding peer-reviewed final revised paper. You are encouraged to refer to the final revised version.
-
Preprint
(10035 KB)
-
Supplement
(4626 KB)
-
The requested preprint has a corresponding peer-reviewed final revised paper. You are encouraged to refer to the final revised version.
- Preprint
(10035 KB) - Metadata XML
-
Supplement
(4626 KB) - BibTeX
- EndNote
- Final revised paper


Journal article(s) based on this preprint
Interactive discussion
Status: closed
-
RC1: 'Comment on egusphere-2026-1287', Zimeng Wang, 18 May 2026
- AC1: 'Reply on RC1', Jize Jiang, 18 Jul 2026
-
RC2: 'Comment on egusphere-2026-1287', Anonymous Referee #2, 27 Jun 2026
The manuscript provides an assessment of changes in Nitrogen status in Swiss grasslands between 1981 and 2020 as simulated by DayCent model. The authors propose 3 indicators – Nitrogen use efficiency (NUE), N loss, and soil N stock as a comprehensive framework for evaluating N response to changes in agricultural management and policy. The study incorporates a multitude of data sources to deliver spatially explicit modelling of N dynamics over Swiss grasslands. The main findings are: NUE improvement in croplands and grassland mainly due to reduction in N fertilizer application; N loss reduction proportionally to the reduction in N input; and N stock depletion in croplands. The main contribution of this research is the spatially comprehensive assessment of different aspects of N dynamics which provides detailed national picture of long-term results of the policy change.
Since the comprehensive results were obtained entirely through modeling, the validity of the conclusions fully relies on the model formulation and parametrization. In particular, the 3 indicators selected by authors: NUE, N loss, and N stock are a result of a simulation by the DayCent model, therefore their apparent change is not something that was observed in reality, but rather a consequences of the model structure, parameters, and drivers (drivers being based on the observational data). While the authors argue that their findings “highlight the importance of policy intervention for agricultural N management” the link between policy changes, model drivers and/or parameters, and output is not sufficiently established throughout the manuscript.
The authors acknowledge the inherent uncertainty of modeling results and list uncertainty sources it in the discussion. While modelled yields and soil N changes are compared to the observed data (Supplementary Figures S2, S3, S5), no quantitative assessment of modelling error and uncertainty is provided.
Overall, more information is needed for the readers to understand where the results come from and make a conclusion about their robustness. Therefore, I suggest making the following changes to the manuscript:
- Add a more detailed description of how policy reforms of 1990s and changes in farmers’ practices were reflected in the model drivers, i.e. fertilization, crop rotations, tillage, etc.
- Add a sensitivity analysis, illustrating and comparing NUE, N loss and N stock sensitivity in croplands and grasslands to changes in drivers over the course of the simulation: both drivers affected by policy change, and unrelated to policy change – e.g. temperature and moisture regimes. This will illustrate the comparative importance of factors in the model and provide a clear interpretation of simulation results.
- Add a quantitative uncertainty analysis, estimating uncertainty of simulated NUE, N loss and N stock due to uncertainty in parameter estimation. Currently, authors describe parameters as being based on several experimental studies in Switzerland, however, the uncertainty of it, and how it translates into the uncertainty of this paper’s results is unclear.
- Discussion needs to be reframed to clearly interpret simulation output with respect to model drivers and parameters, while making a connection to real-life processes via referencing robust parameterization based on observational and experimental studies. The interpretation of results would also benefit from a discussion of the N-cycle processes that may be significant for the N cycle response to policy change but are not represented in the DayCent model.
Additional minor concern:
The spatial aspect of the simulations allows for analysis of regional differences within Switzerland, but there is no discussion of such differences.
Specific comments
Title: “Balancing nitrogen use efficiency, losses and soil nitrogen depletion to evaluate agri-environmental performance across spatial scales over 40 years”
Different spatial scales were not discussed in the manuscript, so I suggest changing it to “national scale”.
L338: “Our results also indicate that NUE increases with BNF-derived N and decreases with fertilizer N (Fig. 8A, B). Under present conditions, the type of N input (i.e. BNF or fertilizer) has no significant influence on relative N losses (%Nloss; Fig. 8C, D).”
Most probably, the fact that type of N input affects NUE but does not affect N loss is a consequence of the model structure. A sensitivity analysis could answer this question. Another question is whether BNF-derived N is negatively correlated to fertilizer N. The reasons for these relationships should be made clear to the readers.
L341: “Importantly, %Nloss correlated negatively with soil N change, indicating that reducing N losses is crucial for preventing soil N depletion in agricultural land (Fig. 8E).”
The observation that N loss is negatively correlated to N change is self-evident. It would be more meaningful to compare the relative influence of N loss vs N input on the N change
L354: “Using national-scale simulations evaluated against observational data…”
Quantitative evaluation of simulation results against observational data should be added and referenced here.
L358: “These findings can largely be explained by policy reforms in the 1990s.”
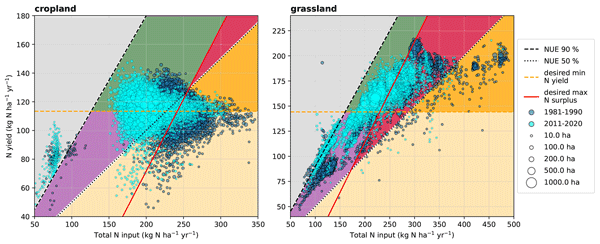
Figure 2C and Supplementary Figure S4A do show a visible change of slope for croplands occurring in the 1990s, but same cannot be claimed about grasslands. Either more evidence is needed to support the policy effect claim for grasslands, or more discussion about the lack of such effect should be added.
L380: “In this study, we noticed a decoupling of yields from fertilizer inputs with increased NUE in both ecosystems between the 1980s and the 2010s, i.e. yields do not exhibit a linear dependence on N input.”
The relationship between N inputs and yields is not something to be noticed in the results – it is a direct consequence of the crop simulation parameters that were input in DayCent, presumably based on the long-term experiments. Therefore, the argument should follow the logic: experiments showed a certain relationship between fertilization and yield -> the model was parameterized based on this relationship -> at the national scale model output showed…(maybe some spatial differences or any added information compared to what already went in the model parametrization).
L388:
“Our modelling results show that N losses decreased only in absolute terms due to lower N inputs, while relative N losses show less significant reductions in croplands and even increased in grasslands (Table 2 and Fig. S4A in Supplementary Materials). Increases of relative N losses in grasslands might be attributed to the unstable N accumulation in soils that causes higher gaseous N emissions resulting from legacy effects (Qian et al., 2025)”
Logically, the reasons for model output can only include processes that are reflected in the model. Is “unstable N accumulation” something that is represented in DayCent and could affect the simulation results? If so, how? The reasoning here may need updating based on the sensitivity analysis.
L403-409:
The N losses in the output can be and should be definitively attributed to certain drivers used in the simulation and then compared to domain knowledge and observational studies which would corroborate or contrast the simulation results.
Overall, this paper shows a promising and innovative approach to national assessments of N balance and long-term policy effects. However, quantitative sensitivity and uncertainty analyses, as well as a clear link between observation, model parametrization, and interpretation of the output are necessary. My recommendation is a major revision.
Citation: https://doi.org/10.5194/egusphere-2026-1287-RC2 - AC2: 'Reply on RC2', Jize Jiang, 18 Jul 2026
Peer review completion


Interactive discussion
Status: closed
-
RC1: 'Comment on egusphere-2026-1287', Zimeng Wang, 18 May 2026
This manuscript uses the Swiss agricultural system as a case study and applies the DayCent biogeochemical model to reconstruct nitrogen budgets for croplands and managed grasslands from 1981 to 2020 at a 1 km × 1 km resolution. The study focuses on evaluating N inputs, N outputs, nitrogen use efficiency, N losses, and soil N balance. The core contribution of the manuscript is that it integrates NUE, N losses, and soil N stock dynamics into a single framework for assessing agri-environmental performance. The authors show that Swiss agri-environmental policy reforms improved nitrogen use efficiency and reduced N losses, while also indicating that cropland soil N stocks may have experienced long-term depletion. This perspective has strong policy relevance and methodological significance.
Specific comments
The title of the manuscript is “Balancing nitrogen use efficiency, losses and soil nitrogen depletion to evaluate agri-environmental performance across spatial scales over 40 years”. Overall, the title is accurate. It captures the three core variables of the study: NUE, N losses, and soil N depletion, and it also reflects the long-term and spatial dimensions of the work. However, one aspect of the title could be further improved. The phrase “across spatial scales” is somewhat broad. The study was actually conducted at the national scale with 1 km × 1 km spatially explicit simulations, rather than comparing multiple spatial scales in a strict sense, such as field, regional, national, or continental scales. Therefore, I suggest that the authors revise the title to make it more precise.
L35: The overall logic of the Introduction is clear, but the background and rationale for the key evaluation indicators could be strengthened. NUE is an important assessment metric in this study, but the Introduction does not provide a sufficiently detailed explanation of this concept. The authors should better justify why NUE was selected as a core indicator for evaluating N balance and N losses.
L15: The term grasslands in this manuscript actually refers to managed meadows, excluding managed pastures and summer pastures. Although this is explained in the Methods and figure legends, for example, “Grasslands in Switzerland are categorised into three major types: 1) meadows, 2) pastures and 3) summer pastures. In this study, we focused on meadows, which are managed for grass production for livestock feed”, the direct use of “grasslands” in the Abstract may lead readers to assume that the study covers all Swiss grasslands. I suggest that the authors define this more clearly when the term first appears in the Abstract.
L93: “Inputs of site-specific soil properties such as soil texture (sand, silt, clay), soil pH and soil organic matter (SOM)”. The main research focus of the manuscript is “Balancing nitrogen use efficiency, losses and soil nitrogen depletion”. However, the model input data do not include any soil N-related indicators, such as TN. If soil N is generated internally by the model, I think the authors should provide a more detailed description of the relevant model processes and initialization.
L95: In the Abstract, the method is described as “high-resolution biogeochemical modelling”. However, in the specific description of Model input data, the 1 km × 1 km high-resolution dataset refers to weather data, while the site-specific soil properties were originally provided at 30 m × 30 m resolution and were then resampled to 1 km × 1 km using the conservative remapping method in Climate Data Operator (CDO). I am not fully convinced about the accuracy of this resampling approach across such a large resolution difference. The authors should provide a more detailed description and justification of this method.
L175: A similar issue applies here. “The total N inputs include organic and synthetic fertilizers, biological N fixation and atmospheric N deposition”. The authors do not clearly describe the source of the N deposition input data. In addition, it is unclear whether the BNF referred to in the manuscript represents ecosystem-level BNF, and whether it includes both plant-associated and soil-based biological nitrogen fixation.
L285: The soil N balance data for grassland in 1981–1990 in Table 2 need to be checked. According to the definition provided in the Methods:
N input=124+57+60+12=253
N output=158+35+24=217
Δsoil N=253−217=36
However, the Δsoil N value reported in the table is 25 kg N ha⁻¹ yr⁻¹. If this is a calculation error, it should be corrected.
L305: In Figures 5 and 6, total N input is expressed in kg N ha⁻¹ yr⁻¹, whereas the other variables are expressed as percentages of total N input. This design is useful, but it may also cause confusion. I suggest that the authors clearly label the units in the figures, for example, “Fertilizer N: % of total N input”. Alternatively, the percentage calculation rules should be explicitly described in the Methods, especially for Δsoil N%.
L435: The Uncertainty section identifies three sources of uncertainty: input data, model parameters and processes, and spatial application of the model. However, the discussion remains mainly qualitative. As this is a model-driven study, I suggest that the authors provide quantitative uncertainty ranges for the key conclusions. In particular, cropland soil N depletion is one of the main findings of this study, and it strongly depends on modelled N loss, especially nitrate leaching. The authors also acknowledge limitations in DayCent’s representation of water movement and NH₃ volatilization, which may affect estimates of leaching and gaseous N losses. For example, the manuscript states that “DayCent lacks a sophisticated scheme for NH3 volatilization, leading to substantially underestimated NH3 fluxes”. I think the authors should add an assessment of uncertainty in N loss and provide uncertainty ranges for soil N balance.
Overall, this manuscript is innovative, particularly in integrating NUE, N losses, and soil N balance into a unified framework for assessing agricultural nitrogen management. The use of high-resolution DayCent simulations to reveal changes in nitrogen cycling following Swiss agri-environmental policy reforms is also valuable. However, the authors need to further strengthen the methodological description and uncertainty analysis, especially regarding soil N depletion. My recommendation is minor revision.
Citation: https://doi.org/10.5194/egusphere-2026-1287-RC1 - AC1: 'Reply on RC1', Jize Jiang, 18 Jul 2026
-
RC2: 'Comment on egusphere-2026-1287', Anonymous Referee #2, 27 Jun 2026
The manuscript provides an assessment of changes in Nitrogen status in Swiss grasslands between 1981 and 2020 as simulated by DayCent model. The authors propose 3 indicators – Nitrogen use efficiency (NUE), N loss, and soil N stock as a comprehensive framework for evaluating N response to changes in agricultural management and policy. The study incorporates a multitude of data sources to deliver spatially explicit modelling of N dynamics over Swiss grasslands. The main findings are: NUE improvement in croplands and grassland mainly due to reduction in N fertilizer application; N loss reduction proportionally to the reduction in N input; and N stock depletion in croplands. The main contribution of this research is the spatially comprehensive assessment of different aspects of N dynamics which provides detailed national picture of long-term results of the policy change.
Since the comprehensive results were obtained entirely through modeling, the validity of the conclusions fully relies on the model formulation and parametrization. In particular, the 3 indicators selected by authors: NUE, N loss, and N stock are a result of a simulation by the DayCent model, therefore their apparent change is not something that was observed in reality, but rather a consequences of the model structure, parameters, and drivers (drivers being based on the observational data). While the authors argue that their findings “highlight the importance of policy intervention for agricultural N management” the link between policy changes, model drivers and/or parameters, and output is not sufficiently established throughout the manuscript.
The authors acknowledge the inherent uncertainty of modeling results and list uncertainty sources it in the discussion. While modelled yields and soil N changes are compared to the observed data (Supplementary Figures S2, S3, S5), no quantitative assessment of modelling error and uncertainty is provided.
Overall, more information is needed for the readers to understand where the results come from and make a conclusion about their robustness. Therefore, I suggest making the following changes to the manuscript:
- Add a more detailed description of how policy reforms of 1990s and changes in farmers’ practices were reflected in the model drivers, i.e. fertilization, crop rotations, tillage, etc.
- Add a sensitivity analysis, illustrating and comparing NUE, N loss and N stock sensitivity in croplands and grasslands to changes in drivers over the course of the simulation: both drivers affected by policy change, and unrelated to policy change – e.g. temperature and moisture regimes. This will illustrate the comparative importance of factors in the model and provide a clear interpretation of simulation results.
- Add a quantitative uncertainty analysis, estimating uncertainty of simulated NUE, N loss and N stock due to uncertainty in parameter estimation. Currently, authors describe parameters as being based on several experimental studies in Switzerland, however, the uncertainty of it, and how it translates into the uncertainty of this paper’s results is unclear.
- Discussion needs to be reframed to clearly interpret simulation output with respect to model drivers and parameters, while making a connection to real-life processes via referencing robust parameterization based on observational and experimental studies. The interpretation of results would also benefit from a discussion of the N-cycle processes that may be significant for the N cycle response to policy change but are not represented in the DayCent model.
Additional minor concern:
The spatial aspect of the simulations allows for analysis of regional differences within Switzerland, but there is no discussion of such differences.
Specific comments
Title: “Balancing nitrogen use efficiency, losses and soil nitrogen depletion to evaluate agri-environmental performance across spatial scales over 40 years”
Different spatial scales were not discussed in the manuscript, so I suggest changing it to “national scale”.
L338: “Our results also indicate that NUE increases with BNF-derived N and decreases with fertilizer N (Fig. 8A, B). Under present conditions, the type of N input (i.e. BNF or fertilizer) has no significant influence on relative N losses (%Nloss; Fig. 8C, D).”
Most probably, the fact that type of N input affects NUE but does not affect N loss is a consequence of the model structure. A sensitivity analysis could answer this question. Another question is whether BNF-derived N is negatively correlated to fertilizer N. The reasons for these relationships should be made clear to the readers.
L341: “Importantly, %Nloss correlated negatively with soil N change, indicating that reducing N losses is crucial for preventing soil N depletion in agricultural land (Fig. 8E).”
The observation that N loss is negatively correlated to N change is self-evident. It would be more meaningful to compare the relative influence of N loss vs N input on the N change
L354: “Using national-scale simulations evaluated against observational data…”
Quantitative evaluation of simulation results against observational data should be added and referenced here.
L358: “These findings can largely be explained by policy reforms in the 1990s.”
Figure 2C and Supplementary Figure S4A do show a visible change of slope for croplands occurring in the 1990s, but same cannot be claimed about grasslands. Either more evidence is needed to support the policy effect claim for grasslands, or more discussion about the lack of such effect should be added.
L380: “In this study, we noticed a decoupling of yields from fertilizer inputs with increased NUE in both ecosystems between the 1980s and the 2010s, i.e. yields do not exhibit a linear dependence on N input.”
The relationship between N inputs and yields is not something to be noticed in the results – it is a direct consequence of the crop simulation parameters that were input in DayCent, presumably based on the long-term experiments. Therefore, the argument should follow the logic: experiments showed a certain relationship between fertilization and yield -> the model was parameterized based on this relationship -> at the national scale model output showed…(maybe some spatial differences or any added information compared to what already went in the model parametrization).
L388:
“Our modelling results show that N losses decreased only in absolute terms due to lower N inputs, while relative N losses show less significant reductions in croplands and even increased in grasslands (Table 2 and Fig. S4A in Supplementary Materials). Increases of relative N losses in grasslands might be attributed to the unstable N accumulation in soils that causes higher gaseous N emissions resulting from legacy effects (Qian et al., 2025)”
Logically, the reasons for model output can only include processes that are reflected in the model. Is “unstable N accumulation” something that is represented in DayCent and could affect the simulation results? If so, how? The reasoning here may need updating based on the sensitivity analysis.
L403-409:
The N losses in the output can be and should be definitively attributed to certain drivers used in the simulation and then compared to domain knowledge and observational studies which would corroborate or contrast the simulation results.
Overall, this paper shows a promising and innovative approach to national assessments of N balance and long-term policy effects. However, quantitative sensitivity and uncertainty analyses, as well as a clear link between observation, model parametrization, and interpretation of the output are necessary. My recommendation is a major revision.
Citation: https://doi.org/10.5194/egusphere-2026-1287-RC2 - AC2: 'Reply on RC2', Jize Jiang, 18 Jul 2026
Peer review completion
Journal article(s) based on this preprint
Data sets
Modelling of nitrogen budgets of Swiss agricultural lands Jize Jiang https://doi.org/10.3929/ethz-c-000788419
Viewed
| HTML | XML | Total | Supplement | BibTeX | EndNote | |
|---|---|---|---|---|---|---|
| 664 | 433 | 75 | 1,172 | 137 | 67 | 79 |
- HTML: 664
- PDF: 433
- XML: 75
- Total: 1,172
- Supplement: 137
- BibTeX: 67
- EndNote: 79
Viewed (geographical distribution)
| Country | # | Views | % |
|---|
| Total: | 0 |
| HTML: | 0 |
| PDF: | 0 |
| XML: | 0 |
- 1

Lenny H. E. Winkel
Chloé Wüst-Galley
Daniel Bretscher
Magdalena Necpalova
Andrea Stenke
Johan Six
The requested preprint has a corresponding peer-reviewed final revised paper. You are encouraged to refer to the final revised version.
- Preprint
(10035 KB) - Metadata XML
-
Supplement
(4626 KB) - BibTeX
- EndNote
- Final revised paper
This manuscript uses the Swiss agricultural system as a case study and applies the DayCent biogeochemical model to reconstruct nitrogen budgets for croplands and managed grasslands from 1981 to 2020 at a 1 km × 1 km resolution. The study focuses on evaluating N inputs, N outputs, nitrogen use efficiency, N losses, and soil N balance. The core contribution of the manuscript is that it integrates NUE, N losses, and soil N stock dynamics into a single framework for assessing agri-environmental performance. The authors show that Swiss agri-environmental policy reforms improved nitrogen use efficiency and reduced N losses, while also indicating that cropland soil N stocks may have experienced long-term depletion. This perspective has strong policy relevance and methodological significance.
Specific comments
The title of the manuscript is “Balancing nitrogen use efficiency, losses and soil nitrogen depletion to evaluate agri-environmental performance across spatial scales over 40 years”. Overall, the title is accurate. It captures the three core variables of the study: NUE, N losses, and soil N depletion, and it also reflects the long-term and spatial dimensions of the work. However, one aspect of the title could be further improved. The phrase “across spatial scales” is somewhat broad. The study was actually conducted at the national scale with 1 km × 1 km spatially explicit simulations, rather than comparing multiple spatial scales in a strict sense, such as field, regional, national, or continental scales. Therefore, I suggest that the authors revise the title to make it more precise.
L35: The overall logic of the Introduction is clear, but the background and rationale for the key evaluation indicators could be strengthened. NUE is an important assessment metric in this study, but the Introduction does not provide a sufficiently detailed explanation of this concept. The authors should better justify why NUE was selected as a core indicator for evaluating N balance and N losses.
L15: The term grasslands in this manuscript actually refers to managed meadows, excluding managed pastures and summer pastures. Although this is explained in the Methods and figure legends, for example, “Grasslands in Switzerland are categorised into three major types: 1) meadows, 2) pastures and 3) summer pastures. In this study, we focused on meadows, which are managed for grass production for livestock feed”, the direct use of “grasslands” in the Abstract may lead readers to assume that the study covers all Swiss grasslands. I suggest that the authors define this more clearly when the term first appears in the Abstract.
L93: “Inputs of site-specific soil properties such as soil texture (sand, silt, clay), soil pH and soil organic matter (SOM)”. The main research focus of the manuscript is “Balancing nitrogen use efficiency, losses and soil nitrogen depletion”. However, the model input data do not include any soil N-related indicators, such as TN. If soil N is generated internally by the model, I think the authors should provide a more detailed description of the relevant model processes and initialization.
L95: In the Abstract, the method is described as “high-resolution biogeochemical modelling”. However, in the specific description of Model input data, the 1 km × 1 km high-resolution dataset refers to weather data, while the site-specific soil properties were originally provided at 30 m × 30 m resolution and were then resampled to 1 km × 1 km using the conservative remapping method in Climate Data Operator (CDO). I am not fully convinced about the accuracy of this resampling approach across such a large resolution difference. The authors should provide a more detailed description and justification of this method.
L175: A similar issue applies here. “The total N inputs include organic and synthetic fertilizers, biological N fixation and atmospheric N deposition”. The authors do not clearly describe the source of the N deposition input data. In addition, it is unclear whether the BNF referred to in the manuscript represents ecosystem-level BNF, and whether it includes both plant-associated and soil-based biological nitrogen fixation.
L285: The soil N balance data for grassland in 1981–1990 in Table 2 need to be checked. According to the definition provided in the Methods:
N input=124+57+60+12=253
N output=158+35+24=217
Δsoil N=253−217=36
However, the Δsoil N value reported in the table is 25 kg N ha⁻¹ yr⁻¹. If this is a calculation error, it should be corrected.
L305: In Figures 5 and 6, total N input is expressed in kg N ha⁻¹ yr⁻¹, whereas the other variables are expressed as percentages of total N input. This design is useful, but it may also cause confusion. I suggest that the authors clearly label the units in the figures, for example, “Fertilizer N: % of total N input”. Alternatively, the percentage calculation rules should be explicitly described in the Methods, especially for Δsoil N%.
L435: The Uncertainty section identifies three sources of uncertainty: input data, model parameters and processes, and spatial application of the model. However, the discussion remains mainly qualitative. As this is a model-driven study, I suggest that the authors provide quantitative uncertainty ranges for the key conclusions. In particular, cropland soil N depletion is one of the main findings of this study, and it strongly depends on modelled N loss, especially nitrate leaching. The authors also acknowledge limitations in DayCent’s representation of water movement and NH₃ volatilization, which may affect estimates of leaching and gaseous N losses. For example, the manuscript states that “DayCent lacks a sophisticated scheme for NH3 volatilization, leading to substantially underestimated NH3 fluxes”. I think the authors should add an assessment of uncertainty in N loss and provide uncertainty ranges for soil N balance.
Overall, this manuscript is innovative, particularly in integrating NUE, N losses, and soil N balance into a unified framework for assessing agricultural nitrogen management. The use of high-resolution DayCent simulations to reveal changes in nitrogen cycling following Swiss agri-environmental policy reforms is also valuable. However, the authors need to further strengthen the methodological description and uncertainty analysis, especially regarding soil N depletion. My recommendation is minor revision.