
the Creative Commons Attribution 4.0 License.
the Creative Commons Attribution 4.0 License.
 | 28 Jan 2026
Tropical belt expansion and its impacts on climate variability in the Mediterranean from 1980 to 2022
Abstract. The Mediterranean region's climatic parameters are undergoing substantial changes driven by climate change and tropical belt expansion. This paper explores the long-term variability of climatic parameters over the Mediterranean region and their relationship with tropical belt expansion by employing observational and reanalysis data from January 1980 to December 2022 through multiple approaches including correlation, linear regression, singular value decomposition (SVD), wavelet coherence (WTC), and principal component analysis (PCA). The lapse rate tropopause height (LRT-H) exhibits upward trends of approximately 80.58 m/dec. Concurrently, the tropical belt shows poleward expansion of approximately 0.14 °/dec and 0.27 °/dec from both applied methods. The tropical edge latitudes (TELs) of both applied approaches are in phase and have a strong positive correlation with LRT-H, surface temperature, and tropospheric temperature while being of strong negative correlation and out of phase with precipitation. However, there is no substantial correlation for the Standardized Precipitation Evapotranspiration Index (SPEI) with TELs or other climatic parameters. The results of SVD analysis depict that the surface temperature and lower tropospheric temperature (TRP-1) have evident coupling with the TELs in the eastern Mediterranean. Furthermore, surface temperature and TRP-1 have significant increasing trends, which are abundant in the eastern and northern Mediterranean. On the other hand, both precipitation and SPEI exhibit downward trends. Over the Mediterranean, an apparent spatial and temporal variation of climatic parameters is observed. The results confirm the linkage between climatic parameters' variability, coherence, and covariability with the TELs variability patterns over the study area, especially in the eastern Mediterranean region.
-
Notice on discussion status
The requested preprint has a corresponding peer-reviewed final revised paper. You are encouraged to refer to the final revised version.
-
Preprint
(2419 KB)
-
The requested preprint has a corresponding peer-reviewed final revised paper. You are encouraged to refer to the final revised version.
- Preprint
(2419 KB) - Metadata XML
- BibTeX
- EndNote
- Final revised paper


Journal article(s) based on this preprint
Interactive discussion
Status: closed
-
RC1: 'Comment on egusphere-2025-6521', Anonymous Referee #1, 20 Feb 2026
- AC1: 'Reply on RC1', Mohamed Darrag, 20 Apr 2026
-
RC2: 'Comment on egusphere-2025-6521', Anonymous Referee #2, 22 Feb 2026
This paper investigates the seasonality and annual trend of the tropical belt edge over Mediterranean, giving insights on the local impact of climate change. However, the analyzed data are interpolated from pressure-level ERA5 to a 100m vertical resolution, which requires further justification. The writing also needs significant improvement, as there are many repetitions throughout the manuscript.
Major concerns:
- In session 2.3, pressure-level ERA5 data are interpreted to 100m resolution to calculate the tropopause. I’m wondering how accurate the interpolated data are. The cited paper (Hindley et al., 2015) used COSMIC data, which has a much higher vertical resolution than pressure-level ERA5. Have you tried using 137 model level ERA5 data and see if there is any difference in calculating the tropopause?
- “TPD” and “TPG” have very high correlation (0.9 shown in figure 3) and they showed very similar results. Session 3.2 have a lot of descriptions about what it’s shown in the figures from both methods. Figure 5 and Figure 6 are very similar. Left and right columns in Figure 7 are similar. Figure 8 and Figure 9 are similar. It looks redundant to me to include the discussion for both methods.
- There are many abbreviations throughout the paper. Reducing them may improve readability.
Line-by-line comments:
Lines 24-25: “both applied methods” is confusing because the methods are not stated earlier. I suggest revising this sentence to something like “the tropical belt shows poleward expansion ranging approximately between 0.14 °/dec and 0.27 °/dec.”
Line 25: “of both applied approaches” seems redundant.
Line 40: “climate change has been documented at a magnitude that exceeds global averages” is very broad. Does climate change here means temperature, precipitation, or something else?
I notice this sentence is rephrasing “As mentioned before, Mediterranean climate change has been observed at a magnitude exceeding global means, despite the fact that the emission of greenhouse gases (GHGs) in Mediterranean countries lie at relatively low levels” from the reference. In this paper, this sentence is missing context. I’m not sure if this sentence is a good one to put at the beginning.
Lines 47-48: This sentence repeated “the Mediterranean region has experienced significant shifts of climate in the past” in Line 45.
Lines 59-69: There is no subject in this sentence. A suggestion is “In astronomy and cartography, the tropical boundaries are at latitudes of ~23.5⁰ north and south”.
Lines 63-64: A better flow is needed. The previous sentence is about the seasonal change and “Tropical belt expansion” in this sentence is due to climate forcing. A suggestion is adding “Under climate change,” at the beginning of the sentence.
Lines 66-67: “sea-surface temperature (SST) variability over the tropics” and “ absorbing aerosols hemispheric asymmetry” don’t appear to be the changes driven by the climate change.
Lines 71-73: “even slight expansion of the tropical belt could cause substantial changes in the global climate system” repeats “The expansion of the tropics could cause substantial changes in the global climate system”.
Lines 76-77: I suggest revising “one of the most vulnerable regions to the effects of climate change” to “one of the most vulnerable regions affected by climate change”.
Line 79: “increasing” to “being”.
Line 82: Add “continue to” before “rise”.
Lines 98-99: “This accelerated…and biodiversity” repeats Lines 88-89.
Lines 115-131: Most of session 2.1 repeats the content already shown in the introduction. Please consider shortening or deleting session 2.1.
Lines 180-181: The captions in Figures are repeated in the test. Same in Lines 192-193.
Lines 181-183: Previous literature also shows an increasing trend, but the values presented in this paper are much larger.
Line 185: Add “in LRT-T also” after “our findings”.
Line 189: “consistent with earlier research” appears three times in this paragraph. Please consider revising to avoid repetition.
Line 207: “most of the grid points” is vague. Please consider stippling the regions where p<0.05. Same for line 213, line 510, line 530, line 570.
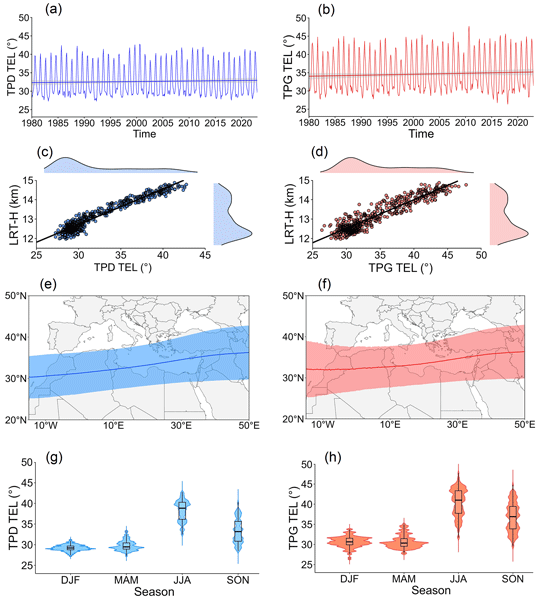
Figure 2: Repetition in the caption. For example, “Monthly time series of the TPD TEL method over the Mediterranean region for the period January 1980 to December 2022 (a) and monthly time series of the TPG TEL method over the Mediterranean region for the period January 1980 to December 2022 (b).” can be revised as “Monthly time series of the (a) TPD TEL method and (b) TPG TEL method over the Mediterranean region for the period January 1980 to December 2022”.
Line 244: “major tropical systems” is vague.
Line 250: Why stronger land-sea contrast leads to the following statement “resulting in higher TEL values in this region”?
Lines 283-284: “even minor expansion would have significant consequences” is repetition.
Figure 3: It will be more straightforward to put the correlation numbers on the top right panels.
Figure 10: Repetition in the description of panels.
Citation: https://doi.org/10.5194/egusphere-2025-6521-RC2 - AC2: 'Reply on RC2', Mohamed Darrag, 20 Apr 2026
Peer review completion


Interactive discussion
Status: closed
-
RC1: 'Comment on egusphere-2025-6521', Anonymous Referee #1, 20 Feb 2026
This study investigates the connection of the tropical edge latitude towards climatic parameters, such as temperature, precipitation, and SPEI. The authors hereby focus on the Mediterranean as an important region, which is undergoing significant changes with ongoing anthropogenic climate change. Utilizing ERA5 reanalysis data and some observational data, the authors explore multiple statistical methods. Overall, this is a comprehensive and detailed study. However, the writing and figures require some refinements, as outlined below, this would significantly improve the clarity and readability of the paper.
General comments
- Throughout the manuscript, but especially in the figure captions the investigation period “over the period January 1980 to December 2022” is over-repeated. For example in the caption of Fig. 1 it is stated 3-times, and in the caption of Fig. 2 it is mentioned 4-times. Reduce most of the repetitions, particularly in figure captions. Moreover in the figures when time series are shown, it is not necessary to repeat the investigation period in the axis labelling – it is comprehensible from the time-axis and it is also referred to in the text. Rather state the unit e.g., “Time (years)”.
- The mention of seasons is not consistent e.g., in Lines 196-201 seasons are stated e.g., as “summer”, “winter”, whereas in Lines 265-276 e.g., “Summer (JJA)”, “Winter (DJF)”, and in Line 278 as “Summer”, “Winter”. I suggest to introduce the seasons in the beginning what is meant with e.g., “summer” or use the short form e.g., “JJA” throughout the text. It does not need to be mentioned every time. Also, seasons are never capitalized.
- The authors state for multiple plots that “statistically significant trends at p < 0.05 at most of the grid points”, could you add some hatching in the respective plots to indicate the grid points for which this statement valid?
- The authors should be more consistent with the formatting of their figures e.g., where the labels of the sub panels are located – sometimes they are at the top left whereas in other figures they are at the top right. Also the font size of the axis labels needs to be increased in all figures. And it should be considered to add coastlines in map plots for better geographical orientation.
- Use evenly distributed ticks for the colorbars and when possible round numbers in all the figures. This would greatly improve plot readability. Also, when using diverging colorbars, the authors should purposefully set the center, for example at zero, so that the colors are diverging from negative to positive values (e.g., Fig. 11d: Negative values are shown in teal, yellow and in brown, the same brown is then used for positive trend results. This makes the plot very difficult to interpret.)
- Be consistent with the post comma digits (significant digits) e.g., Line 268 its 38.83°, Line 269 29.2° and Line 275 41°. Another example is Line 273 “-0.07 ± 0.001”.
- Throughout the manuscript there are many instances where the term “Figure” is used in text, although it should be “Fig.” (e.g., Line 211 “Figure 1e” should be “Fig. 1e”).
- Some references are missing the DOI, please check.
Specific comments
Line 182: consider adding the period investigated from the other authors
Figure 2:
- “TEL TPD” and “TEL TPG” should be “TPD TEL” and “TPG TEL”, check for consistency
- In sub panels (c) and (d) remove the redundant tick marks that make it look like a barcode, this is what the distribution function is showing. Also, use the same tick marks for these two sub panels (i.e., x-axis: 25, 30, 35, 40, 45, 50).
Line 261 & Line 262: The abbreviation for standard deviation “SD” has already been introduced in Line 203.
Figure 3 & Figure 4:
- Be consistent with the labelling, replace TEL-D with TPD TEL and TEL-G with TPG TEL.
Line 403-405: The figure caption is unnecessary and the repetition can be misleading. Refer to the caption of Figure 5. Suggestion: “As in Fig. 5, but for TPG TEL.”
Figure 5 & Figure 6:
- “TEL TPD” and “TEL TPG” should be “TPD TEL” and “TPG TEL”, check for consistency
- Add x-axis labelling and the respective units
Figure 7:
- I suggest to have a uniform color range, so one can see how TPD TEL and TPG TEL correlate with the individual climatic parameters. Like this they are very hard to compare.
- Consider explaining in the text why you are now also looking at TRP-1 and TRP-2. This seems like an interesting approach, but why was it not included in the other tests and figures?
Figure 8 & Figure 9:
- As for Fig. 7, consider using a uniform range for the colorbar of the individual sub panels.
Line 496-500: Remove the repetitive figure caption. Refer to the caption of Figure 8. Suggestion: “As in Fig. 8, but for TPG TEL.”
Lines 552-560: This caption is very repetitive – please improve it.
Line 616: Consider discussing the lack of a significant relationship of SPEI.
Technical corrections
Line 39: “greenhouse gases (GHGs) emissions” should be “greenhouse gas (GHG) emissions”
Line 59: it looks like a upper case zero not a “°”
Line 69: add a “the” before “Hadley circulation”
Line 270: remove hyphen between TPD-TEL
Line 541, Line 544: “45° N-50° N” should be “45° N to 50° N”
Line 546: “20° N-30° N” should be “20° N to 30° N”
Line 595: “GHGs” should be “GHG”
Citation: https://doi.org/10.5194/egusphere-2025-6521-RC1 - AC1: 'Reply on RC1', Mohamed Darrag, 20 Apr 2026
-
RC2: 'Comment on egusphere-2025-6521', Anonymous Referee #2, 22 Feb 2026
This paper investigates the seasonality and annual trend of the tropical belt edge over Mediterranean, giving insights on the local impact of climate change. However, the analyzed data are interpolated from pressure-level ERA5 to a 100m vertical resolution, which requires further justification. The writing also needs significant improvement, as there are many repetitions throughout the manuscript.
Major concerns:
- In session 2.3, pressure-level ERA5 data are interpreted to 100m resolution to calculate the tropopause. I’m wondering how accurate the interpolated data are. The cited paper (Hindley et al., 2015) used COSMIC data, which has a much higher vertical resolution than pressure-level ERA5. Have you tried using 137 model level ERA5 data and see if there is any difference in calculating the tropopause?
- “TPD” and “TPG” have very high correlation (0.9 shown in figure 3) and they showed very similar results. Session 3.2 have a lot of descriptions about what it’s shown in the figures from both methods. Figure 5 and Figure 6 are very similar. Left and right columns in Figure 7 are similar. Figure 8 and Figure 9 are similar. It looks redundant to me to include the discussion for both methods.
- There are many abbreviations throughout the paper. Reducing them may improve readability.
Line-by-line comments:
Lines 24-25: “both applied methods” is confusing because the methods are not stated earlier. I suggest revising this sentence to something like “the tropical belt shows poleward expansion ranging approximately between 0.14 °/dec and 0.27 °/dec.”
Line 25: “of both applied approaches” seems redundant.
Line 40: “climate change has been documented at a magnitude that exceeds global averages” is very broad. Does climate change here means temperature, precipitation, or something else?
I notice this sentence is rephrasing “As mentioned before, Mediterranean climate change has been observed at a magnitude exceeding global means, despite the fact that the emission of greenhouse gases (GHGs) in Mediterranean countries lie at relatively low levels” from the reference. In this paper, this sentence is missing context. I’m not sure if this sentence is a good one to put at the beginning.
Lines 47-48: This sentence repeated “the Mediterranean region has experienced significant shifts of climate in the past” in Line 45.
Lines 59-69: There is no subject in this sentence. A suggestion is “In astronomy and cartography, the tropical boundaries are at latitudes of ~23.5⁰ north and south”.
Lines 63-64: A better flow is needed. The previous sentence is about the seasonal change and “Tropical belt expansion” in this sentence is due to climate forcing. A suggestion is adding “Under climate change,” at the beginning of the sentence.
Lines 66-67: “sea-surface temperature (SST) variability over the tropics” and “ absorbing aerosols hemispheric asymmetry” don’t appear to be the changes driven by the climate change.
Lines 71-73: “even slight expansion of the tropical belt could cause substantial changes in the global climate system” repeats “The expansion of the tropics could cause substantial changes in the global climate system”.
Lines 76-77: I suggest revising “one of the most vulnerable regions to the effects of climate change” to “one of the most vulnerable regions affected by climate change”.
Line 79: “increasing” to “being”.
Line 82: Add “continue to” before “rise”.
Lines 98-99: “This accelerated…and biodiversity” repeats Lines 88-89.
Lines 115-131: Most of session 2.1 repeats the content already shown in the introduction. Please consider shortening or deleting session 2.1.
Lines 180-181: The captions in Figures are repeated in the test. Same in Lines 192-193.
Lines 181-183: Previous literature also shows an increasing trend, but the values presented in this paper are much larger.
Line 185: Add “in LRT-T also” after “our findings”.
Line 189: “consistent with earlier research” appears three times in this paragraph. Please consider revising to avoid repetition.
Line 207: “most of the grid points” is vague. Please consider stippling the regions where p<0.05. Same for line 213, line 510, line 530, line 570.
Figure 2: Repetition in the caption. For example, “Monthly time series of the TPD TEL method over the Mediterranean region for the period January 1980 to December 2022 (a) and monthly time series of the TPG TEL method over the Mediterranean region for the period January 1980 to December 2022 (b).” can be revised as “Monthly time series of the (a) TPD TEL method and (b) TPG TEL method over the Mediterranean region for the period January 1980 to December 2022”.
Line 244: “major tropical systems” is vague.
Line 250: Why stronger land-sea contrast leads to the following statement “resulting in higher TEL values in this region”?
Lines 283-284: “even minor expansion would have significant consequences” is repetition.
Figure 3: It will be more straightforward to put the correlation numbers on the top right panels.
Figure 10: Repetition in the description of panels.
Citation: https://doi.org/10.5194/egusphere-2025-6521-RC2 - AC2: 'Reply on RC2', Mohamed Darrag, 20 Apr 2026
Peer review completion
Journal article(s) based on this preprint
Viewed
| HTML | XML | Total | BibTeX | EndNote | |
|---|---|---|---|---|---|
| 1,244 | 501 | 131 | 1,876 | 124 | 163 |
- HTML: 1,244
- PDF: 501
- XML: 131
- Total: 1,876
- BibTeX: 124
- EndNote: 163
Viewed (geographical distribution)
| Country | # | Views | % |
|---|
| Total: | 0 |
| HTML: | 0 |
| PDF: | 0 |
| XML: | 0 |
- 1
Mohamed Darrag

Andres Calabia
Aalaa Samy
Ivan Radevski
Ali M. Radwan
The requested preprint has a corresponding peer-reviewed final revised paper. You are encouraged to refer to the final revised version.
- Preprint
(2419 KB) - Metadata XML
This study investigates the connection of the tropical edge latitude towards climatic parameters, such as temperature, precipitation, and SPEI. The authors hereby focus on the Mediterranean as an important region, which is undergoing significant changes with ongoing anthropogenic climate change. Utilizing ERA5 reanalysis data and some observational data, the authors explore multiple statistical methods. Overall, this is a comprehensive and detailed study. However, the writing and figures require some refinements, as outlined below, this would significantly improve the clarity and readability of the paper.
General comments
Specific comments
Line 182: consider adding the period investigated from the other authors
Figure 2:
Line 261 & Line 262: The abbreviation for standard deviation “SD” has already been introduced in Line 203.
Figure 3 & Figure 4:
Line 403-405: The figure caption is unnecessary and the repetition can be misleading. Refer to the caption of Figure 5. Suggestion: “As in Fig. 5, but for TPG TEL.”
Figure 5 & Figure 6:
Figure 7:
Figure 8 & Figure 9:
Line 496-500: Remove the repetitive figure caption. Refer to the caption of Figure 8. Suggestion: “As in Fig. 8, but for TPG TEL.”
Lines 552-560: This caption is very repetitive – please improve it.
Line 616: Consider discussing the lack of a significant relationship of SPEI.
Technical corrections
Line 39: “greenhouse gases (GHGs) emissions” should be “greenhouse gas (GHG) emissions”
Line 59: it looks like a upper case zero not a “°”
Line 69: add a “the” before “Hadley circulation”
Line 270: remove hyphen between TPD-TEL
Line 541, Line 544: “45° N-50° N” should be “45° N to 50° N”
Line 546: “20° N-30° N” should be “20° N to 30° N”
Line 595: “GHGs” should be “GHG”