
the Creative Commons Attribution 4.0 License.
the Creative Commons Attribution 4.0 License.
 | 30 Dec 2025
Alkaline dust deposition to foliage surfaces likely enhances the dry deposition velocity of SO2: An investigation in the Alberta Oil-Sands Region using the GEM-MACH air-quality model
Abstract. We examine the potential impact of alkaline particle deposition on foliage and its influence on sulphur dioxide dry deposition velocities, using a new theoretical development, a high resolution air-quality model, and comparisons to observations. Our study domain encompasses the Athabasca Oil Sands Region, an industrial area where base cation-bearing fugitive dust from open-pit mining coexists with elevated SO2 emissions from large stacks. Our pH-modulated dry deposition scheme links thin aqueous films on foliage to local chemical conditions, including alkaline dust accumulation. We present the mechanism's theoretical basis, along with a simplified algorithm predicting foliage water pH and linked to SO2 deposition velocities.
We predict enhanced SO2 deposition, due to increased leaf surface pH from dust co-deposition near major dust sources, often by more than 1 cm s⁻¹. These result in dry deposition fluxes 2.5 to 10 times greater than in the absence of these effects – consistent with estimates from aircraft studies. The enhanced deposition reduces surface SO2 concentrations by up to 60% near sources, improves agreement with continuous monitoring data, and reduces normalized mean bias at several stations. Taylor diagram statistics show improved model temporal variability performance. Further from sources of base-cation-containing dust, aqueous films on foliage remain acidic, reducing SO2 deposition velocity and increasing concentrations.
We make specific recommendations for new observation data which would reduce formulation uncertainties. The findings have broad implications for global SO2 budgets, given the significant role of wind-blown mineral dust in influencing atmospheric acidity and trace gas removal.
-
Notice on discussion status
The requested preprint has a corresponding peer-reviewed final revised paper. You are encouraged to refer to the final revised version.
-
Preprint
(5111 KB)
-
Supplement
(3071 KB)
-
The requested preprint has a corresponding peer-reviewed final revised paper. You are encouraged to refer to the final revised version.
- Preprint
(5111 KB) - Metadata XML
-
Supplement
(3071 KB) - BibTeX
- EndNote
- Final revised paper


Journal article(s) based on this preprint
Interactive discussion
Status: closed
- RC1: 'Comment on egusphere-2025-6392', Anonymous Referee #1, 04 Feb 2026
-
RC2: 'Comment on egusphere-2025-6392', Anonymous Referee #2, 07 Apr 2026
General comments
The manuscript entitled “Alkaline dust deposition to foliage surfaces likely enhances the dry deposition velocity of SO₂: An investigation in the Alberta Oil-Sands Region using the GEM-MACH air-quality model” by Stefan Miller et al. investigates the effect of alkaline dust deposition on SO₂ dry deposition velocity using the GEM-MACH model. This detailed examination in the AOSR contributes to our understanding of the role of deposition processes, and I am generally inclined to recommend publication of this manuscript. I would, however, encourage the authors to address the following specific points, particularly those related to presentation quality.
Major comment
- With respect to the analysis of deposition, the deposition flux (Fig. 13) is an important quantity, and I fully agree with the authors’ choice to emphasize this in their analysis. However, a limitation of the current approach is that the flux is presented as a mean field over the study period (i.e., monthly averages in this manuscript). To better capture the variability of deposition, I suggest also examining the total deposition amount accumulated over the target period (e.g., monthly totals). This perspective may reveal different characteristics compared to the averaged fields and could highlight additional impacts in the sensitivity experiments.
Specific comments
- Line 269: To avoid confusion, it would be helpful to note explicitly that rac is discussed later and is not introduced here (see eqs. (3)–(8)).
- 3: The colored corners (light blue and light green) in each panel are unclear. Please explain what these colors represent in the figure or caption.
- Line 605: Please clarify how the minimum value of the multiplication coefficient of 0.5 by TK was determined.
- Lines 643–654: Please clarify the actual calculation method used for the charge balance. Is HETP applied in the “Base Case” simulation? This section feels somewhat long; it may be helpful to summarize the key points in a table (e.g., revising or expanding Table 2) for clarity.
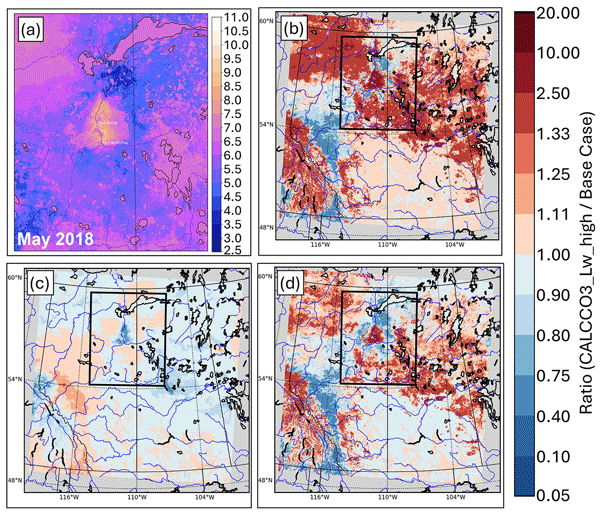
- 5: It would be helpful to label the top and bottom panels explicitly as “May 2018” and “June 2018,” respectively, because the two panels appear very similar at first glance.
- Lines 759–779: The discussion of “charge_adj_Lw_low” (#3 in Table 2) and “charge_adj_Lw_high” (#4 in Table 2) is somewhat difficult to follow. Consider adding a figure analogous to Fig. 5 to illustrate these cases more clearly.
- 6: Please unify the x-axis range for “Leaf pH” so that (a) can be directly compared with (b), and (c) with (d).
- Line 947: The discussion based on NMB can also be inferred from Fig. 12. I therefore recommend explicitly citing Fig. 12 together with Fig. 11 here. This cross-reference will be helpful for readers.
Citation: https://doi.org/10.5194/egusphere-2025-6392-RC2 - AC1: 'Comment on egusphere-2025-6392: Response to Reviewers' Comments', Paul Makar, 29 Apr 2026
Peer review completion


Interactive discussion
Status: closed
-
RC1: 'Comment on egusphere-2025-6392', Anonymous Referee #1, 04 Feb 2026
Review: Miller et al., 2026
“Alkaline dust deposition to foliage surfaces likely enhances the dry deposition velocity of SO2: An investigation in the Alberta Oil-Sands Region using the GEM-MACH air-quality model”
Summary
This manuscript describes work to improve process representation of SO2 dry deposition in the GEM-MACH regional air quality model. Dry deposition is an important process to capture in chemistry transport models, but process realism is difficult to achieve due the sub-grid scale nature of the contributing processes. The authors address this problem by targeting dry deposition on wet vegetation surfaces. They expand GEM-MACH’s dry deposition mechanism to include a scheme that calculates pH on the thin films of water that accumulate on foliage. They hypothesize that this will improve SO2 dry deposition in regions like the Athabasca Oil Sands, where high atmospheric concentrations of acidic and alkaline gases and aerosols can influence foliage pH, and therefore deposition of acidic and basic gases. The authors find that GEM-MACH can better predict SO2 dry deposition velocities in the Athabasca Oil Sands Region when this scheme is included, although the impacts on atmospheric SO2 concentrations is small.
Overall, the manuscript is well written in clear language. However, I think that the manuscript is over-long relative to the limited scope of the results. It is unclear what the wider impacts, if any, the new foliage water pH scheme would have on e.g. deposition velocities of other acidic and basic gases like NH3 or HNO3 and what impact it might have a dusty or wildfire affected region. While I recommend the manuscript for publication, I have some General and Technical comments below that should be addressed first.
General Comments
- Overall the manuscript is long relative to the scope of the results presented in Section5.2-5.4. In particular, I think that the length of Sections 3 and 4 detracts from the study’s results. I suggest that the technical details of the GEM-MACH dry deposition scheme presented in Sections 3 and 4 are moved to the Supplementary Material (or possibly as an Appendix). The manuscript could then focus on relevant updates to GEM-MACH’s dry deposition scheme since Makar et al., 2018 and the HETP scheme implemented to calculate foliage pH.
- The manuscript could also be better focused by either summarizing Section 5.1 or moving it to the supplementary section. The author’s find that: “This analysis underscores the role of 𝐿𝑤 𝑇ℎ𝑟𝑒𝑠 in determining the frequency and magnitude of high 𝑉𝑑SO2 associated with elevated foliage pH is relatively minor.” (L818-), which is useful, but including the comparison between the two Lw Thres schemes and the change_adj scheme detracts from the more interesting results from the more suitable CALCCO3_Lw_high scheme shown in Sections 5.2-5.4.
- I would also suggest that Section 5.4 follows Section 5.2 so that the impact of the interactive foliage pH on SO2 deposition velocity to deposition flux to atmospheric SO2 concentrations can be ‘traced’ along the dry deposition pathway.
- It is difficult for the reader to interpret the spatial impact of the new foliage pH scheme on VdSO2, SO2 dry deposition flux and SO2 concentrations because the spatial plots for these quantities are shown in Figures 7, 8, 10 and 13. Would it be possible to combine some of these spatial plots to illustrate the cascading impact of the new foliage pH scheme. For example by plotting a single month (or multi monthly mean) for VdSO2, SO2 dry deposition flux and SO2 concentrations, possibly using multi-monthly means?
- There are instances where the text could be edited to eliminate repetition. For example L704-710 repetes details from Section 2. This would help to reduce the length of the manuscript.
- In addition, the manuscript text repeats the figure captions in many cases, which is not necessary.
Technical Comments
Abstract
- L37-38: Typo in “We examine here the potential the simultaneous…”
Suggest “We examine here the potential for simultaneous…”
Introduction
- Consider using sub sections (e.g., by key process - foliage surface pH, canopy particle deposition, leaf water dynamics, and dust-gas interaction) to break up the text and guide the reader through.
Section 2.2
- Are the observations from Hayden et al., (2021) and Gordon et al., (2023) those that are used in Figure 9 (Oski-otin, YAJP and DWEF)? It would be useful to include these sites on Figure 1 along with a short description of the site characteristics in the text.
Section 3 – Dry deposition algorithms
- L299: 𝐻𝑠𝑝 ∗ ≈ 105 M atm-1.
Here, is “M” mol L-1?
- L340: “To obtain 𝐻SO2𝑛 ∗ = 𝐻SO2 ∗ 𝑛 (= 105 M atm-1 340 ) as…” Should this be “To obtain 𝐻SO2∗ = 𝐻SO2 ∗ 𝑛 (= 105 M atm-1 340 ) as…” ?
Section 4 - simulating foliage pH
- A short introductory sentence or two to describe the calculations necessary to simulate the foliage pH would be helpful here.
- L595: “below”
Suggest pointing to the specific section/subsection.
Section 5.1
- L733-737: Essentially repeats Figure 5 caption.
- Figure 5: Masking out the ocean would help the reader interpret Figures a, b, d and e (which is mislabelled ‘d’)
- L786-789 and L798-801: This information should just be in the Figure 6 caption.
- Figure 6: Could (b) and (d) be oriented the same way as (a) and (c)? Also, the text on the shaded bars is very difficult to read. It would also be helpful if (b) and (d) used the same scale for the right y axis.
- L825-829 – Point to the figures that are being discussed.
Section 5.2
- L857-861: Information should just be in the Figure 8 caption.
- L875-880: If the statement beginning “As the pH increases above 9.0….” is referencing Figure 2, please cite Figure 2 in the text.
- L889-893: Should only be included in the Figure 9 caption.
- L889-921: I think this text should be split into a separate subsection. Something like “5.X Comparison of modelled vdSO2 with surface monitoring network observations”
Section 5.3
Figures 11 and 12 show that there are only small changes in SO2 concentrations between the base and CALCCO3_Lw_high simulations at most of the sites and only five sites where CALCCO3_Lw_high substantially reduces bias against the observations. This is despite the better agreement between CALCCO3_Lw_high and observed VdSO2 shown in Figure 9. Is there anything linking the five WBEA sites where CALCCO3_Lw_high reduces bias against the observations and Oski-otin, YAJP and DWEF? E.g. location or vegetation type?
I also found Figure 12 hard to interpret due to the small font and symbol sizes. Perhaps the authors could consider i) including just Figure 12b (the results from June that are also presented in Figure 11) and ii) summarizing the results from Figures 12a, c and d?
Can the authors suggest a reason/s why CALCCO3_Lw_high reduces bias against the atmospheric SO2 observations at some sites and months, but not others? Are these sites linked by location or vegetation type? Further, is there anything linking the five WBEA sites where CALCCO3_Lw_high reduces bias against the observations and Oski-otin, YAJP and DWEF? Again, location or vegetation type?
- L942-943: Should only be included in the Figure 11 caption.
- L947-949: Please consider tabulating these results.
- Are the results from Hayden et al., 2021 comparable with the results presented here?
- L972:979: Should only be included in the Figure 12 caption.
- L991-1002: Could the model’s wet deposition parameterization also be a source of uncertainty?
Citation: https://doi.org/10.5194/egusphere-2025-6392-RC1 -
RC2: 'Comment on egusphere-2025-6392', Anonymous Referee #2, 07 Apr 2026
General comments
The manuscript entitled “Alkaline dust deposition to foliage surfaces likely enhances the dry deposition velocity of SO₂: An investigation in the Alberta Oil-Sands Region using the GEM-MACH air-quality model” by Stefan Miller et al. investigates the effect of alkaline dust deposition on SO₂ dry deposition velocity using the GEM-MACH model. This detailed examination in the AOSR contributes to our understanding of the role of deposition processes, and I am generally inclined to recommend publication of this manuscript. I would, however, encourage the authors to address the following specific points, particularly those related to presentation quality.
Major comment
- With respect to the analysis of deposition, the deposition flux (Fig. 13) is an important quantity, and I fully agree with the authors’ choice to emphasize this in their analysis. However, a limitation of the current approach is that the flux is presented as a mean field over the study period (i.e., monthly averages in this manuscript). To better capture the variability of deposition, I suggest also examining the total deposition amount accumulated over the target period (e.g., monthly totals). This perspective may reveal different characteristics compared to the averaged fields and could highlight additional impacts in the sensitivity experiments.
Specific comments
- Line 269: To avoid confusion, it would be helpful to note explicitly that rac is discussed later and is not introduced here (see eqs. (3)–(8)).
- 3: The colored corners (light blue and light green) in each panel are unclear. Please explain what these colors represent in the figure or caption.
- Line 605: Please clarify how the minimum value of the multiplication coefficient of 0.5 by TK was determined.
- Lines 643–654: Please clarify the actual calculation method used for the charge balance. Is HETP applied in the “Base Case” simulation? This section feels somewhat long; it may be helpful to summarize the key points in a table (e.g., revising or expanding Table 2) for clarity.
- 5: It would be helpful to label the top and bottom panels explicitly as “May 2018” and “June 2018,” respectively, because the two panels appear very similar at first glance.
- Lines 759–779: The discussion of “charge_adj_Lw_low” (#3 in Table 2) and “charge_adj_Lw_high” (#4 in Table 2) is somewhat difficult to follow. Consider adding a figure analogous to Fig. 5 to illustrate these cases more clearly.
- 6: Please unify the x-axis range for “Leaf pH” so that (a) can be directly compared with (b), and (c) with (d).
- Line 947: The discussion based on NMB can also be inferred from Fig. 12. I therefore recommend explicitly citing Fig. 12 together with Fig. 11 here. This cross-reference will be helpful for readers.
Citation: https://doi.org/10.5194/egusphere-2025-6392-RC2 - AC1: 'Comment on egusphere-2025-6392: Response to Reviewers' Comments', Paul Makar, 29 Apr 2026
Peer review completion
Journal article(s) based on this preprint
Viewed
| HTML | XML | Total | Supplement | BibTeX | EndNote | |
|---|---|---|---|---|---|---|
| 1,411 | 1,147 | 220 | 2,778 | 309 | 407 | 457 |
- HTML: 1,411
- PDF: 1,147
- XML: 220
- Total: 2,778
- Supplement: 309
- BibTeX: 407
- EndNote: 457
Viewed (geographical distribution)
| Country | # | Views | % |
|---|
| Total: | 0 |
| HTML: | 0 |
| PDF: | 0 |
| XML: | 0 |
- 1

Paul A. Makar
Kenjiro Toyota
Colin Lee
Verica Savic-Jovcic
Sepehr Fathi
Mathab Majdzadeh
Katherine Hayden
The requested preprint has a corresponding peer-reviewed final revised paper. You are encouraged to refer to the final revised version.
- Preprint
(5111 KB) - Metadata XML
-
Supplement
(3071 KB) - BibTeX
- EndNote
- Final revised paper
Review: Miller et al., 2026
“Alkaline dust deposition to foliage surfaces likely enhances the dry deposition velocity of SO2: An investigation in the Alberta Oil-Sands Region using the GEM-MACH air-quality model”
Summary
This manuscript describes work to improve process representation of SO2 dry deposition in the GEM-MACH regional air quality model. Dry deposition is an important process to capture in chemistry transport models, but process realism is difficult to achieve due the sub-grid scale nature of the contributing processes. The authors address this problem by targeting dry deposition on wet vegetation surfaces. They expand GEM-MACH’s dry deposition mechanism to include a scheme that calculates pH on the thin films of water that accumulate on foliage. They hypothesize that this will improve SO2 dry deposition in regions like the Athabasca Oil Sands, where high atmospheric concentrations of acidic and alkaline gases and aerosols can influence foliage pH, and therefore deposition of acidic and basic gases. The authors find that GEM-MACH can better predict SO2 dry deposition velocities in the Athabasca Oil Sands Region when this scheme is included, although the impacts on atmospheric SO2 concentrations is small.
Overall, the manuscript is well written in clear language. However, I think that the manuscript is over-long relative to the limited scope of the results. It is unclear what the wider impacts, if any, the new foliage water pH scheme would have on e.g. deposition velocities of other acidic and basic gases like NH3 or HNO3 and what impact it might have a dusty or wildfire affected region. While I recommend the manuscript for publication, I have some General and Technical comments below that should be addressed first.
General Comments
Technical Comments
Abstract
Suggest “We examine here the potential for simultaneous…”
Introduction
Section 2.2
Section 3 – Dry deposition algorithms
Here, is “M” mol L-1?
Section 4 - simulating foliage pH
Suggest pointing to the specific section/subsection.
Section 5.1
Section 5.2
Section 5.3
Figures 11 and 12 show that there are only small changes in SO2 concentrations between the base and CALCCO3_Lw_high simulations at most of the sites and only five sites where CALCCO3_Lw_high substantially reduces bias against the observations. This is despite the better agreement between CALCCO3_Lw_high and observed VdSO2 shown in Figure 9. Is there anything linking the five WBEA sites where CALCCO3_Lw_high reduces bias against the observations and Oski-otin, YAJP and DWEF? E.g. location or vegetation type?
I also found Figure 12 hard to interpret due to the small font and symbol sizes. Perhaps the authors could consider i) including just Figure 12b (the results from June that are also presented in Figure 11) and ii) summarizing the results from Figures 12a, c and d?
Can the authors suggest a reason/s why CALCCO3_Lw_high reduces bias against the atmospheric SO2 observations at some sites and months, but not others? Are these sites linked by location or vegetation type? Further, is there anything linking the five WBEA sites where CALCCO3_Lw_high reduces bias against the observations and Oski-otin, YAJP and DWEF? Again, location or vegetation type?