
the Creative Commons Attribution 4.0 License.
the Creative Commons Attribution 4.0 License.
 | 17 Dec 2025
A guide to optimised spatiotemporal data co-location by mutual information maximisation
Abstract. The matching of data described on different coordinate systems between multiple data sources – spatiotemporal co-location – is a necessary and crucial step in geospatial data synthesis and validation. The particular choice of co-location scheme, and the choice of parameters applied to it, decide what subsets of the original datasets are included in downstream analyses, affecting the quantitative outputs of comparison studies and multi-retrieval synthesised datasets. Previously, no generalised framework for deciding how best to co-locate data has existed. We outline a domain- and data-agnostic framework that generalises the process of selecting an optimised co-location parametrisation for a given co-location scheme, by maximising the mutual information encoded between the data included in the subsequent analyses. We demonstrate the framework by applying it to a comparison of vertical cloud fraction profiles retrieved from the polar-orbiting ICESat-2 satellite's ATL09 data product, and surface-based observations at four Cloudnet observatories. We evaluate per-site optimised co-location parametrisations and find that using the optimised co-location parametrisations quantitatively improves the comparison between the datasets over naive choices of co-location parameters. This work has implications across almost all remote sensing data products – especially for satellite validations – and will facilitate deep learning methodologies by producing paired datasets with the maximal information about the structure between datasets available to be learned.
-
Notice on discussion status
The requested preprint has a corresponding peer-reviewed final revised paper. You are encouraged to refer to the final revised version.
-
Preprint
(4964 KB)
-
The requested preprint has a corresponding peer-reviewed final revised paper. You are encouraged to refer to the final revised version.
- Preprint
(4964 KB) - Metadata XML
- BibTeX
- EndNote
- Final revised paper


Journal article(s) based on this preprint
Interactive discussion
Status: closed
-
RC1: 'Comment on egusphere-2025-6079', Anonymous Referee #1, 23 Jan 2026
- AC1: 'Reply on RC1', Andrew Martin, 27 Mar 2026
-
RC2: 'Comment on egusphere-2025-6079', Anonymous Referee #2, 25 Jan 2026
The comment was uploaded in the form of a supplement: https://egusphere.copernicus.org/preprints/2025/egusphere-2025-6079/egusphere-2025-6079-RC2-supplement.pdf
- AC2: 'Reply on RC2', Andrew Martin, 27 Mar 2026
Peer review completion


Interactive discussion
Status: closed
-
RC1: 'Comment on egusphere-2025-6079', Anonymous Referee #1, 23 Jan 2026
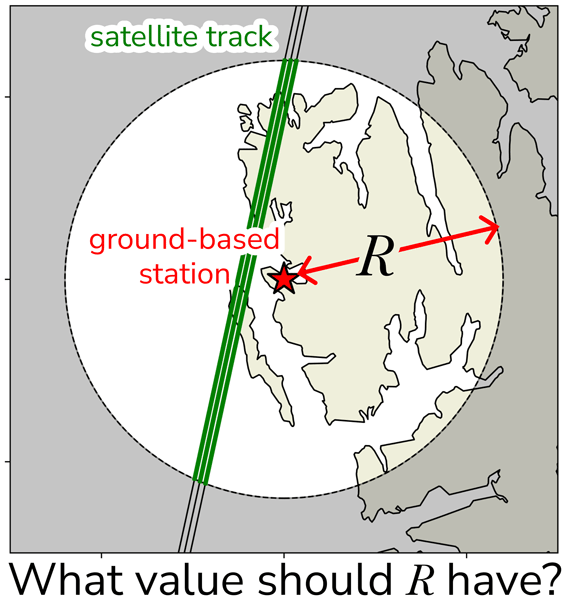
The paper outlines an objective method to identify the parameters of a collocation scheme, illustrated for the comparison of ICESAT-2 to Cloudnet profiles of cloud mask by the selection of a radial separation in the satellite track and temporal window for the ground-based field. The algorithm optimises the mutual information content provided by paired collocation observations, arguing that that value increases as the volume of data considered increases until such time as uncorrelated observations begin to contaminate the set.
I cannot more strongly recommend this paper for publication. It was an absolute delight to read and an astonishingly good document for a junior researcher. I have some minor comments and corrections that may assist in the uptake of this method by the atmospheric science community (who are generally unfamiliar with formal mathematics or statistics), but mostly wish to thank the authors for providing me with a rewarding read. I look forward to applying the technique when I next need to run a validation study.
Minor comments:
- The text in figures would, ideally, be similar in size to the text within the captions. While those reading a PDF can zoom in, those of us foolish enough to print off papers to get some time away from a screen cannot read any of the labels in the figures of this paper. Is it possible to regenerate the diagrams with text scaled to their printed size?
- Though it isn’t necessary, the paper may be improved by a qualitative description of some of the mathematical operations in S2.3 as most researchers in atmospheric science do not have much training in the formalism of mathematics. For example, “nearest neighbour distances between samples” would likely be interpreted to refer to the physical distance between observations rather than the distance in state space. The references given are accurate but not necessarily useful for the audience of this journal; a textbook or lecture course may be useful (as was done for the description of the copula).
- L68: It’s not clear to me why optimising the correlation coefficient biases the results high. This may be a matter of definition, as I’m reading this line to say “we are preferentially selecting results where one is consistently larger than the other” as that is how ‘bias’ tends to be used in atmospheric science. You may have meant “we are preferentially selecting results that are large” (in magnitude) or “we are preferentially selecting results that resemble each other”. My instinct is that the sample will be biased but with unpredictable sign. There is every chance this is a standard result in statistics of which I am unaware.
- L161 and L163: The values given in the text differ slightly from those given in Fig. 2. Please check which is correct.
- L270: I agree that, in the 2-D presentation of Fig. 4, Cloudnet data is a point. However, in 3-D space, the satellite swath is a (mostly vertical) surface and the site is a vertical line. I’m not sure the document would be improved by making this point, but the pedant in me could not leave this distinction unmentioned.
- L401: It is not obvious to me that the number of profiles scales with \cosh(R). I would have expected this to come from the rule of cosines giving the length of a bisector of a circle to be $R\sqrt{2(1-\cos\gamma)}$; hence linear R dependence. Regardless, if you are correct, isn’t $\lim_{R \to \infty} cosh(R) = \infty$ rather than R?
- Fig. 5 and L422: The discontinuity in significant solutions deserves some more comment to guide readers in how to communicate their confidence in the selection of optimal parameters. A continuous region of significance can sensibly be communicated through traditional uncertainty notation (even if not strictly appropriate), but this second solution is much harder to communicate. Would the authors expect this degeneracy to resolve as more data is added to the problem (i.e. wait for a longer dataset) or is this an unavoidable aspect of the problem? What would you do if the difference in mutual information between the two solutions was negligible?
- L425: I understand this section to argue that I(p) decreases as you move away from \hat{p}, but I’m unsure that ‘unimodal’ is the correct word for that. Unimodal means the surface is single-valued at each point – which is true by construction for I. Collapsing the 2-D surface into a function of distance from \hat{p} clearly isn't unimodal because the surfaces clearly aren’t isotropic about that point. ‘Largely monotonic’ strikes me as more appropriate but several options are available.
- L778: If the authors think there is any general utility to this simulation, it may be worth mentioning within the main body that $N > 10^4$ achieves consistency in these estimators. Some guide on the number of observations necessary to apply this method would be useful to most readers.
- App. C: This is probably just a difference between the language of a mathematician and a physicist, but I would call these three points approximations rather than assumptions that are broken.
- Sec. 3.6.2: There is no way you could have known this, but section 4 of https://doi.org/10.1007/s10712-025-09898-4 published after your submission explores some of the issues with collocation you discuss at the end of this section. Further, in the aerosol community there is precedent in the publications of Nick Schutgens for the conclusion that a one-size-fits-all collocation criteria is sub-optimal, such as Fig. 1 of https://doi.org/10.5194/acp-20-12431-2020 or the conclusions of https://doi.org/10.5194/acp-17-9761-2017. Admittedly, Nick aims to minimise the bias, which is exactly what you argue against doing, but you might find the comparison could be useful.
Technical corrections:
- L16: validation and constraining
- L62: expectation to the comparison
- Tab. 1: There should be a space before N_{profiles}.
- L598: these different quantities
- L710: There should be a space after the comma.
- Eq. C10: Shouldn’t it be \lambda_{21} here? If I’m correct, it might be clearer for C11 to show \cos\lambda_{21} and switch to \cos\lambda_{12} for C12.
- Maybe C14 should come before C13 as the more natural equation to follow from C5?
- L888: this bearing into an across-track
- I randomly tried a few of the DOI links in the references; Crameri 2023 and Palm 2021a were dead links for me.
Citation: https://doi.org/10.5194/egusphere-2025-6079-RC1 - AC1: 'Reply on RC1', Andrew Martin, 27 Mar 2026
-
RC2: 'Comment on egusphere-2025-6079', Anonymous Referee #2, 25 Jan 2026
The comment was uploaded in the form of a supplement: https://egusphere.copernicus.org/preprints/2025/egusphere-2025-6079/egusphere-2025-6079-RC2-supplement.pdf
- AC2: 'Reply on RC2', Andrew Martin, 27 Mar 2026
Peer review completion
Journal article(s) based on this preprint
Data sets
Mutual information maximisation for spatiotemporal co-location: ICESat-2 ATL09 and Cloudnet categorize Andrew Martin https://doi.org/10.5281/zenodo.17817304
Interactive computing environment
DAndrewA/a-guide-to-optimised-spatiotemporal-data-co-location-by-mutual-information-maximisation: v1.0.1 Andrew Martin https://doi.org/10.5281/zenodo.17830442
Viewed
| HTML | XML | Total | BibTeX | EndNote | |
|---|---|---|---|---|---|
| 1,567 | 1,069 | 203 | 2,839 | 150 | 109 |
- HTML: 1,567
- PDF: 1,069
- XML: 203
- Total: 2,839
- BibTeX: 150
- EndNote: 109
Viewed (geographical distribution)
| Country | # | Views | % |
|---|
| Total: | 0 |
| HTML: | 0 |
| PDF: | 0 |
| XML: | 0 |
- 1
Andrew Steven Martin

Heather Guy
Michael Ray Gallagher
Ryan Reynolds Neely III
The requested preprint has a corresponding peer-reviewed final revised paper. You are encouraged to refer to the final revised version.
- Preprint
(4964 KB) - Metadata XML
The paper outlines an objective method to identify the parameters of a collocation scheme, illustrated for the comparison of ICESAT-2 to Cloudnet profiles of cloud mask by the selection of a radial separation in the satellite track and temporal window for the ground-based field. The algorithm optimises the mutual information content provided by paired collocation observations, arguing that that value increases as the volume of data considered increases until such time as uncorrelated observations begin to contaminate the set.
I cannot more strongly recommend this paper for publication. It was an absolute delight to read and an astonishingly good document for a junior researcher. I have some minor comments and corrections that may assist in the uptake of this method by the atmospheric science community (who are generally unfamiliar with formal mathematics or statistics), but mostly wish to thank the authors for providing me with a rewarding read. I look forward to applying the technique when I next need to run a validation study.
Minor comments:
Technical corrections: