
the Creative Commons Attribution 4.0 License.
the Creative Commons Attribution 4.0 License.
 | 17 Mar 2026
Shifting patterns of Ozone Season due to policy and human activity in Beijing between 2013 and 2023
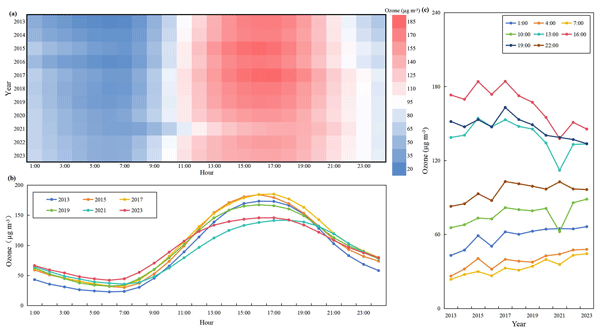
Abstract. Since 2013, Beijing has implemented a series of stringent measures to control air pollution, resulting in significant improvements in air quality. This study analyzed the variations in ozone pollution in Beijing over the past decade, focusing on the influence of human activities and environmental management policies from 2013 to 2023. Over this period, the duration of the Ozone Season in Beijing has prolonged, with the onset of ozone pollution occurring earlier and its cessation extending later during the year. Additionally, there has been a rise in the low percentile concentrations of the maximum 8-hour moving average of ozone (MDA8), and the overall exposure time to ozone has shifted to later over the years. While diurnal peak concentrations during the Ozone Season have decreased, trough concentrations have increased, resulting in a more subdued diurnal variation. Furthermore, both the maximum generation and consumption rates of ozone have decreased in absolute terms, with the maximum generation rate showing a tendency to occur earlier in the day. To better protect human health and enhance the effectiveness of environmental policies, it is essential to closely monitor the evolving patterns of urban ozone pollution.
-
Notice on discussion status
The requested preprint has a corresponding peer-reviewed final revised paper. You are encouraged to refer to the final revised version.
-
Preprint
(1308 KB)
-
The requested preprint has a corresponding peer-reviewed final revised paper. You are encouraged to refer to the final revised version.
- Preprint
(1308 KB) - Metadata XML
- BibTeX
- EndNote
- Final revised paper


Journal article(s) based on this preprint
Interactive discussion
Status: closed
-
RC1: 'Comment on egusphere-2026-585', Anonymous Referee #1, 07 Apr 2026
-
AC1: 'Reply on RC1', Xiue Shen, 09 Jun 2026
Dear Reviewer,Thank you very much for your thorough and constructive comments. We have carefully revised the manuscript in response to your suggestions and prepared a detailed point-by-point reply. The major revisions include:(1)incorporating Mann–Kendall (MK) tests to assess the statistical significance of long-term ozone trends;(2)clarifying the definition and calculation of the ozone exposure window (T_MDA8 ) in the Methods section;(3) expanding the discussion on factors influencing the net ozone tendency (hourly change rate);(4) adding a new Section 3.7 to analyze NOₓ and VOCs emission trends in Beijing using the MEIC inventory, providing quantitative context for interpreting the observed ozone changes.We sincerely hope that the revised manuscript and our responses satisfactorily address your concerns. The detailed point-by-point response is attached for your review.Best regards,
-
AC1: 'Reply on RC1', Xiue Shen, 09 Jun 2026
-
RC2: 'Comment on egusphere-2026-585', Anonymous Referee #2, 07 Apr 2026
This study analyzes long‑term (2013–2023) changes in ozone pollution in Beijing, focusing on the Ozone Season. The authors document an earlier onset and later end of the Ozone Season, increased low‑percentile MDA8 concentrations, delayed diurnal ozone exposure, reduced diurnal peak ozone and generation rates, and increased nighttime/trough concentrations. The topic is relevant given Beijing’s air quality policies. However, the manuscript suffers from critical methodological and interpretational flaws that severely undermine its scientific contribution. I recommend major revision before the manuscript can be considered for acceptance.
Major comments
- The title and abstract repeatedly claim that observed changes are “due to policy and human activity”. However, the study only presents descriptive trends. No emission time series (NOx, VOCs), no meteorological contribution separated. The authors exclude days with precipitation (>0 mm) or wind speed >5 m/s for >2 hours to obtain “typical” days. This crude filtering does not remove variability from temperature, humidity, cloud cover, or boundary layer height. So discussions referred to the control policy could be bias or need to more quantitative analysis to support it.
- The paper reports numerous trends (e.g., first pollution day advances by 1.38 days/year; MDA8 mean increases by 0.94 µg/m³/year; peak ozone decreases by 3.6 µg/m³/year; Ozone Season lengthens by 2.0 days/year). No p‑values, confidence intervals, or trend tests (e.g., Mann‑Kendall) are provided. Given the strong interannual variability (e.g., 2021 as an outlier), many of these trends may not be statistically significant.
- The Ozone Season is defined as the period from the first to the last MDA8 > 160 µg/m³ day of the year. This definition is highly sensitive to isolated early or late pollution events caused by unusual meteorology (e.g., a single hot day in March). The authors do not test robustness.
- The average advancement of the first pollution day (1.38 days/year) and delay of the last pollution day (0.63 days/year) are derived from only 11 years with high interannual variability. No significance testing is provided, and these averages mix real trends with random meteorological fluctuations. It is misleading to calculate the change rate X days/year.
- The authors claim a significant upward trend in mean MDA8 (0.94 µg/m³/year). However, the data show strong interannual fluctuations (e.g., 2021 mean is nearly as low as 2013). Without a Mann‑Kendall test and sensitivity analysis (excluding 2021 or 2023), the trend is not credible. The increase in low percentiles is well known and not novel.
- According to the authors’ figure 5, the apparent “delay” in ozone exposure start time (t1) is driven almost entirely by the unusually early t1 in 2013. For 2014–2023, t1 values are similar. Therefore, the claimed “shifting to later over the years” is not a trend but seems a single anomaly.
- Vi = Pᵢ – Pᵢ₋₁ is a net change rate that includes horizontal/vertical transport, not just photochemical production/loss. The authors repeatedly refer to “generation rate” and “consumption rate” without acknowledging the influence of transport. This is misleading.
- The cold season (October–March) contains very few ozone pollution days (mostly in October and March; November–February rarely have MDA8 > 160). The reported t1 distributions for the cold season are based on extremely small sample sizes, making year‑to‑year comparisons unreliable.
- The study period includes the COVID‑19 pandemic years (2020–2022), during which anthropogenic emissions (especially NOx) dropped dramatically in Beijing. These short‑term changes can strongly affect ozone metrics and may confound the long‑term trend attributed to policy. The authors need to perform sensitivity analysis (e.g., excluding 2020–2022) nr discuss how the pandemic might have influenced their results.
- The discussion speculates that NOx reduction weakens nighttime titration and VOC reduction lowers daytime peaks. However, no time series of ambient NO₂ or VOC concentrations (or emissions) in Beijing are presented. Without these data, the attribution remains speculative.
Minor Comments
- Several sentences are awkward or unclear. Examples: “the overall exposure time to ozone has shifted to later over the years” to “has shifted to later in the day”. A professional language edit is recommended.
- Table 1: The effective rate of “typical” days after weather filtering ranges from 54% to 77%. The low rates (e.g., 54% in 2021) raise concerns about representativeness. Discuss potential bias.
- Figure 4: The y‑axis is time of day, but the caption is unclear. Clarify that colors represent frequency or concentration. Add units.
- Figure 5: why there are hot colors at 1:00 am.
- As temperatures rise, this exposure window shifts, with the duration extending from 14:00 to 21:00 during the months of April to September. 14:00 to 21:00 seems not match the figure.
- How the data in some of figures are not clearly explained. Many figure captions are not self-explanatory.
- Some citations are incomplete or inconsistent (e.g., “Beijing Municipal Bureau of Ecology and Environment, 2024” should be formatted as a proper reference). Check journal guidelines.
- In the conclusion, the statement “The decrease in peak concentrations benefits from coordinated emission reduction policies for regional VOCs and NOx (Wang et al., 2022)” includes a citation. Citations are generally not recommended in the conclusion section, as conclusions should summarize findings without introducing new references.
Citation: https://doi.org/10.5194/egusphere-2026-585-RC2 -
AC2: 'Reply on RC2', Xiue Shen, 09 Jun 2026
Dear Reviewer,Thank you very much for your thorough and constructive comments. We have carefully revised the manuscript in response to your suggestions and prepared a detailed point-by-point reply. The major revisions include:(1)incorporating Mann–Kendall (MK) tests to assess the statistical significance of long-term ozone trends;(2)clarifying the definition and calculation of the ozone exposure window (T_MDA8 ) in the Methods section;(3) expanding the discussion on factors influencing the net ozone tendency (hourly change rate);(4) adding a new Section 3.7 to analyze NOₓ and VOCs emission trends in Beijing using the MEIC inventory, providing quantitative context for interpreting the observed ozone changes.We sincerely hope that the revised manuscript and our responses satisfactorily address your concerns. The detailed point-by-point response is attached for your review.Best regards,
Peer review completion


Interactive discussion
Status: closed
-
RC1: 'Comment on egusphere-2026-585', Anonymous Referee #1, 07 Apr 2026
General Comments
This manuscript analyzes long-term changes in the ozone season, percentile concentrations, exposure time, and ozone generation/consumption rates in Beijing based on ground-level ozone observations from 2013 to 2023. The topic is of some practical relevance. However, the current manuscript has clear shortcomings in terms of scientific focus, depth of mechanistic analysis, and methodological rigor. Overall, the paper remains at the level of descriptive statistical analysis and lacks quantitative investigation of the drivers of ozone variability, making it difficult to support its central claim regarding the impacts of human activities and environmental management policies. In addition, several key concepts are not rigorously defined, parts of the methods are unclear or non-standard, and some interpretations of the results involve logical leaps or overstatement. Taken together, the manuscript does not currently meet the standard for publication and should make a major revision.
Specific Comments
- The manuscript introduces the concept of the “Ozone Season”; however, this concept largely overlaps with previously defined terms such as the “warm season” or “pollution season,” and thus offers limited novelty. Although the authors attempt to define it based on MDA8 pollution days, they do not sufficiently justify the advantages or necessity of this definition compared to existing approaches. Moreover, the manuscript fails to demonstrate the added value of this concept in terms of mechanistic understanding or policy evaluation.
- The abstract and introduction repeatedly emphasize the influence of human activities and pollution control policies. However, the main text relies solely on qualitative interpretations of temporal trends, without incorporating any supporting evidence such as emission inventories (e.g., NOx, VOCs) or model simulations. Specific issues include: no use of emission inventory data, no separation of meteorological and emission-driven contributions, no sensitivity or attribution analysis. Therefore, the key conclusions (e.g., attributing observed changes to NOx emission reductions) are not directly supported by evidence and remain largely speculative.
- The definition and calculation of ozone exposure time are not sufficiently clear. The authors are encouraged to provide a more explicit description and move this definition to the Methods section to improve clarity and reproducibility.
- In Section 3.5, the ozone variation rate is defined as . This method essentially represents the net change in concentration and may be influenced by transport and boundary layer processes, rather than purely reflecting chemical production or loss. The authors should clarify the applicability of this approach and provide appropriate references to support its use.
- Several trends (e.g., changes in peak values and percentile concentrations) are reported without statistical significance testing. The authors are encouraged to include statistical metrics to strengthen the robustness of the conclusions.
- The manuscript frequently refers to the impacts of NOx, VOCs, and climate change; however, these discussions remain largely qualitative and lack sufficient scientific rigor. Specifically, the study does not include the quantitative analysis, the model-based support or the process-level decomposition. Therefore, the mechanistic interpretation presented in the manuscript resembles an empirical summary rather than a rigorous scientific analysis, and therefore does not adequately support the conclusions drawn.
Technical Comments
- Lines 205–207: Fig. 7 is introduced immediately after Fig. 5, which disrupts the logical flow. The order of figure presentation should be revised.
- Figure 8 contains too many lines, making it difficult to interpret. The authors are encouraged to simplify the figure, for example by averaging over multiple years (e.g., every two years) or grouping the data.
- There are large blank spaces on several pages, which affect the overall layout. The manuscript formatting should be improved.
Citation: https://doi.org/10.5194/egusphere-2026-585-RC1 -
AC1: 'Reply on RC1', Xiue Shen, 09 Jun 2026
Dear Reviewer,Thank you very much for your thorough and constructive comments. We have carefully revised the manuscript in response to your suggestions and prepared a detailed point-by-point reply. The major revisions include:(1)incorporating Mann–Kendall (MK) tests to assess the statistical significance of long-term ozone trends;(2)clarifying the definition and calculation of the ozone exposure window (T_MDA8 ) in the Methods section;(3) expanding the discussion on factors influencing the net ozone tendency (hourly change rate);(4) adding a new Section 3.7 to analyze NOₓ and VOCs emission trends in Beijing using the MEIC inventory, providing quantitative context for interpreting the observed ozone changes.We sincerely hope that the revised manuscript and our responses satisfactorily address your concerns. The detailed point-by-point response is attached for your review.Best regards,
-
RC2: 'Comment on egusphere-2026-585', Anonymous Referee #2, 07 Apr 2026
This study analyzes long‑term (2013–2023) changes in ozone pollution in Beijing, focusing on the Ozone Season. The authors document an earlier onset and later end of the Ozone Season, increased low‑percentile MDA8 concentrations, delayed diurnal ozone exposure, reduced diurnal peak ozone and generation rates, and increased nighttime/trough concentrations. The topic is relevant given Beijing’s air quality policies. However, the manuscript suffers from critical methodological and interpretational flaws that severely undermine its scientific contribution. I recommend major revision before the manuscript can be considered for acceptance.
Major comments
- The title and abstract repeatedly claim that observed changes are “due to policy and human activity”. However, the study only presents descriptive trends. No emission time series (NOx, VOCs), no meteorological contribution separated. The authors exclude days with precipitation (>0 mm) or wind speed >5 m/s for >2 hours to obtain “typical” days. This crude filtering does not remove variability from temperature, humidity, cloud cover, or boundary layer height. So discussions referred to the control policy could be bias or need to more quantitative analysis to support it.
- The paper reports numerous trends (e.g., first pollution day advances by 1.38 days/year; MDA8 mean increases by 0.94 µg/m³/year; peak ozone decreases by 3.6 µg/m³/year; Ozone Season lengthens by 2.0 days/year). No p‑values, confidence intervals, or trend tests (e.g., Mann‑Kendall) are provided. Given the strong interannual variability (e.g., 2021 as an outlier), many of these trends may not be statistically significant.
- The Ozone Season is defined as the period from the first to the last MDA8 > 160 µg/m³ day of the year. This definition is highly sensitive to isolated early or late pollution events caused by unusual meteorology (e.g., a single hot day in March). The authors do not test robustness.
- The average advancement of the first pollution day (1.38 days/year) and delay of the last pollution day (0.63 days/year) are derived from only 11 years with high interannual variability. No significance testing is provided, and these averages mix real trends with random meteorological fluctuations. It is misleading to calculate the change rate X days/year.
- The authors claim a significant upward trend in mean MDA8 (0.94 µg/m³/year). However, the data show strong interannual fluctuations (e.g., 2021 mean is nearly as low as 2013). Without a Mann‑Kendall test and sensitivity analysis (excluding 2021 or 2023), the trend is not credible. The increase in low percentiles is well known and not novel.
- According to the authors’ figure 5, the apparent “delay” in ozone exposure start time (t1) is driven almost entirely by the unusually early t1 in 2013. For 2014–2023, t1 values are similar. Therefore, the claimed “shifting to later over the years” is not a trend but seems a single anomaly.
- Vi = Pᵢ – Pᵢ₋₁ is a net change rate that includes horizontal/vertical transport, not just photochemical production/loss. The authors repeatedly refer to “generation rate” and “consumption rate” without acknowledging the influence of transport. This is misleading.
- The cold season (October–March) contains very few ozone pollution days (mostly in October and March; November–February rarely have MDA8 > 160). The reported t1 distributions for the cold season are based on extremely small sample sizes, making year‑to‑year comparisons unreliable.
- The study period includes the COVID‑19 pandemic years (2020–2022), during which anthropogenic emissions (especially NOx) dropped dramatically in Beijing. These short‑term changes can strongly affect ozone metrics and may confound the long‑term trend attributed to policy. The authors need to perform sensitivity analysis (e.g., excluding 2020–2022) nr discuss how the pandemic might have influenced their results.
- The discussion speculates that NOx reduction weakens nighttime titration and VOC reduction lowers daytime peaks. However, no time series of ambient NO₂ or VOC concentrations (or emissions) in Beijing are presented. Without these data, the attribution remains speculative.
Minor Comments
- Several sentences are awkward or unclear. Examples: “the overall exposure time to ozone has shifted to later over the years” to “has shifted to later in the day”. A professional language edit is recommended.
- Table 1: The effective rate of “typical” days after weather filtering ranges from 54% to 77%. The low rates (e.g., 54% in 2021) raise concerns about representativeness. Discuss potential bias.
- Figure 4: The y‑axis is time of day, but the caption is unclear. Clarify that colors represent frequency or concentration. Add units.
- Figure 5: why there are hot colors at 1:00 am.
- As temperatures rise, this exposure window shifts, with the duration extending from 14:00 to 21:00 during the months of April to September. 14:00 to 21:00 seems not match the figure.
- How the data in some of figures are not clearly explained. Many figure captions are not self-explanatory.
- Some citations are incomplete or inconsistent (e.g., “Beijing Municipal Bureau of Ecology and Environment, 2024” should be formatted as a proper reference). Check journal guidelines.
- In the conclusion, the statement “The decrease in peak concentrations benefits from coordinated emission reduction policies for regional VOCs and NOx (Wang et al., 2022)” includes a citation. Citations are generally not recommended in the conclusion section, as conclusions should summarize findings without introducing new references.
Citation: https://doi.org/10.5194/egusphere-2026-585-RC2 -
AC2: 'Reply on RC2', Xiue Shen, 09 Jun 2026
Dear Reviewer,Thank you very much for your thorough and constructive comments. We have carefully revised the manuscript in response to your suggestions and prepared a detailed point-by-point reply. The major revisions include:(1)incorporating Mann–Kendall (MK) tests to assess the statistical significance of long-term ozone trends;(2)clarifying the definition and calculation of the ozone exposure window (T_MDA8 ) in the Methods section;(3) expanding the discussion on factors influencing the net ozone tendency (hourly change rate);(4) adding a new Section 3.7 to analyze NOₓ and VOCs emission trends in Beijing using the MEIC inventory, providing quantitative context for interpreting the observed ozone changes.We sincerely hope that the revised manuscript and our responses satisfactorily address your concerns. The detailed point-by-point response is attached for your review.Best regards,
Peer review completion
Journal article(s) based on this preprint
Viewed
| HTML | XML | Total | BibTeX | EndNote | |
|---|---|---|---|---|---|
| 719 | 353 | 113 | 1,185 | 82 | 101 |
- HTML: 719
- PDF: 353
- XML: 113
- Total: 1,185
- BibTeX: 82
- EndNote: 101
Viewed (geographical distribution)
| Country | # | Views | % |
|---|
| Total: | 0 |
| HTML: | 0 |
| PDF: | 0 |
| XML: | 0 |
- 1
Qian Li
Xiaofei Dong
Yuanxi Guo
Xiue Shen

Zhang Zhang
Chunsheng Zhao
The requested preprint has a corresponding peer-reviewed final revised paper. You are encouraged to refer to the final revised version.
- Preprint
(1308 KB) - Metadata XML
General Comments
This manuscript analyzes long-term changes in the ozone season, percentile concentrations, exposure time, and ozone generation/consumption rates in Beijing based on ground-level ozone observations from 2013 to 2023. The topic is of some practical relevance. However, the current manuscript has clear shortcomings in terms of scientific focus, depth of mechanistic analysis, and methodological rigor. Overall, the paper remains at the level of descriptive statistical analysis and lacks quantitative investigation of the drivers of ozone variability, making it difficult to support its central claim regarding the impacts of human activities and environmental management policies. In addition, several key concepts are not rigorously defined, parts of the methods are unclear or non-standard, and some interpretations of the results involve logical leaps or overstatement. Taken together, the manuscript does not currently meet the standard for publication and should make a major revision.
Specific Comments
Technical Comments