
the Creative Commons Attribution 4.0 License.
the Creative Commons Attribution 4.0 License.
 | 13 Feb 2026
Comparing high spatial and temporal resolution snow depth measurements and modelling results in an avalanche release area
Abstract. Accurate representation of snow depth distribution within avalanche release areas is critical for understanding avalanche formation and supporting operational avalanche mitigation measures. In this study, we investigate the spatial variability of snow depth in an avalanche release area using high spatial (0.5 m) and temporal (hourly) resolution measurements obtained from a low-cost terrestrial laser scanner (TLS). The TLS data provide detailed snow depth distributions for three selected snow accumulation events, including sub-event evolution, enabling an event- and sub-event-based analysis of snow deposition patterns.
We assess the ability of three terrain-based modelling approaches to reproduce observed snow depth patterns: the topographic position index (TPI), a wind shelter index (Sx), and a statistical preferential deposition model. The results indicate that simple topography-derived indices generally achieve the highest correlations with measured snow depths across most events. The correlations reach maximum values of up to 0.57 (Spearman correlation), indicating that topographic predictors are able to partially, but not fully explain the present snow depth variability at sub-metre spatial resolution.
These findings emphasise the dominant role of local terrain in shaping snow accumulation patterns within avalanche release areas, demonstrate the value of TLS data for event-scale model evaluation, and highlight the potential to complement incomplete observations using simple terrain-based modelling approaches. The collection of additional snow depth distribution data with such high spatio-temporal resolution in different avalanche release areas would enable the development of machine learning approaches in the future. This fosters event-based avalanche forecasting by improving the spatial completeness of snow depth observations in complex terrain at slope scale.
Competing interests: At least one of the (co-)authors is a member of the editorial board of The Cryosphere. The peer-review process was guided by an independent editor, and the authors also have no other competing interests to declare.
Publisher's note: Copernicus Publications remains neutral with regard to jurisdictional claims made in the text, published maps, institutional affiliations, or any other geographical representation in this paper. While Copernicus Publications makes every effort to include appropriate place names, the final responsibility lies with the authors. Views expressed in the text are those of the authors and do not necessarily reflect the views of the publisher.-
Notice on discussion status
The requested preprint has a corresponding peer-reviewed final revised paper. You are encouraged to refer to the final revised version.
-
Preprint
(10438 KB)
-
The requested preprint has a corresponding peer-reviewed final revised paper. You are encouraged to refer to the final revised version.
- Preprint
(10438 KB) - Metadata XML
- BibTeX
- EndNote
- Final revised paper


Journal article(s) based on this preprint
Interactive discussion
Status: closed
-
RC1: 'Comment on egusphere-2026-485', Anonymous Referee #1, 19 Apr 2026
- AC1: 'Reply on RC1', Pia Ruttner, 28 May 2026
-
RC2: 'Comment on egusphere-2026-485', Alexander Prokop, 14 May 2026
General comments:
Indeed a well written, easy to understand and technically correct manuscript about the validation of two simple terrain based modeling approaches and one preferential deposition model from statistical snowfall down-scaling utilizing high temporal and high resolution automated low cost LiDAR spatial snow depth data. While the terrain-based modeling approaches have been extensively validated with similar data in lower temporal resolution, the validation of the preferential deposition model is new to my knowledge. Unfortunately the results show what numerous similar studies have found in the past, the models work according to their well-known advances and limitations. Depending how well the underlying process is described by the model, the better the correlation between measured and modeled spatial snow depth data is but never really satisfying as different complex processes usually occur at the same time. Therefore the scientific value of the paper is currently a bit low, but can be improved significantly. I strongly suggest same as reviewer 1 to incorporate TLS derived snow depth differences (ΔHS) into the development and calibration of the models. While the spatial patterns of snow accumulation in mountainous terrain can be described to a certain extend the amount of snow that is accumulated is usually not represented in a satisfying manner. There is great potential in using the measured snow depth data in improving the results of the presented models as it was done in the past e.g. using snow-particle-counter data. In this way the advantages of the automated LiDAR measurements fully apply as the high temporal resolution of spatial snow depth data allows to determine how much snow was actually eroded and accumulated by the different processes e.g. saltation, suspension, preferential deposition. Furthermore the chosen model can be then used for a greater area, not just to fill data gaps, as the results will be much closer to reality than using the water equivalent of new snow (HNW) derived from ICON.
Specific comments:
40 The first that published the use of low-cost LiDARs to measure spatial snow depth was Kapperer et al. 2024, please cite accordingly
70 In this paragraph it would be good to lead to incorporating measured snow depth data in the modeling approach as Schön et al. 2018 did using blowing snow fluxes or Prokop and Procter 2016 did using LIDAR derived spatial snow depth data. Please also cite accordingly.
90-110 It is not clearly indicated what data is used for what model as input. E.g. all studies so far used wind direction data from on site automated weather stations (or very close by stations) for the Sx model, as those studies found much better results than using data from numerical weather prediction models, as wind direction is often not represented well in a 1 km grid. I guess you use such numerical weather prediction model data as input for the preferential deposition model, as it makes more sense there. Please clarify, discuss and justify why you used which input data for what model.
117 2 times „the“, reduce to 1
165 and so on: As reviewer 1 already indicated it is not clear why those model approaches are selected. While TPI and SX are somewhat similar and described as terrain based modeling approaches the PD from statistical snowfall downscaling intends to model a different process (preferential deposition) and is intended and made for much lower resolution grids. It’s nice to see that a model for preferential deposition also works best for a preferential deposition event (E3) and e.g. Sx describes better a snow redistribution event (E2), but that should have been clear to begin with and is found in literature. Please clarify your choice and discuss in detail what the benefit from this choice/study is.
Here it would be also good to let the reader know, what search distances you used calculating Sx, usually small search distances are able to represent snow redistribution in particular around small terrain features, while longer search distances are usually better suited to model preferential deposition or blowing snow (suspension)320: usually automated wind measuring stations for avalanche forecasting locally (slope scale) are located at ridges to determine from what wind direction snow is blown into a slope, calculating e.g Sx those locations usually also work best. Flat field stations for meteorology are usually not able to represent local wind fields in mountainous terrain, is perhaps this discussion going their? Of course the location of such automated weather stations is dependent on application of the data and has to be carefully chosen.
330: Numerous studies have shown that the underlying DSM of surfaces with or without snow or different stages of the snow-pack have an impact using terrain based model approaches if a terrain feature is snowed in or not or to what extend as long as the terrain feature is represented in the DSM resolution and model settings are also matching (e.g. search distance for Sx). For a preferential deposition model the choice of the DSM is rather negligible as only large terrain features that are never fully covered by snow are represented in the resolution of the DSM used for the calculation. The discussion here seems a bit unspecific, please specify more and explain why the results show no difference in model performance.
Literature used:
Kapper KL, Goelles T, Muckenhuber S, Trügler A, Abermann J, Schlager B, Gaisberger C, Eckerstorfer M, Grahn J, Malnes E, Prokop A and Schöner W (2023), Automated snow avalanche monitoring for Austria: State of the art and roadmap for future work. Front. Remote Sens. 4:1156519. doi: 10.3389/frsen.2023.1156519
Schön, P., Naaim-Bouvet, F., Vionnet, V., and Prokop, A. (2018). Merging a terrain-based parameter with blowing snow fluxes for assessing snow redistribution in alpine terrain. Cold Regions Sci. Technol. 155, 161–173. doi:10.1016/j.coldregions.2018.08.002
Prokop, A., and Procter, E. S. (2016). A new methodology for planning snow drift fences in alpine terrain. Cold Reg. Sci. Technol. 132, 33–43. doi:10.1016/j.coldregions.2016.09.010
Citation: https://doi.org/10.5194/egusphere-2026-485-RC2 - AC2: 'Reply on RC2', Pia Ruttner, 28 May 2026
Peer review completion


Interactive discussion
Status: closed
-
RC1: 'Comment on egusphere-2026-485', Anonymous Referee #1, 19 Apr 2026
General Comments
This manuscript presents an interesting study on comparing high spatial and temporal resolution snow depth measurements and modelling results in an avalanche release area. The manuscript is generally well written, and the overall structure is clear. I particularly appreciate the authors’ efforts in continuous ground/near-surface observations of mountain snow and in linking these observations with a modelling approach for spatio-temporal mapping, which is especially valuable given the significant data gaps and research challenges in complex mountain environments.
However, there are some issues that should be addressed before the manuscript can be considered for publication. In particular:
- The proposed models heavily rely on the water equivalent of new snow (HNW) derived from ICON. However, the uncertainty of this dataset in alpine environments is not clearly discussed. The reported maximum correlation of 0.57 (corresponding to a coefficient of determination of about 0.3) indicates that only about 30% of the observed snow depth variability is explained by the model. This explanatory power limits their suitability for more general spatial and temporal mapping. Given that the influence of terrain parameters on snow spatial variability is already well established in the literature, the manuscript would benefit from a clearer discussion of the added value provided by the proposed modelling approach.
- High‑quality TLS measurements are acquired and supported by a well‑documented accuracy assessment presented in the authors’ previous work. Rather than using the TLS data solely for comparison, it may be more informative to directly incorporate TLS‑derived snow depth differences (ΔHS) into the development and calibration of the models—particularly the statistical terrain‑indicator‑based models—rather than relying on ICON‑derived HNW. The authors are encouraged to more clearly justify their current modelling choice and to discuss the potential advantages of using or integrating TLS‑derived ΔHS in model development.
Specific Comments
- In the abstract, the authors refer to “three terrain‑based modelling approaches’’. However, in the methodology, the models based on TPI and Sx are presented as terrain‑based, plus a preferential deposition model from statistical snowfall downscaling PD. Please check and ensure consistency in how the modelling approaches are described and categorized across the manuscript.
- The Introduction starts with an emphasis on the wind factor and later shifts to a discussion of terrain effects (around Line 45). It would improve clarity to merge these aspects more coherently earlier in the section, before introducing the measurements and modelling framework.
- In Section 2.2, three weather stations are mentioned (line 101), whereas Figure 1 shows only two. Please verify and revise the text or figure accordingly.
- In Section 2.2 and 2.3, it lacks a description of data accuracy for the ICON products and the DSM. As the results strongly depend on the quality of these datasets, additional information on their accuracy and associated uncertainties should be provided.
- In Table 1, the upper and lower borders of the table are missing. Please update the table.
- The methodology section can be challenging to follow due to the large number of equations, variables, and symbols, which also increases the chances of typos. Please carefully review all equations and ensure that all variables are clearly defined and consistently described throughout the text. For example, the summation index (j=0,…,n) for α in Eqs. (4) and (5) appears to be missing. Variables in the definition of μ (Line 241) are not explained. There seem to be typos in Yaspectdsc,j (Line 249), and in the reference to X dsc,j, which is cited as Eq. 7 (Line 262) but seems to be Eq. 8. Please verify and correct accordingly.
- In Section 3.1.3, the parameter selection for TPI and Sx appears to be more closely related to the results rather than the methodology. It may therefore be more appropriate to move this section to the Results.
- In Section 3.1.4, There is a lack of explanation regarding why the scaling is required and what added value it provides. Additional explanation is needed to justify the use of scaling, and the corresponding equation for scaling should be explicitly included before Eq. 4 to make it more clear to the audience.
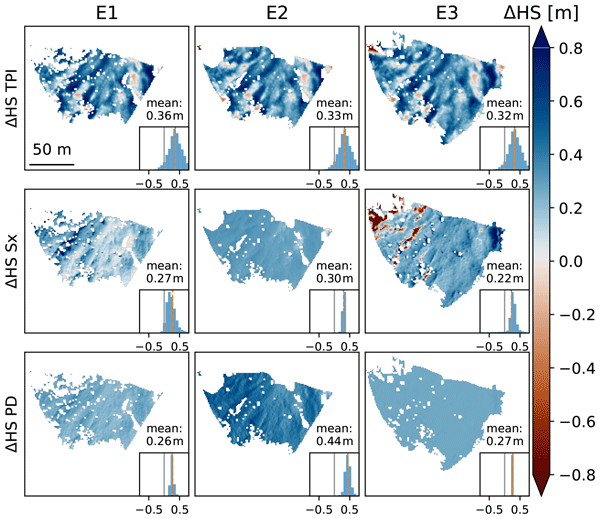
- In Section 4.3, it states ‘underestimating areas with large, positive ∆HSs, and overestimating areas with small, or negative ∆HSs’. However, this is not straightforward to infer from Figure 8 alone. Adding a scatterplot of the differences between measured and modelled ΔHS as a function of ΔHS would help to better illustrate this.
- In Figure 4, The caption does not explain what the upper and lower rows represent, which makes the figure difficult to interpret. In addition, for the TPI panel, part of the margin is cropped due to border artefacts, but there is no explanation of how much margin was removed or the relevant reference. Please check and clarify.
- In Figure 5, please explicitly indicate whether the sub‑event plots correspond to E1 or E2 to improve clarity. In addition, the caption states that ΔHS is calculated as the difference between the DSMs before and after the snowfall events and during the sub‑events. Please double‑check whether this is defined as after minus before or before minus after, and ensure that the description is consistent.
- Please check the usage of ΔHS versus HN throughout the manuscript, especially in the figures. In some cases, HN appears to be used interchangeably with ΔHS, while in others it is not. Please review the manuscript and ensure consistency.
- Both the abstract and the discussion mention the potential of machine learning, but the discussion remains rather brief. It would be helpful to further elaborate on how machine learning could realistically contribute to this workflow, rather than referring to it only in general terms.
Citation: https://doi.org/10.5194/egusphere-2026-485-RC1 - AC1: 'Reply on RC1', Pia Ruttner, 28 May 2026
-
RC2: 'Comment on egusphere-2026-485', Alexander Prokop, 14 May 2026
General comments:
Indeed a well written, easy to understand and technically correct manuscript about the validation of two simple terrain based modeling approaches and one preferential deposition model from statistical snowfall down-scaling utilizing high temporal and high resolution automated low cost LiDAR spatial snow depth data. While the terrain-based modeling approaches have been extensively validated with similar data in lower temporal resolution, the validation of the preferential deposition model is new to my knowledge. Unfortunately the results show what numerous similar studies have found in the past, the models work according to their well-known advances and limitations. Depending how well the underlying process is described by the model, the better the correlation between measured and modeled spatial snow depth data is but never really satisfying as different complex processes usually occur at the same time. Therefore the scientific value of the paper is currently a bit low, but can be improved significantly. I strongly suggest same as reviewer 1 to incorporate TLS derived snow depth differences (ΔHS) into the development and calibration of the models. While the spatial patterns of snow accumulation in mountainous terrain can be described to a certain extend the amount of snow that is accumulated is usually not represented in a satisfying manner. There is great potential in using the measured snow depth data in improving the results of the presented models as it was done in the past e.g. using snow-particle-counter data. In this way the advantages of the automated LiDAR measurements fully apply as the high temporal resolution of spatial snow depth data allows to determine how much snow was actually eroded and accumulated by the different processes e.g. saltation, suspension, preferential deposition. Furthermore the chosen model can be then used for a greater area, not just to fill data gaps, as the results will be much closer to reality than using the water equivalent of new snow (HNW) derived from ICON.
Specific comments:
40 The first that published the use of low-cost LiDARs to measure spatial snow depth was Kapperer et al. 2024, please cite accordingly
70 In this paragraph it would be good to lead to incorporating measured snow depth data in the modeling approach as Schön et al. 2018 did using blowing snow fluxes or Prokop and Procter 2016 did using LIDAR derived spatial snow depth data. Please also cite accordingly.
90-110 It is not clearly indicated what data is used for what model as input. E.g. all studies so far used wind direction data from on site automated weather stations (or very close by stations) for the Sx model, as those studies found much better results than using data from numerical weather prediction models, as wind direction is often not represented well in a 1 km grid. I guess you use such numerical weather prediction model data as input for the preferential deposition model, as it makes more sense there. Please clarify, discuss and justify why you used which input data for what model.
117 2 times „the“, reduce to 1
165 and so on: As reviewer 1 already indicated it is not clear why those model approaches are selected. While TPI and SX are somewhat similar and described as terrain based modeling approaches the PD from statistical snowfall downscaling intends to model a different process (preferential deposition) and is intended and made for much lower resolution grids. It’s nice to see that a model for preferential deposition also works best for a preferential deposition event (E3) and e.g. Sx describes better a snow redistribution event (E2), but that should have been clear to begin with and is found in literature. Please clarify your choice and discuss in detail what the benefit from this choice/study is.
Here it would be also good to let the reader know, what search distances you used calculating Sx, usually small search distances are able to represent snow redistribution in particular around small terrain features, while longer search distances are usually better suited to model preferential deposition or blowing snow (suspension)320: usually automated wind measuring stations for avalanche forecasting locally (slope scale) are located at ridges to determine from what wind direction snow is blown into a slope, calculating e.g Sx those locations usually also work best. Flat field stations for meteorology are usually not able to represent local wind fields in mountainous terrain, is perhaps this discussion going their? Of course the location of such automated weather stations is dependent on application of the data and has to be carefully chosen.
330: Numerous studies have shown that the underlying DSM of surfaces with or without snow or different stages of the snow-pack have an impact using terrain based model approaches if a terrain feature is snowed in or not or to what extend as long as the terrain feature is represented in the DSM resolution and model settings are also matching (e.g. search distance for Sx). For a preferential deposition model the choice of the DSM is rather negligible as only large terrain features that are never fully covered by snow are represented in the resolution of the DSM used for the calculation. The discussion here seems a bit unspecific, please specify more and explain why the results show no difference in model performance.
Literature used:
Kapper KL, Goelles T, Muckenhuber S, Trügler A, Abermann J, Schlager B, Gaisberger C, Eckerstorfer M, Grahn J, Malnes E, Prokop A and Schöner W (2023), Automated snow avalanche monitoring for Austria: State of the art and roadmap for future work. Front. Remote Sens. 4:1156519. doi: 10.3389/frsen.2023.1156519
Schön, P., Naaim-Bouvet, F., Vionnet, V., and Prokop, A. (2018). Merging a terrain-based parameter with blowing snow fluxes for assessing snow redistribution in alpine terrain. Cold Regions Sci. Technol. 155, 161–173. doi:10.1016/j.coldregions.2018.08.002
Prokop, A., and Procter, E. S. (2016). A new methodology for planning snow drift fences in alpine terrain. Cold Reg. Sci. Technol. 132, 33–43. doi:10.1016/j.coldregions.2016.09.010
Citation: https://doi.org/10.5194/egusphere-2026-485-RC2 - AC2: 'Reply on RC2', Pia Ruttner, 28 May 2026
Peer review completion
Journal article(s) based on this preprint
Viewed
| HTML | XML | Total | BibTeX | EndNote | |
|---|---|---|---|---|---|
| 1,007 | 581 | 97 | 1,685 | 135 | 196 |
- HTML: 1,007
- PDF: 581
- XML: 97
- Total: 1,685
- BibTeX: 135
- EndNote: 196
Viewed (geographical distribution)
| Country | # | Views | % |
|---|
| Total: | 0 |
| HTML: | 0 |
| PDF: | 0 |
| XML: | 0 |
- 1

Nora Helbig
Annelies Voordendag
Andreas Wieser
Yves Bühler
The requested preprint has a corresponding peer-reviewed final revised paper. You are encouraged to refer to the final revised version.
- Preprint
(10438 KB) - Metadata XML
General Comments
This manuscript presents an interesting study on comparing high spatial and temporal resolution snow depth measurements and modelling results in an avalanche release area. The manuscript is generally well written, and the overall structure is clear. I particularly appreciate the authors’ efforts in continuous ground/near-surface observations of mountain snow and in linking these observations with a modelling approach for spatio-temporal mapping, which is especially valuable given the significant data gaps and research challenges in complex mountain environments.
However, there are some issues that should be addressed before the manuscript can be considered for publication. In particular:
Specific Comments