
the Creative Commons Attribution 4.0 License.
the Creative Commons Attribution 4.0 License.
 | 07 Jul 2026
Ozone Downward Flux Revealed by High-Resolution Differential Absorption Lidar over Tibet during Stratosphere-Troposphere Exchange
Abstract. This study characterizes a prominent ozone intrusion event driven by STE that occurred on 18–19 October 2017. The analysis is enabled by high spatiotemporal resolution ozone profile observations from the USTC Ozone Lidar deployed at Yangbajing, Tibet (29° N, 99° E). It provides the first lidar-based detection of these rapid ozone descent events and the evidence linking them to temperature variability in the tropopause region through lidar-derived temperature profiles, revealing temperature gradients that generally exceed 8 K km−1 during these events and beyond the resolving capability of conventional atmospheric model products. Combining Wei’s flux diagnostic with a sensitivity test of PV-based dynamical tropopause thresholds identifies 3 PVU as the most suitable definition for this case. ERA5 is then used to characterize the spatiotemporal evolution of cross-tropopause mass fluxes over 25–28° N, 95–99° E, showing that the ozone variations observed by the lidar were modulated by gravity waves associated with the tropopause fold. In addition, lidar-measured ozone profiles are incorporated into a cross-tropopause ozone flux calculation framework, yielding an instantaneous peak STE ozone flux of about 3~4·10-10·kg·s-1·m-2, slightly higher than the corresponding ERA5 value, while maintaining strong agreement in overall flux magnitude and temporal evolution throughout the event. These results show that high-resolution vertical ozone observations and Raman-retrieved temperature profiles from the USTC Ozone Lidar, combined with wind field data, enable accurate quantification of STE-related ozone fluxes. This approach facilitates in-depth investigation of coupled atmospheric composition and dynamical processes.
-
Notice on discussion status
The requested preprint has a corresponding peer-reviewed final revised paper. You are encouraged to refer to the final revised version.
-
Preprint
(5717 KB)
-
The requested preprint has a corresponding peer-reviewed final revised paper. You are encouraged to refer to the final revised version.
- Preprint
(5717 KB) - Metadata XML
- BibTeX
- EndNote
- Final revised paper


Journal article(s) based on this preprint
Interactive discussion
Status: closed
-
CC1: 'use of Wei method to estimate STE', Heini Wernli, 14 Jul 2026
-
AC1: 'Reply on CC1', Ruichun Dong, 28 Jul 2026
Dear Professor Wernli,
Thank you very much for taking the time to review our manuscript and for drawing our attention to this important methodological issue. We are particularly grateful to receive such detailed and constructive comments from a leading expert in Stratosphere-Troposphere Exchange.
After receiving your comments and suggestions, I spent more than two weeks carefully reassessing the relevant analyses in our manuscript. The preliminary results are also included in the attached document. They show pronounced spatiotemporal heterogeneity and bidirectional exchange near the 3-PVU surface during 18-19 October. Significant exchange signals repeatedly occurred near 26-28°N and 97-99°E, supporting the interpretation that this region was associated with tropopause folding and related dynamical disturbances.We therefore propose to retain the lidar evidence of the local downward intrusion while redefining its regional dynamical context using the trajectory-based results.
Thank you again for this constructive comment. It has helped us identify and address a significant weakness in the original analysis. We would also be very grateful for any further advice you may be willing to provide, and we sincerely hope that there may be opportunities for scientific collaboration with you in the future.With best regards,
Ruichun Dong, Xin Fang, Chengyun Yang, and Tao Li
-
AC1: 'Reply on CC1', Ruichun Dong, 28 Jul 2026
-
RC1: 'Comment on egusphere-2026-3261', Anonymous Referee #1, 29 Jul 2026
-
AC2: 'Reply on RC1', Ruichun Dong, 21 Aug 2026
The comment was uploaded in the form of a supplement: https://egusphere.copernicus.org/preprints/2026/egusphere-2026-3261/egusphere-2026-3261-AC2-supplement.pdf
-
AC2: 'Reply on RC1', Ruichun Dong, 21 Aug 2026
-
RC2: 'Comment on egusphere-2026-3261', Anonymous Referee #2, 30 Jul 2026
The topic of this manuscript is both necessary and scientifically meaningful for research on stratosphere-troposphere exchange over the Tibetan Plateau. The observational dataset used in this study is relatively rare. In particular, the lidar system employs four differential absorption wavelengths together with two nitrogen Raman channels, allowing simultaneous measurements of tropospheric and stratospheric ozone profiles as well as temperature profiles over the Tibetan Plateau. This dataset therefore has considerable scientific value. The short-duration and rapid ozone downward-transport event presented in the manuscript is also worthy of attention.
The overall research framework is reasonably complete. I am particularly interested in the relationship established in this study between lidar-observed ozone downward transport and variations in the temperature profile. The main conclusions of the current manuscript are generally reasonable. Nevertheless, the descriptions of several methods and the associated uncertainty analysis require further improvement. I recommend that the authors address the following comments in the revised manuscript.
P4, Lines 95-99
The manuscript states that the raw backscatter signals were stored at 1 min intervals, while the stratospheric signals were accumulated over 30 min and processed using a moving window to obtain continuous profiles. Under this processing scheme, retrievals at adjacent output times may share a large proportion of the same raw signals. The authors should therefore distinguish between the effective integration time and the independent temporal resolution.
For example, the expression “1 min temporal resolution” could be revised to “a 1 min output interval with a 30 min effective integration time.” These two concepts should not be treated as equivalent.
P6, Lines 111-116
This section presents the merged ozone number-density profiles obtained from the lidar measurements, but no uncertainty range is provided. Considering that the ozone flux calculated later in the manuscript depends simultaneously on ozone concentration, mass flux, and the diagnosed tropopause position, the authors should provide a reasonable estimate of the uncertainty in the retrieved ozone profiles.
P10, Lines 219-229
The authors select 3 PVU as the dynamical tropopause for this event based on changes in the calculated mass flux under different potential-vorticity thresholds and on the spatial continuity of the corresponding PV surfaces. This choice is generally understandable, but the current selection criteria remain somewhat qualitative.
I suggest that the authors provide a comparison of the main results obtained using, for example, the 2, 3, and 4 PVU surfaces. If the principal conclusions remain consistent under these different thresholds, such a comparison would provide stronger evidence for the robustness of the results. Alternatively, the statement that “3 PVU is the most appropriate threshold” could be moderated. A more precise formulation would be that “3 PVU is adopted in this study as a representative threshold for this event.”
P8-13, Figs. 4 and 8 and the related discussion
The most distinctive aspect of this study is the simultaneous observation of high-resolution ozone and temperature profiles by the lidar system. I recommend that the authors further strengthen this part of the manuscript.
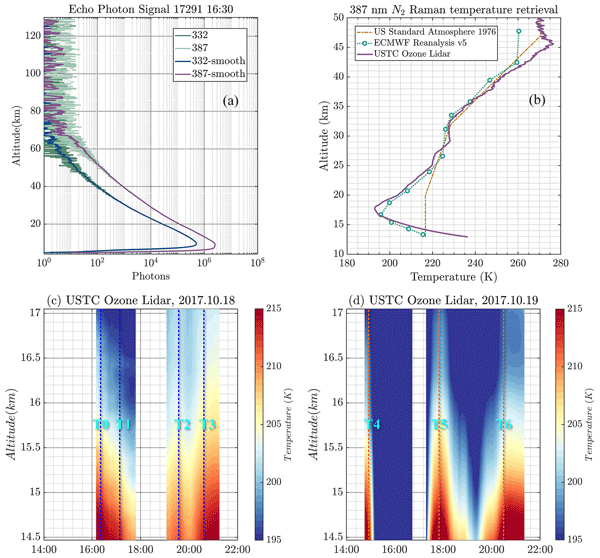
In particular, the identification criteria for the T0-T6 stages should be described more clearly. The manuscript should also explain more explicitly how the observed temperature gradients correspond to the ozone anomalies. A quantitative or event-by-event comparison would be especially useful. Further development of this analysis would make the observational contribution of the study more prominent. It would also reduce the extent to which the main conclusions depend on a single flux-diagnostic method.
P17, Lines 280-285
The description in this section is somewhat confusing. The authors are advised to carefully check the relevant text and clarify the intended meaning.
P17, around Line 343
The reference “shown in Fig. 10” appears to refer to Fig. 11. Please check and correct the figure citation.
Overall, the observational dataset has substantial scientific value, and the event investigated in this study is reasonably representative. The main results are generally credible. After the issues listed above have been adequately addressed, the manuscript could become a useful case study of Stratosphere-Troposphere Exchange over the Tibetan Plateau.
Citation: https://doi.org/10.5194/egusphere-2026-3261-RC2 -
AC3: 'Reply on RC2', Ruichun Dong, 21 Aug 2026
The comment was uploaded in the form of a supplement: https://egusphere.copernicus.org/preprints/2026/egusphere-2026-3261/egusphere-2026-3261-AC3-supplement.pdf
-
AC3: 'Reply on RC2', Ruichun Dong, 21 Aug 2026
-
CC2: 'Comment on egusphere-2026-3261', D. C. Wu, 05 Aug 2026
Because of unique terrain and atmospheric circulation, the Tibetan Plateau is a hotspot for studying troposphere-stratosphere exchange. Observation data from spaceborne sensors and reanalysis data were employed in the studying of troposphere-stratosphere exchange over the Tibetan Plateau, however, observation data with high spatial and temporal resolutions are still very lack, which are essential for studying troposphere-stratosphere exchange.
This article presents ozone measurements from a mobile ozone lidar located in the Tibetan Plateau, and study the troposphere-stratosphere exchange by using ozone as a tracer. Due to the high altitude, there are few lidar operated in the Tibetan Plateau. The lidar employed in the article has a capability of profiling ozone and temperature in the troposphere and stratosphere synchronously with high spatial and temporal resolutions, and the lidar data are very valuable for the atmospheric studying over the Tibetan Plateau. The job in the article is a good attempt to study the troposphere-stratosphere exchange by using ozone lidar data in the Tibetan Plateau. The consistency of the lidar measurements and ERA5 data indicated the reasonable of the EAR5 data over the Tibetan Plateau, and more details could be found in the lidar data, and these details could provide more information of the troposphere-stratosphere exchange.
There are some comments as following,
- Line 126, “USTC Ozone lidar shows good consistency the ERA5”, however, in the figure 3(b), the peak value of the ozone concentration profile from ERA5 is obviously lager than the peak value from lidar.
- Line 171, the vertical resolution of the temperature profile from ERA5 for tropopause determination should be given.
- The time in the article is the local time or UTC?
Citation: https://doi.org/10.5194/egusphere-2026-3261-CC2 -
AC5: 'Reply on CC2', Ruichun Dong, 21 Aug 2026
General Remarks
Because of unique terrain and atmospheric circulation, the Tibetan Plateau is a hotspot for studying troposphere-stratosphere exchange. Observation data from spaceborne sensors and reanalysis data were employed in the studying of troposphere-stratosphere exchange over the Tibetan Plateau, however, observation data with high spatial and temporal resolutions are still very lack, which are essential for studying troposphere-stratosphere exchange.
This article presents ozone measurements from a mobile ozone lidar located in the Tibetan Plateau, and study the troposphere-stratosphere exchange by using ozone as a tracer. Due to the high altitude, there are few lidar operated in the Tibetan Plateau. The lidar employed in the article has a capability of profiling ozone and temperature in the troposphere and stratosphere synchronously with high spatial and temporal resolutions, and the lidar data are very valuable for the atmospheric studying over the Tibetan Plateau. The job in the article is a good attempt to study the troposphere-stratosphere exchange by using ozone lidar data in the Tibetan Plateau. The consistency of the lidar measurements and ERA5 data indicated the reasonable of the EAR5 data over the Tibetan Plateau, and more details could be found in the lidar data, and these details could provide more information of the troposphere-stratosphere exchange.
The article could be accepted and published.
Our Response:
We sincerely thank the reviewer for the positive assessment of our manuscript and for recognizing the scientific value of the simultaneous high-resolution ozone and temperature lidar observations over the Tibetan Plateau. We also appreciate the reviewer’s recognition that the lidar data provide fine-scale information complementary to satellite and ERA5 datasets. Following the reviewer’s comments, we have carefully revised the manuscript to improve its methodological description, physical interpretation, uncertainty discussion, and overall clarity. We are grateful for the constructive suggestions and recommendation for publication.
Comments and Suggestions #1
- Line 126, “USTC Ozone lidar shows good consistency the ERA5”, however, in the figure 3(b), the peak value of the ozone concentration profile from ERA5 is obviously lager than the peak value from lidar.
Our Response:
Thank you very much for your helpful comment and suggestion. Our interpretation is as follows. ERA5 is a gridded reanalysis product that represents an analyzed atmospheric state over a finite horizontal grid cell, model level, and temporal sampling interval. Therefore, even after the ERA5 data are interpolated to the lidar site and to an altitude of 25 km, the ERA5 and lidar results do not represent strictly identical quantities because of their different spatial, vertical, and temporal representativeness.
Another possible explanation is that the ozone retrievals over approximately 20-32 km are based on the N₂ Raman backscatter signals. The reduced effective vertical resolution at these altitudes, together with the smoothing applied during the retrieval, may attenuate sharp ozone maxima and produce a smoothing-induced reduction in peak amplitude. Nevertheless, the main focus of the present study is the tropopause region between approximately 14 and 17 km, where the retrieved ozone profiles show no apparent abnormal behavior.
Comments and Suggestions #2
- Line 171, the vertical resolution of the temperature profile from ERA5 for tropopause determination should be given.
Our Response:
Thank you very much for your helpful comment and suggestion. For the PV-based dynamical-tropopause diagnosis, the ERA5 fields were treated in pressure coordinates and vertically interpolated at uniform intervals of 0.5 hPa. For the initial ERA5-based screening of the event, however, the thermodynamic tropopause was identified using the height and temperature information corresponding to each interpolated pressure level, following the WMO lapse-rate criterion.
Comments and Suggestions #3
- The time in the article is the local time or UTC?
Our Response:
Thank you for this question. All times reported in the manuscript are given in Coordinated Universal Time (UTC), rather than local time.
Citation: https://doi.org/10.5194/egusphere-2026-3261-AC5
-
RC3: 'Comment on egusphere-2026-3261', Anonymous Referee #3, 06 Aug 2026
Because of unique terrain and atmospheric circulation, the Tibetan Plateau is a hotspot for studying troposphere-stratosphere exchange. Observation data from spaceborne sensors and reanalysis data were employed in the studying of troposphere-stratosphere exchange over the Tibetan Plateau, however, observation data with high spatial and temporal resolutions are still very lack, which are essential for studying troposphere-stratosphere exchange.
This article presents ozone measurements from a mobile ozone lidar located in the Tibetan Plateau, and study the troposphere-stratosphere exchange by using ozone as a tracer. Due to the high altitude, there are few lidar operated in the Tibetan Plateau. The lidar employed in the article has a capability of profiling ozone and temperature in the troposphere and stratosphere synchronously with high spatial and temporal resolutions, and the lidar data are very valuable for the atmospheric studying over the Tibetan Plateau. The job in the article is a good attempt to study the troposphere-stratosphere exchange by using ozone lidar data in the Tibetan Plateau. The consistency of the lidar measurements and ERA5 data indicated the reasonable of the EAR5 data over the Tibetan Plateau, and more details could be found in the lidar data, and these details could provide more information of the troposphere-stratosphere exchange.
The article could be accepted and published.
There are some comments as following,
- Line 126, “USTC Ozone lidar shows good consistency the ERA5”, however, in the figure 3(b), the peak value of the ozone concentration profile from ERA5 is obviously lager than the peak value from lidar.
- Line 171, the vertical resolution of the temperature profile from ERA5 for tropopause determination should be given.
- The time in the article is the local time or UTC?
Citation: https://doi.org/10.5194/egusphere-2026-3261-RC3 -
AC4: 'Reply on RC3', Ruichun Dong, 21 Aug 2026
The comment was uploaded in the form of a supplement: https://egusphere.copernicus.org/preprints/2026/egusphere-2026-3261/egusphere-2026-3261-AC4-supplement.pdf
Peer review completion


Interactive discussion
Status: closed
-
CC1: 'use of Wei method to estimate STE', Heini Wernli, 14 Jul 2026
Dear authors
I had a brief look at your interesting lidar observations over Tibet. And I then noticed that you used the Wei (1987) method to quantify STE. While this method was pioneering 40 years ago, it is no longer state-of-the-art. You even reference the paper by Wirth and Egger (1999) who studied in great detail the reliability of the Wei method. Wirth and Egger concluded that "... versions of Wei's formula which predominantly draw on standard information [as you do in your study] ... turn out to be unreliable". The Wei method yields very noisy fields (as also see in your Figs. 9 and 10) and Wirth and Egger even showed that the method yields non-zero STE in a "conservative simulation" where no PV modification occurred and therefore STE should be zero. I invite you to consider using a more robust and more modern method to quantify STE in your study - we should not use methods any longer that were shown to be unreliable.
With best regards,
Heini Wernli
Citation: https://doi.org/10.5194/egusphere-2026-3261-CC1 -
AC1: 'Reply on CC1', Ruichun Dong, 28 Jul 2026
Dear Professor Wernli,
Thank you very much for taking the time to review our manuscript and for drawing our attention to this important methodological issue. We are particularly grateful to receive such detailed and constructive comments from a leading expert in Stratosphere-Troposphere Exchange.
After receiving your comments and suggestions, I spent more than two weeks carefully reassessing the relevant analyses in our manuscript. The preliminary results are also included in the attached document. They show pronounced spatiotemporal heterogeneity and bidirectional exchange near the 3-PVU surface during 18-19 October. Significant exchange signals repeatedly occurred near 26-28°N and 97-99°E, supporting the interpretation that this region was associated with tropopause folding and related dynamical disturbances.We therefore propose to retain the lidar evidence of the local downward intrusion while redefining its regional dynamical context using the trajectory-based results.
Thank you again for this constructive comment. It has helped us identify and address a significant weakness in the original analysis. We would also be very grateful for any further advice you may be willing to provide, and we sincerely hope that there may be opportunities for scientific collaboration with you in the future.With best regards,
Ruichun Dong, Xin Fang, Chengyun Yang, and Tao Li
-
AC1: 'Reply on CC1', Ruichun Dong, 28 Jul 2026
-
RC1: 'Comment on egusphere-2026-3261', Anonymous Referee #1, 29 Jul 2026
-
AC2: 'Reply on RC1', Ruichun Dong, 21 Aug 2026
The comment was uploaded in the form of a supplement: https://egusphere.copernicus.org/preprints/2026/egusphere-2026-3261/egusphere-2026-3261-AC2-supplement.pdf
-
AC2: 'Reply on RC1', Ruichun Dong, 21 Aug 2026
-
RC2: 'Comment on egusphere-2026-3261', Anonymous Referee #2, 30 Jul 2026
The topic of this manuscript is both necessary and scientifically meaningful for research on stratosphere-troposphere exchange over the Tibetan Plateau. The observational dataset used in this study is relatively rare. In particular, the lidar system employs four differential absorption wavelengths together with two nitrogen Raman channels, allowing simultaneous measurements of tropospheric and stratospheric ozone profiles as well as temperature profiles over the Tibetan Plateau. This dataset therefore has considerable scientific value. The short-duration and rapid ozone downward-transport event presented in the manuscript is also worthy of attention.
The overall research framework is reasonably complete. I am particularly interested in the relationship established in this study between lidar-observed ozone downward transport and variations in the temperature profile. The main conclusions of the current manuscript are generally reasonable. Nevertheless, the descriptions of several methods and the associated uncertainty analysis require further improvement. I recommend that the authors address the following comments in the revised manuscript.
P4, Lines 95-99
The manuscript states that the raw backscatter signals were stored at 1 min intervals, while the stratospheric signals were accumulated over 30 min and processed using a moving window to obtain continuous profiles. Under this processing scheme, retrievals at adjacent output times may share a large proportion of the same raw signals. The authors should therefore distinguish between the effective integration time and the independent temporal resolution.
For example, the expression “1 min temporal resolution” could be revised to “a 1 min output interval with a 30 min effective integration time.” These two concepts should not be treated as equivalent.
P6, Lines 111-116
This section presents the merged ozone number-density profiles obtained from the lidar measurements, but no uncertainty range is provided. Considering that the ozone flux calculated later in the manuscript depends simultaneously on ozone concentration, mass flux, and the diagnosed tropopause position, the authors should provide a reasonable estimate of the uncertainty in the retrieved ozone profiles.
P10, Lines 219-229
The authors select 3 PVU as the dynamical tropopause for this event based on changes in the calculated mass flux under different potential-vorticity thresholds and on the spatial continuity of the corresponding PV surfaces. This choice is generally understandable, but the current selection criteria remain somewhat qualitative.
I suggest that the authors provide a comparison of the main results obtained using, for example, the 2, 3, and 4 PVU surfaces. If the principal conclusions remain consistent under these different thresholds, such a comparison would provide stronger evidence for the robustness of the results. Alternatively, the statement that “3 PVU is the most appropriate threshold” could be moderated. A more precise formulation would be that “3 PVU is adopted in this study as a representative threshold for this event.”
P8-13, Figs. 4 and 8 and the related discussion
The most distinctive aspect of this study is the simultaneous observation of high-resolution ozone and temperature profiles by the lidar system. I recommend that the authors further strengthen this part of the manuscript.
In particular, the identification criteria for the T0-T6 stages should be described more clearly. The manuscript should also explain more explicitly how the observed temperature gradients correspond to the ozone anomalies. A quantitative or event-by-event comparison would be especially useful. Further development of this analysis would make the observational contribution of the study more prominent. It would also reduce the extent to which the main conclusions depend on a single flux-diagnostic method.
P17, Lines 280-285
The description in this section is somewhat confusing. The authors are advised to carefully check the relevant text and clarify the intended meaning.
P17, around Line 343
The reference “shown in Fig. 10” appears to refer to Fig. 11. Please check and correct the figure citation.
Overall, the observational dataset has substantial scientific value, and the event investigated in this study is reasonably representative. The main results are generally credible. After the issues listed above have been adequately addressed, the manuscript could become a useful case study of Stratosphere-Troposphere Exchange over the Tibetan Plateau.
Citation: https://doi.org/10.5194/egusphere-2026-3261-RC2 -
AC3: 'Reply on RC2', Ruichun Dong, 21 Aug 2026
The comment was uploaded in the form of a supplement: https://egusphere.copernicus.org/preprints/2026/egusphere-2026-3261/egusphere-2026-3261-AC3-supplement.pdf
-
AC3: 'Reply on RC2', Ruichun Dong, 21 Aug 2026
-
CC2: 'Comment on egusphere-2026-3261', D. C. Wu, 05 Aug 2026
Because of unique terrain and atmospheric circulation, the Tibetan Plateau is a hotspot for studying troposphere-stratosphere exchange. Observation data from spaceborne sensors and reanalysis data were employed in the studying of troposphere-stratosphere exchange over the Tibetan Plateau, however, observation data with high spatial and temporal resolutions are still very lack, which are essential for studying troposphere-stratosphere exchange.
This article presents ozone measurements from a mobile ozone lidar located in the Tibetan Plateau, and study the troposphere-stratosphere exchange by using ozone as a tracer. Due to the high altitude, there are few lidar operated in the Tibetan Plateau. The lidar employed in the article has a capability of profiling ozone and temperature in the troposphere and stratosphere synchronously with high spatial and temporal resolutions, and the lidar data are very valuable for the atmospheric studying over the Tibetan Plateau. The job in the article is a good attempt to study the troposphere-stratosphere exchange by using ozone lidar data in the Tibetan Plateau. The consistency of the lidar measurements and ERA5 data indicated the reasonable of the EAR5 data over the Tibetan Plateau, and more details could be found in the lidar data, and these details could provide more information of the troposphere-stratosphere exchange.
There are some comments as following,
- Line 126, “USTC Ozone lidar shows good consistency the ERA5”, however, in the figure 3(b), the peak value of the ozone concentration profile from ERA5 is obviously lager than the peak value from lidar.
- Line 171, the vertical resolution of the temperature profile from ERA5 for tropopause determination should be given.
- The time in the article is the local time or UTC?
Citation: https://doi.org/10.5194/egusphere-2026-3261-CC2 -
AC5: 'Reply on CC2', Ruichun Dong, 21 Aug 2026
General Remarks
Because of unique terrain and atmospheric circulation, the Tibetan Plateau is a hotspot for studying troposphere-stratosphere exchange. Observation data from spaceborne sensors and reanalysis data were employed in the studying of troposphere-stratosphere exchange over the Tibetan Plateau, however, observation data with high spatial and temporal resolutions are still very lack, which are essential for studying troposphere-stratosphere exchange.
This article presents ozone measurements from a mobile ozone lidar located in the Tibetan Plateau, and study the troposphere-stratosphere exchange by using ozone as a tracer. Due to the high altitude, there are few lidar operated in the Tibetan Plateau. The lidar employed in the article has a capability of profiling ozone and temperature in the troposphere and stratosphere synchronously with high spatial and temporal resolutions, and the lidar data are very valuable for the atmospheric studying over the Tibetan Plateau. The job in the article is a good attempt to study the troposphere-stratosphere exchange by using ozone lidar data in the Tibetan Plateau. The consistency of the lidar measurements and ERA5 data indicated the reasonable of the EAR5 data over the Tibetan Plateau, and more details could be found in the lidar data, and these details could provide more information of the troposphere-stratosphere exchange.
The article could be accepted and published.
Our Response:
We sincerely thank the reviewer for the positive assessment of our manuscript and for recognizing the scientific value of the simultaneous high-resolution ozone and temperature lidar observations over the Tibetan Plateau. We also appreciate the reviewer’s recognition that the lidar data provide fine-scale information complementary to satellite and ERA5 datasets. Following the reviewer’s comments, we have carefully revised the manuscript to improve its methodological description, physical interpretation, uncertainty discussion, and overall clarity. We are grateful for the constructive suggestions and recommendation for publication.
Comments and Suggestions #1
- Line 126, “USTC Ozone lidar shows good consistency the ERA5”, however, in the figure 3(b), the peak value of the ozone concentration profile from ERA5 is obviously lager than the peak value from lidar.
Our Response:
Thank you very much for your helpful comment and suggestion. Our interpretation is as follows. ERA5 is a gridded reanalysis product that represents an analyzed atmospheric state over a finite horizontal grid cell, model level, and temporal sampling interval. Therefore, even after the ERA5 data are interpolated to the lidar site and to an altitude of 25 km, the ERA5 and lidar results do not represent strictly identical quantities because of their different spatial, vertical, and temporal representativeness.
Another possible explanation is that the ozone retrievals over approximately 20-32 km are based on the N₂ Raman backscatter signals. The reduced effective vertical resolution at these altitudes, together with the smoothing applied during the retrieval, may attenuate sharp ozone maxima and produce a smoothing-induced reduction in peak amplitude. Nevertheless, the main focus of the present study is the tropopause region between approximately 14 and 17 km, where the retrieved ozone profiles show no apparent abnormal behavior.
Comments and Suggestions #2
- Line 171, the vertical resolution of the temperature profile from ERA5 for tropopause determination should be given.
Our Response:
Thank you very much for your helpful comment and suggestion. For the PV-based dynamical-tropopause diagnosis, the ERA5 fields were treated in pressure coordinates and vertically interpolated at uniform intervals of 0.5 hPa. For the initial ERA5-based screening of the event, however, the thermodynamic tropopause was identified using the height and temperature information corresponding to each interpolated pressure level, following the WMO lapse-rate criterion.
Comments and Suggestions #3
- The time in the article is the local time or UTC?
Our Response:
Thank you for this question. All times reported in the manuscript are given in Coordinated Universal Time (UTC), rather than local time.
Citation: https://doi.org/10.5194/egusphere-2026-3261-AC5
-
RC3: 'Comment on egusphere-2026-3261', Anonymous Referee #3, 06 Aug 2026
Because of unique terrain and atmospheric circulation, the Tibetan Plateau is a hotspot for studying troposphere-stratosphere exchange. Observation data from spaceborne sensors and reanalysis data were employed in the studying of troposphere-stratosphere exchange over the Tibetan Plateau, however, observation data with high spatial and temporal resolutions are still very lack, which are essential for studying troposphere-stratosphere exchange.
This article presents ozone measurements from a mobile ozone lidar located in the Tibetan Plateau, and study the troposphere-stratosphere exchange by using ozone as a tracer. Due to the high altitude, there are few lidar operated in the Tibetan Plateau. The lidar employed in the article has a capability of profiling ozone and temperature in the troposphere and stratosphere synchronously with high spatial and temporal resolutions, and the lidar data are very valuable for the atmospheric studying over the Tibetan Plateau. The job in the article is a good attempt to study the troposphere-stratosphere exchange by using ozone lidar data in the Tibetan Plateau. The consistency of the lidar measurements and ERA5 data indicated the reasonable of the EAR5 data over the Tibetan Plateau, and more details could be found in the lidar data, and these details could provide more information of the troposphere-stratosphere exchange.
The article could be accepted and published.
There are some comments as following,
- Line 126, “USTC Ozone lidar shows good consistency the ERA5”, however, in the figure 3(b), the peak value of the ozone concentration profile from ERA5 is obviously lager than the peak value from lidar.
- Line 171, the vertical resolution of the temperature profile from ERA5 for tropopause determination should be given.
- The time in the article is the local time or UTC?
Citation: https://doi.org/10.5194/egusphere-2026-3261-RC3 -
AC4: 'Reply on RC3', Ruichun Dong, 21 Aug 2026
The comment was uploaded in the form of a supplement: https://egusphere.copernicus.org/preprints/2026/egusphere-2026-3261/egusphere-2026-3261-AC4-supplement.pdf
Peer review completion
Journal article(s) based on this preprint
Viewed
| HTML | XML | Total | BibTeX | EndNote | |
|---|---|---|---|---|---|
| 263 | 107 | 45 | 415 | 36 | 27 |
- HTML: 263
- PDF: 107
- XML: 45
- Total: 415
- BibTeX: 36
- EndNote: 27
Viewed (geographical distribution)
| Country | # | Views | % |
|---|
| Total: | 0 |
| HTML: | 0 |
| PDF: | 0 |
| XML: | 0 |
- 1
Ruichun Dong
Xin Fang

Chengyun Yang
The requested preprint has a corresponding peer-reviewed final revised paper. You are encouraged to refer to the final revised version.
- Preprint
(5717 KB) - Metadata XML
Dear authors
I had a brief look at your interesting lidar observations over Tibet. And I then noticed that you used the Wei (1987) method to quantify STE. While this method was pioneering 40 years ago, it is no longer state-of-the-art. You even reference the paper by Wirth and Egger (1999) who studied in great detail the reliability of the Wei method. Wirth and Egger concluded that "... versions of Wei's formula which predominantly draw on standard information [as you do in your study] ... turn out to be unreliable". The Wei method yields very noisy fields (as also see in your Figs. 9 and 10) and Wirth and Egger even showed that the method yields non-zero STE in a "conservative simulation" where no PV modification occurred and therefore STE should be zero. I invite you to consider using a more robust and more modern method to quantify STE in your study - we should not use methods any longer that were shown to be unreliable.
With best regards,
Heini Wernli