
the Creative Commons Attribution 4.0 License.
the Creative Commons Attribution 4.0 License.
 | 19 Jun 2026
An underappreciated cyclonic-like circulation drives high summer ozone in North China Plain
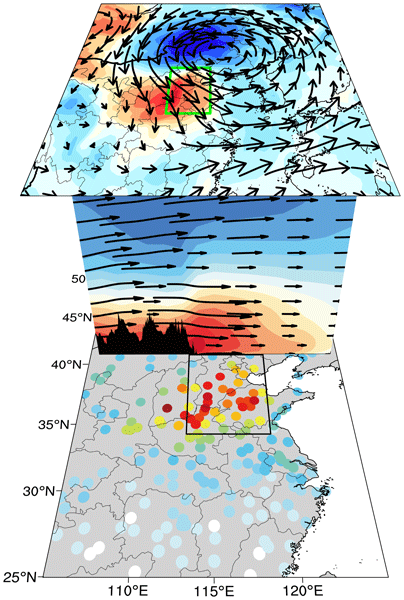
Abstract. China continues to experience severe ozone pollution, particularly over the North China Plain (NCP) during summer. Ozone pollution is generally considered to be associated with anticyclonic circulation. However, this study reveals that a previously underappreciated cyclonic-like circulation also plays a substantial role in ozone pollution over the NCP. Based on a systematic analysis of summertime observations from 2017 to 2022, we identify 209 ozone pollution days, 60 of which are associated with cyclonic-like circulation. Under cyclonic-like circulation, northwesterly winds prevail over the NCP. As the airflow crosses the Taihang Mountains, it undergoes adiabatic descent and induce foehn winds, leading to anomalous warming (+1.78 °C) and drying (−15 %) in the western NCP. Foehn-induced warming substantially enhances ozone photochemical production, resulting in severe ozone pollution over the western NCP, with MDA8 ozone concentrations exceeding 102.2 ppb. In addition, subsiding airflow transports ozone-rich air from the residual layer downward, leading to elevated nighttime ozone along the leeward foothills. Consequently, the impact of cyclonic-like circulation on ozone pollution is characterized by pronounced spatial heterogeneity, in contrast to the relatively uniform ozone enhancement over the NCP under anticyclonic circulation. More importantly, the frequency of cyclonic-like circulation exhibits an increasing trend during 1980–2024, suggesting its growing importance in modulating ozone pollution. We further demonstrate that emission control strategies should be tailored to different circulations. Under cyclonic-like circulation, local emission reductions within the NCP are most effective, whereas under anticyclonic circulation, reductions in the adjacent southeastern region yield greater mitigation benefits.
-
Notice on discussion status
The requested preprint has a corresponding peer-reviewed final revised paper. You are encouraged to refer to the final revised version.
-
Preprint
(3396 KB)
-
Supplement
(2905 KB)
-
The requested preprint has a corresponding peer-reviewed final revised paper. You are encouraged to refer to the final revised version.
- Preprint
(3396 KB) - Metadata XML
-
Supplement
(2905 KB) - BibTeX
- EndNote
- Final revised paper


Journal article(s) based on this preprint
Interactive discussion
Status: closed
-
RC1: 'Comment on egusphere-2026-3245', I. Pérez, 25 Jun 2026
- AC1: 'Reply on RC1', Xipeng Jin, 25 Aug 2026
-
RC2: 'Comment on egusphere-2026-3245', Anonymous Referee #2, 30 Jun 2026
Qiao et al identified a new cyclonic-like circulation (CC) pattern that enhanced the summertime ozone in North China. This finding contrasts with the traditional perspective that high ozone occurs under anticyclonic circulation (AC), but authors provide sound evidence and represent a very clean and convincing foehn-related mechanism. The manuscript is written well and easy to follow. I would recommend it to be published in ACP, while the following concerns need to be addressed.
- The meteorological field data is solely from MERRA2, while it is questionable whether the global re-analyzed data can reliably capture the topographic effects? Could authors incorporate other independent observational data, e.g. data from ground-level sites or soundings, to have a robust calibration on the foehn mechanism?
- The classification of different circulations seems oversimplified. Authors only used the averaged north-westerly winds across a transect to identify the CC, and assumed the remaining ozone polluted days are controlled by AC. To what extent that the transect wind can represent the circulations over North China? Can authors provide more detailed evidences, e.g. the absolute wind fields on individual days, to justify this classification?
- If the foehn wind is from mountain area, how do BVOC emissions contribute to the ozone enhancement besides the heating and drying effects? Could authors add one more sensitivity experiment to test it?
Minor suggestions:
- Title: as the CC days are still much less than the AC days, it is improper to claim CC ‘drives’ the summer ozone pollution.
- Lines 24-26: Please specify the spatial heterogeneity.
- Line 41-42: It is not clear what the value of 220 ug m-3 represents. Does it refer to a regional average or to specific cities? Does it occur on a particular extreme day, or does it represent a monthly mean?
- Fig. 1and Fig. S1: Could authors merge them into one figure? Or at least modify the Fig. S1, where the lines with different colours are very unclear and confusing.
- Line 99: Cannot access the link, the same as the data availability statement.
- Fig.4: What do the upper-left numbers indicate? If they represent the averaged ozone concentrations, why is the AC anomaly significantly higher than CC anomaly while their averaged concentrations are similar?
- Fig. 5: I suggest to directly name the site groups, such as ‘western sites’ and ‘central and eastern sites’, instead of using ‘types 1 and type 2’.
- Lines 303-305: Please also add the absolute statistical metrics, e.g. mean bias or RMSE.
- Fig. 7: How was the AC trend?
Citation: https://doi.org/10.5194/egusphere-2026-3245-RC2 - AC2: 'Reply on RC2', Xipeng Jin, 25 Aug 2026
Peer review completion


Interactive discussion
Status: closed
-
RC1: 'Comment on egusphere-2026-3245', I. Pérez, 25 Jun 2026
This is a quite complete study about the ozone concentrations in the North China Plain under cyclonic and anticyclonic circulations and orographic effects play a main role. Observations were obtained from a network that includes 39 urban stations. Summertime observations (June-August) were considered during 2017-2022. Simulations with the GEOS-Chem model were conducted during June of 2017-2022. Moreover, 5 June 2022 was selected by way of example. Since the paper is quite elaborated, only some minor changes are required for establishing the paper restrictions.
Firstly, the authors should indicate if cyclonic circulation is thermally induced. A comparison with similar situations around the world would increase the potential readers
Ozone concentrations are different in urban and rural environments. In consequence, maps showing the ozone spatial distribution present this contrast where cities highlight as ozone sinks due to the precursor levels, whereas ozone concentrations are higher at rural sites. This contrast is not observed in the presented maps. Perhaps the model resolution does not allow the definition of cities. In addition, only cities are used in this study, where precursors play a main role. A comment about the ozone concentrations at rural sites would increase the paper value.
Varied periods are employed. For instance, observations cover the summertime, whereas simulations are restricted to June. The authors should comment possible implications of this time disagreement on the obtained results. Moreover, Figure 7 extends for 45 years, whereas 5 June 2022 is highlighted for specific results. The convenience of all these time intervals should be justified.
At the end of the paper, the authors present the model response under three types of precursor reductions, such as 10, 30 and 50%. Since such reductions should have a noticeable impact on the human activity due to the affected sources, perhaps potential readers wonder if such reductions are realistic and if expected results agree with those from the model, i.e., if the model was tested under such conditions.
Citation: https://doi.org/10.5194/egusphere-2026-3245-RC1 - AC1: 'Reply on RC1', Xipeng Jin, 25 Aug 2026
-
RC2: 'Comment on egusphere-2026-3245', Anonymous Referee #2, 30 Jun 2026
Qiao et al identified a new cyclonic-like circulation (CC) pattern that enhanced the summertime ozone in North China. This finding contrasts with the traditional perspective that high ozone occurs under anticyclonic circulation (AC), but authors provide sound evidence and represent a very clean and convincing foehn-related mechanism. The manuscript is written well and easy to follow. I would recommend it to be published in ACP, while the following concerns need to be addressed.
- The meteorological field data is solely from MERRA2, while it is questionable whether the global re-analyzed data can reliably capture the topographic effects? Could authors incorporate other independent observational data, e.g. data from ground-level sites or soundings, to have a robust calibration on the foehn mechanism?
- The classification of different circulations seems oversimplified. Authors only used the averaged north-westerly winds across a transect to identify the CC, and assumed the remaining ozone polluted days are controlled by AC. To what extent that the transect wind can represent the circulations over North China? Can authors provide more detailed evidences, e.g. the absolute wind fields on individual days, to justify this classification?
- If the foehn wind is from mountain area, how do BVOC emissions contribute to the ozone enhancement besides the heating and drying effects? Could authors add one more sensitivity experiment to test it?
Minor suggestions:
- Title: as the CC days are still much less than the AC days, it is improper to claim CC ‘drives’ the summer ozone pollution.
- Lines 24-26: Please specify the spatial heterogeneity.
- Line 41-42: It is not clear what the value of 220 ug m-3 represents. Does it refer to a regional average or to specific cities? Does it occur on a particular extreme day, or does it represent a monthly mean?
- Fig. 1and Fig. S1: Could authors merge them into one figure? Or at least modify the Fig. S1, where the lines with different colours are very unclear and confusing.
- Line 99: Cannot access the link, the same as the data availability statement.
- Fig.4: What do the upper-left numbers indicate? If they represent the averaged ozone concentrations, why is the AC anomaly significantly higher than CC anomaly while their averaged concentrations are similar?
- Fig. 5: I suggest to directly name the site groups, such as ‘western sites’ and ‘central and eastern sites’, instead of using ‘types 1 and type 2’.
- Lines 303-305: Please also add the absolute statistical metrics, e.g. mean bias or RMSE.
- Fig. 7: How was the AC trend?
Citation: https://doi.org/10.5194/egusphere-2026-3245-RC2 - AC2: 'Reply on RC2', Xipeng Jin, 25 Aug 2026
Peer review completion
Journal article(s) based on this preprint
Viewed
| HTML | XML | Total | Supplement | BibTeX | EndNote | |
|---|---|---|---|---|---|---|
| 113 | 66 | 42 | 221 | 39 | 34 | 37 |
- HTML: 113
- PDF: 66
- XML: 42
- Total: 221
- Supplement: 39
- BibTeX: 34
- EndNote: 37
Viewed (geographical distribution)
| Country | # | Views | % |
|---|
| Total: | 0 |
| HTML: | 0 |
| PDF: | 0 |
| XML: | 0 |
- 1
Wenhao Qiao
Xipeng Jin

Ziyu Long
Zhenjiang Yang
Lei Chen
Hong Liao
The requested preprint has a corresponding peer-reviewed final revised paper. You are encouraged to refer to the final revised version.
- Preprint
(3396 KB) - Metadata XML
-
Supplement
(2905 KB) - BibTeX
- EndNote
- Final revised paper
This is a quite complete study about the ozone concentrations in the North China Plain under cyclonic and anticyclonic circulations and orographic effects play a main role. Observations were obtained from a network that includes 39 urban stations. Summertime observations (June-August) were considered during 2017-2022. Simulations with the GEOS-Chem model were conducted during June of 2017-2022. Moreover, 5 June 2022 was selected by way of example. Since the paper is quite elaborated, only some minor changes are required for establishing the paper restrictions.
Firstly, the authors should indicate if cyclonic circulation is thermally induced. A comparison with similar situations around the world would increase the potential readers
Ozone concentrations are different in urban and rural environments. In consequence, maps showing the ozone spatial distribution present this contrast where cities highlight as ozone sinks due to the precursor levels, whereas ozone concentrations are higher at rural sites. This contrast is not observed in the presented maps. Perhaps the model resolution does not allow the definition of cities. In addition, only cities are used in this study, where precursors play a main role. A comment about the ozone concentrations at rural sites would increase the paper value.
Varied periods are employed. For instance, observations cover the summertime, whereas simulations are restricted to June. The authors should comment possible implications of this time disagreement on the obtained results. Moreover, Figure 7 extends for 45 years, whereas 5 June 2022 is highlighted for specific results. The convenience of all these time intervals should be justified.
At the end of the paper, the authors present the model response under three types of precursor reductions, such as 10, 30 and 50%. Since such reductions should have a noticeable impact on the human activity due to the affected sources, perhaps potential readers wonder if such reductions are realistic and if expected results agree with those from the model, i.e., if the model was tested under such conditions.