
the Creative Commons Attribution 4.0 License.
the Creative Commons Attribution 4.0 License.
 | 29 Jun 2026
Meteosat Third Generation Lightning Imager Detection Performances
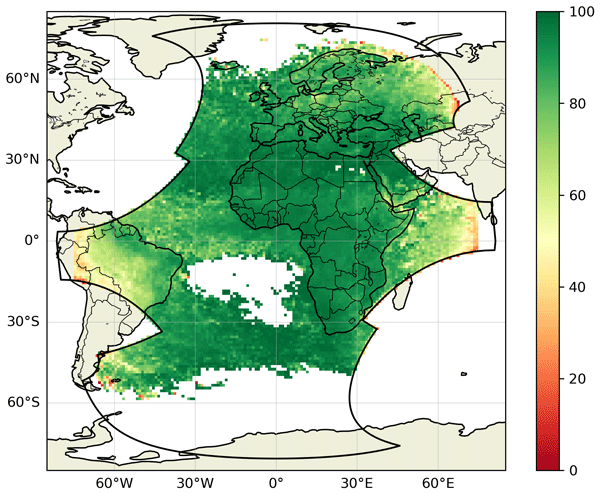
Abstract. The EUMETSAT Meteosat Third Generation Lightning Imager (MTG-LI) is the brand-new European space-based lightning location system devoted to the diagnostic and characterization of lightning activity over hemispheric scale. In this publication, we present the assessment of MTG-LI detection performances against three different reference systems: the Vaisala Global Lightning Detection Network (GLD360), the European Consortium for Lightning Detection (EUCLID), and Geostationary Lightning Mappers (GLMs) -16 and -19 aboard NOAA GOES satellites. The analysis period is of eighteen months: from July 2024 to December 2025. MTG-LI flash detection efficiency varies between 70 % (day) and 95 % (night), with an average value of 87.4 %. Its average flash false alarm rate is generally below 0.5 flashes per second, while the average fraction of false flashes is 0.16 % of the total flashes. Finally, both average timing and location accuracy are presented and discussed.
Competing interests: At least one of the (co-)authors serves as editor for the special issue to which this paper belongs.
Publisher's note: Copernicus Publications remains neutral with regard to jurisdictional claims made in the text, published maps, institutional affiliations, or any other geographical representation in this paper. While Copernicus Publications makes every effort to include appropriate place names, the final responsibility lies with the authors. Views expressed in the text are those of the authors and do not necessarily reflect the views of the publisher.-
Notice on discussion status
The requested preprint has a corresponding peer-reviewed final revised paper. You are encouraged to refer to the final revised version.
-
Preprint
(5799 KB)
-
The requested preprint has a corresponding peer-reviewed final revised paper. You are encouraged to refer to the final revised version.
- Preprint
(5799 KB) - Metadata XML
- BibTeX
- EndNote
- Final revised paper


Journal article(s) based on this preprint
Interactive discussion
Status: closed
-
RC1: 'Comment on egusphere-2026-3177', Douglas Mach, 28 Jul 2026
This manuscript is an excellent description of the LI data and system. I believe this manuscript, once published, will be one of the first papers to be read by anyone wanting to use the LI data. The links to the user guide and software will be quite useful to users of the LI data. As such, I have been a bit "picky" about my suggestions so that the manuscript will be the best it can be. I suggest it be published with very minor revisions.
Specific Minor Issues
Line 1: delete “brand-new”.
Line 17: add comma after “(Grebovi´c et al., 2025)”.
Line 19: add comma after “(or location accuracy)”.
Line 26: replace “two big families” with “two major families”.
Lines 31-32: Need a reference for the statement starting with “The accuracy with which such systems describe…”.
Line 32: replace “LF and VLF LLSs one gets…” with “LF and VLF LLSs one gains…”.
Line 40: using the phrase “visible photons” implies that the optical signals from lightning detected by the LI are in the visible range. The ones I am familiar with are near-infrared, outside of the visible range. I would simply delete the word “visible” and add a phrase about the optical signal usually being in the near-infrared (and the specific spectral line at 777.4 nm).
Line 42: same issue as in line 40. Remove the word “visible”.
Line 42: the authors should reference the work of Koshak and others (e.g., DOI: 10.1175/JTECH-D-14-00085.1) that use statistical methods to estimate the IC/CG ratio of satellite based lightning data.
Line 53: replace “flying aboard” with “on”.
Line 56: replace “globe since several” with “globe for several”.
Line 60: replace “Table 1 resumes” with “Table 1 presents the”.
Line 62: The statement starting with “Space-based geostationary LLSs are superior to…” needs a reference to support it.
Line 80: replace “sense optical photons emitted in correspondence of lightning” with “sense optical photons emitted by lightning”.
Lines 82-83: this statement about the optical band for LI should be included in the discussion of the other orbital optical instruments, since they use the same oxygen triplet emission line.
Line 84: The authors should also provide the spatial sampling range of LI (from 4.5 km at nadir to X km near the edges of the detectors). Note, the second figure from Figure 1 in the LI user guide (https://user.eumetsat.int/resources/user-guides/mtg-li-level-2-data-guide) would be perfect.
Line 94: comma after “direct sunlight”.
Lines 108-110: the authors should state if the lightning locations are computed to the ground or some other “lightning ellipse”. The authors should also state if the times of the lightning are corrected for time of flight. Both of these bits of information are critical for users wanting to analyze the lightning data from LI.
Line 118: the authors should also state if the individual events are made available to the public and if those events are geolocated (to what altitude) and if they are time of flight corrected. The GLMs and LISs provide geolocated, time of flight corrected event data.
Line 118: At the end of this paragraph would be a good place to state if the data in the group and flash products are time of flight corrected.
Lines 129-131: Are there filters in the LI processing stream that remove known non-lightning sources?
Line 194: thank you for providing a link to code to correct time of flight and parallax.
Line 257: The authors should add an additional figure showing the overall distribution of location accuracy represented by Figure 5 (a single distribution with the X axis being km and the Y axis being counts).
Line 261: The authors should add an additional figure showing the overall distribution of time accuracy (a single distribution with the X axis being ms and the Y axis being counts).
Line 329: add a comma after “above 50◦ N” and after “FDE ≈ 80%”.
Line 378: remove the word “also”.
Line 380: remove the word “also”.
Line 431: remove comma after “et al.” and add “(“.
Lines 447-448: the sentence starting with “MTG-LI TA…” is confusing in its present form. I am not sure how to fix it, but please try to reword it. Maybe “MTG-LI TA is less than 1 ms over the entire reference period except for a few episodes of limited temporal duration.” My suggestion may not convey what you wanted, so you should try your own fix.
Line 448: change the phrase “…are related with outages…” to “…are related to outages…”.
Line 459: replace the phrase “…deviations from this mean pattern are met only on a limited number of…” with “…deviations from this mean pattern occur only in a limited number of…”
Lines 466-468: It would be interesting to recompute the overall FFAR values excluding those time periods (and locations) where there are known problems with the LI processing. It would provide the reader with more of the “true” FFAR value for LI.
Figure 3: Please make the various lines in the figure thicker. It will make them easier to read.
Figure 4: as mentioned earlier, the authors should add a line plot (extra figure) showing the distribution of LA for the whole dataset.
Citation: https://doi.org/10.5194/egusphere-2026-3177-RC1 -
AC1: 'Reply on RC1', Bartolomeo Viticchie, 01 Sep 2026
This manuscript is an excellent description of the LI data and system. I believe this manuscript, once published, will be one of the first papers to be read by anyone wanting to use the LI data. The links to the user guide and software will be quite useful to users of the LI data. As such, I have been a bit "picky" about my suggestions so that the manuscript will be the best it can be. I suggest it be published with very minor revisions.
We sincerely thank Referee #1 for these encouraging and complimentary words, as well as for the meticulous review of our manuscript. We are delighted that the reviewer recognizes the value of this work as a primary reference for future MTG-LI data users. We greatly appreciate the thoughtful, detailed suggestions provided to help polish the manuscript, and we have addressed every point raised to ensure the paper is as accurate, thorough, and clear as possible.
Specific Minor Issues:
Line 1: delete “brand-new”.
Done
Line 17: add comma after “(Grebovi´c et al., 2025)”.
Done
Line 19: add comma after “(or location accuracy)”.
Done
Line 26: replace “two big families” with “two major families”.
Done
Lines 31-32: Need a reference for the statement starting with “The accuracy with which such systems describe…”.
Done
Line 32: replace “LF and VLF LLSs one gets…” with “LF and VLF LLSs one gains…”.
Done
Line 40: using the phrase “visible photons” implies that the optical signals from lightning detected by the LI are in the visible range. The ones I am familiar with are near-infrared, outside of the visible range. I would simply delete the word “visible” and add a phrase about the optical signal usually being in the near-infrared (and the specific spectral line at 777.4 nm).
Done. Because of the changes to the text, part of Section 2 (namely Lines 80 and 81) were modified to avoid duplicating information.
Line 42: same issue as in line 40. Remove the word “visible”.
Done
Line 42: the authors should reference the work of Koshak and others (e.g., DOI: 10.1175/JTECH-D-14-00085.1) that use statistical methods to estimate the IC/CG ratio of satellite based lightning data.
Done
Line 53: replace “flying aboard” with “on”.
Done
Line 56: replace “globe since several” with “globe for several”.
Done
Line 60: replace “Table 1 resumes” with “Table 1 presents the”.
Done
Line 62: The statement starting with “Space-based geostationary LLSs are superior to…” needs a reference to support it.
The statement should be read together with the following one. The author modified the text to relate the two statements and included two additional references to support the point.
Line 80: replace “sense optical photons emitted in correspondence of lightning” with “sense optical photons emitted by lightning”.
Lines 82-83: this statement about the optical band for LI should be included in the discussion of the other orbital optical instruments, since they use the same oxygen triplet emission line.
This information is now available in Section 1 and has been removed from Section 2 to avoid duplicating information.
Line 84: The authors should also provide the spatial sampling range of LI (from 4.5 km at nadir to X km near the edges of the detectors). Note, the second figure from Figure 1 in the LI user guide (https://user.eumetsat.int/resources/user-guides/mtg-li-level-2-data-guide) would be perfect.
Done. In addition, the new figure was referenced in the document. In particular, in the discussion of the MTG-LI Location Accuracy (LA).
Line 94: comma after “direct sunlight”.
Done
Lines 108-110: the authors should state if the lightning locations are computed to the ground or some other “lightning ellipse”. The authors should also state if the times of the lightning are corrected for time of flight. Both of these bits of information are critical for users wanting to analyze the lightning data from LI.
Line 118: the authors should also state if the individual events are made available to the public and if those events are geolocated (to what altitude) and if they are time of flight corrected. The GLMs and LISs provide geolocated, time of flight corrected event data.
Line 118: At the end of this paragraph would be a good place to state if the data in the group and flash products are time of flight corrected.
Line 194: thank you for providing a link to code to correct time of flight and parallax.
As described in Section 3, comparing MTG-LI data with ground-based observations requires corrections for both parallax and light travel time. We appreciate the referee’s acknowledgment regarding the code provided for these corrections.
More broadly, while the comprehensive operational details requested in these comments are fully documented in the MTG-LI User Guide (linked in Section 2), we believe the manuscript itself should remain focused on information directly relevant to the core analyses presented in the subsequent sections. Because the primary objective of this manuscript is to evaluate and communicate MTG-LI detection performances rather than serve as a supplementary user manual, we have kept these background details concise, directing interested readers to the linked User Guide.
Lines 129-131: Are there filters in the LI processing stream that remove known non-lightning sources?
As highlighted in Section 5, the draft already notes that significant local increases in the Flash False Alarm Rate are confined to limited episodes driven by specific observational conditions—such as solar stray light near the FOV or Sun glint—as well as instrument artifacts like the parallel features caused by heightened Read-Out Noise (RON). Because these identified sources represent localized, secondary contributions rather than the primary driver of the overall FFAR, dedicated filters for them were not implemented in the initial baseline. However, to address these minor sources, an adapted version of a filter originally designed for RTS-like (Random Telegraph Signal) noise is currently undergoing testing.
Line 257: The authors should add an additional figure showing the overall distribution of location accuracy represented by Figure 5 (a single distribution with the X axis being km and the Y axis being counts).
Line 261: The authors should add an additional figure showing the overall distribution of time accuracy (a single distribution with the X axis being ms and the Y axis being counts).
Done. A new 2D histogram has been created and included in the manuscript. To be noted, in the parts discussing the Location Accuracy (LA) an effort was made to remove the ambiguity between LA and location offset.
Line 329: add a comma after “above 50◦ N” and after “FDE ≈ 80%”.
Done
Line 378: remove the word “also”.
Done
Line 380: remove the word “also”.
Done
Line 431: remove comma after “et al.” and add “(“.
Done
Lines 447-448: the sentence starting with “MTG-LI TA…” is confusing in its present form. I am not sure how to fix it, but please try to reword it. Maybe “MTG-LI TA is less than 1 ms over the entire reference period except for a few episodes of limited temporal duration.” My suggestion may not convey what you wanted, so you should try your own fix.
Line 448: change the phrase “…are related with outages…” to “…are related to outages…”.
The author re-wrote the sentence.
Line 459: replace the phrase “…deviations from this mean pattern are met only on a limited number of…” with “…deviations from this mean pattern occur only in a limited number of…”
Done
Lines 466-468: It would be interesting to recompute the overall FFAR values excluding those time periods (and locations) where there are known problems with the LI processing. It would provide the reader with more of the “true” FFAR value for LI.
We thank the referee for this valid observation. To address this, significant effort was dedicated to screening the dataset and ensuring the highest possible data quality for the performance assessment. Specifically, periods corresponding to operational outages—in both the MTG-LI production and the ground-based reference datasets—were strictly excluded from the analysis. As a result, we consider the reported Flash False Alarm Rate (FFAR) assessment to be highly robust against missing-data artifacts.
Figure 3: Please make the various lines in the figure thicker. It will make them easier to read.
Done
Figure 4: as mentioned earlier, the authors should add a line plot (extra figure) showing the distribution of LA for the whole dataset.
Done
Citation: https://doi.org/10.5194/egusphere-2026-3177-AC1
-
AC1: 'Reply on RC1', Bartolomeo Viticchie, 01 Sep 2026
-
RC2: 'Comment on egusphere-2026-3177', Anonymous Referee #2, 11 Aug 2026
The manuscript gives a good and thorough analysis of the key performance metrics of the new Lightning Imager, evaluating location accuracy, detection efficiency, and false alarm rate in relation to key ground-based (GLD360 and EUCLID) and satellite-based (GLM16, GLM19) lightning detection systems. The manuscript is well-organized, and the explanations of why the performance metrics vary geographically or temporally are notably clear. Once published, the paper will be a valuable resource to those using the MTG LI data for scientific research or operational monitoring. I recommend minor revision and have listed below some suggestions for the authors’ consideration.
Major comment:
The authors use a very broad window when calculating LI’s false alarm rate: +/-10 minutes and 10 pixels (1 degree, or 111 km). Studies of GLM performance have also used broad temporal windows (on the order of minutes), and Virts et al. (2023, https://doi.org/10.1175/JTECH-D-22-0050.1) demonstrated that broad temporal windows are needed to accurately estimate FAR when comparing with LLSs with limited detection ability. However, the broadest spatial window I can recall for FAR analysis in past studies is 50 km. The spatial window used in this study is thus more than twice as broad as the standard, with the risk that the reported FFAR is too low because flashes are deemed legitimate even if there is no thunderstorm in the immediate area. The authors address this on L464-467, but the explanation is brief and lacking in detail. They should justify this choice, and it would be helpful to state what the FFAR would be if a more standard matching window were used.
Minor comments:
L23: I’m not sure why it is necessary to define an assumption about the IC/CG ratio. Maybe sufficient to just state the general values based on previous research?
L55: GOES-East is at 75.2W, and GOES-West is at 137W
L85: Please also describe how LI’s spatial sampling changes with zenith angle. What is the resolution near the FOV edge? This also seems relevant to mention on L289-290.
L133: Literally, a decision to achieve the highest possible detection efficiency would probably involve no filtering at all. It might be more accurate to say “to achieve higher detection efficiency.”
Consider adding a figure (or a panel to Fig. 6) showing the % of false flashes (often called the FAR) at each grid point. The reader can try to deduce this by comparing the existing panels of Fig. 6, but it would be helpful to show it explicitly.
L255: Is there reason to think that GLD360’s location accuracy is lower over the ocean, which might also contribute to this?
L310: One could argue that EUCLID is not the best ground-based LLS in continental Europe, that an LMA is “better” (more sensitive) although for a limited region. Consider rewording.
L300-321: This is a long paragraph with a lot of information—consider splitting it in two, perhaps separate paragraphs for continental Europe and Africa.
L319-320: Assuming that EUCLID designates flashes as IC or CG, it would be very interesting to include statistics on MTG-LI’s DE vs the two flash types.
L329: The GLM fields of view extend to 55-56N. This should also be corrected in Table 1. May also need to check the observing angles cited on L509.
L329-330: To my eye, the FDE value at 70N appears much lower than 80%, but it’s difficult to tell since the curve is so steep. Consider adding grid lines within the plot so the values can be identified more clearly.
L365-366: Consider adding a couple sentences summarizing how LI’s performance vs an LMA compares with the performance metrics you’ve presented.
L369-370: GLM also has larger pixel size near the FOV edges (from 8 km at the satellite subpoint to 14 km near the edge). This should also be corrected in Table 1.
L396-407: This is a very good explanation of the diurnal variability in LA that confused me very much when thinking about Fig. 8 and 10. It’s difficult for the reader when those figures were introduced ~100 lines before this explanation was provided.
L400-402: Does this also imply seasonal variations in location accuracy?
L447: The timing accuracy is stated but never shown. Consider adding a figure showing the timing accuracy, either as a histogram or map.
L450-454: Bateman et al. (2021) and Virts et al. (2025) calculate domain-wide GLM FAR differently. Bateman et al. calculate the FAR for each grid box, then average the grid box FAR values to get the domain-wide value. Virts et al. use the same method as in the present manuscript, the domain-total # of false flashes divided by the domain-total # of all flashes.
Table 1: I am no LMI expert, but the coverage area listed in this table seems much smaller than the FOV maps I have seen. Please validate this.
Table 2: Based on this table, an asymmetric stroke/group matching window was used (from 10 ms before to 5 ms after the stroke time). The text should state the reason for this.
FDE is usually plotted as a % ranging from 0-100%. The text describes the FDE values this way, but the figures show fractions from 0-1. Consider scaling the plots.
Figure 3: The plot labels are too small.
Figure 11, left panel: There appear to be values along the coast of Ecuador—were those intended to be masked out?
Grammar comments (note that some may be legitimate differences between British and American English):
L2, 25, and 498: “the diagnosis and”
L5: “period is eighteen”
L16: There’s an extra space before Mitchard
L19: “continuously monitoring”
L22: “to modeling and measuring the ratio”
L23-24: “to comprise” or “to make up”
L26: Missing comma after activity (at the end of the clause)
L26: No comma needed after locate
L35: “progressively loses” – although it’s more accurate to say that the capability of monitoring IC decreases. Even networks such as WWLLN with low DE can detect some IC lightning.
L41-42: Perhaps “any lightning discharge produces visible photons” or “any lightning discharge emits visible photons”
L51: No comma after November 2016
L54: “Zealand”
L56: “for several years”
L60: “Table 1 summarizes”
L71: “of the development”
L80: “emitted by lightning channels”
L87: “defined relative to a”
L99: “for monitoring purposes”
L126: “an LLS” because the letter L sounds like it begins with a vowel
L166-167: “when matching between”
L191: “cloud-top-height”
L202: “detection of CG”
L205-206: “of a few hundred meters”
L214: “Zealand”
L218: No comma after EUCLID
L256: “the Arabian peninsula”
L259-260: “is in line with”
L263: “the total of ## flashes”
L321: “combined with”
L353: “close to the edge of the GLM FOV”. Similarly on L461.
L436: “but quite”
L479: “over the southern Atlantic Ocean” and “the equatorial Atlantic Ocean”
L514: “The locations of such landmarks”
Table 2 caption: “For each LLS”
Citation: https://doi.org/10.5194/egusphere-2026-3177-RC2 -
AC2: 'Reply on RC2', Bartolomeo Viticchie, 01 Sep 2026
The manuscript gives a good and thorough analysis of the key performance metrics of the new Lightning Imager, evaluating location accuracy, detection efficiency, and false alarm rate in relation to key ground-based (GLD360 and EUCLID) and satellite-based (GLM16, GLM19) lightning detection systems. The manuscript is well-organized, and the explanations of why the performance metrics vary geographically or temporally are notably clear. Once published, the paper will be a valuable resource to those using the MTG LI data for scientific research or operational monitoring. I recommend minor revision and have listed below some suggestions for the authors’ consideration.
We sincerely thank Referee #2 for the positive evaluation of our work and for recognizing the value of this manuscript to the scientific and operational lightning communities. We appreciate the reviewer’s thoughtful feedback and constructive comments, particularly regarding the key performance metric analyses. We have taken these suggestions very seriously and carried out additional work to address all the points raised—most notably regarding the Flash False Alarm Rate (FFAR). A detailed, point-by-point response and descriptions of the corresponding revisions are provided below.
Major comment:
The authors use a very broad window when calculating LI’s false alarm rate: +/-10 minutes and 10 pixels (1 degree, or 111 km). Studies of GLM performance have also used broad temporal windows (on the order of minutes), and Virts et al. (2023, https://doi.org/10.1175/JTECH-D-22-0050.1) demonstrated that broad temporal windows are needed to accurately estimate FAR when comparing with LLSs with limited detection ability. However, the broadest spatial window I can recall for FAR analysis in past studies is 50 km. The spatial window used in this study is thus more than twice as broad as the standard, with the risk that the reported FFAR is too low because flashes are deemed legitimate even if there is no thunderstorm in the immediate area. The authors address this on L464-467, but the explanation is brief and lacking in detail. They should justify this choice, and it would be helpful to state what the FFAR would be if a more standard matching window were used.
Thank you for this very valid comment, which helps us improve our discussion on this key point.
The authors are aware that the difference in False Alarm Rate (FAR) between GLM and MTG-LI stems from the different choice of spatial window, and this is now clearly stated in the discussion: “However, an important difference must be highlighted with respect to the configuration of Virts et al. (2025): the spatial window to classify flashes used in our study is more than twice as broad as the one they employ”.
Consequently, the discussion regarding this key configuration parameter has been moved to follow immediately after the comparison between GLM and MTG-LI, addressing this critical point up front. We offer the following explanation (slightly reinforced compared to the original draft): “The use of a much smaller spatial buffer (∆pix in Table 2; initially set at two pixels) would result in a large number of true flashes being misclassified as false at several locations in the MTG-LI FOV. In central Africa, MTG-LI false flashes would clearly resemble true ones when considering their spatial distribution, for example, with sharp count drop between land and ocean or with extended clusters of false flashes following seasonal patterns. The buffer had to be increased to ten pixels to counterbalance the limitations of GLD360 over Africa”.
Minor comments:
L23: I’m not sure why it is necessary to define an assumption about the IC/CG ratio. Maybe sufficient to just state the general values based on previous research?
Done. Referred to a specific publication and presented the value of the ratio IC/CG.
L55: GOES-East is at 75.2W, and GOES-West is at 137W
Done
L85: Please also describe how LI’s spatial sampling changes with zenith angle. What is the resolution near the FOV edge? This also seems relevant to mention on L289-290.
Done. New figures have been included as requested by Referee#1 (Douglas Mach).
L133: Literally, a decision to achieve the highest possible detection efficiency would probably involve no filtering at all. It might be more accurate to say “to achieve higher detection efficiency.”
Done
Consider adding a figure (or a panel to Fig. 6) showing the % of false flashes (often called the FAR) at each grid point. The reader can try to deduce this by comparing the existing panels of Fig. 6, but it would be helpful to show it explicitly.
Done. The same colour table used in Virtz et al. (2025) was used for this new map for direct comparison (see major comment).
L255: Is there reason to think that GLD360’s location accuracy is lower over the ocean, which might also contribute to this?
One cannot find any publication indicating that GLD360 suffers degraded location accuracy over Oceans. In addition, VLF LLSs are known to generally perform better over the oceans due to the conductivity of the environment facilitating VLF signal propagation and detection.
L310: One could argue that EUCLID is not the best ground-based LLS in continental Europe, that an LMA is “better” (more sensitive) although for a limited region. Consider rewording.
The sentence has been removed
L300-321: This is a long paragraph with a lot of information—consider splitting it in two, perhaps separate paragraphs for continental Europe and Africa.
Done
L319-320: Assuming that EUCLID designates flashes as IC or CG, it would be very interesting to include statistics on MTG-LI’s DE vs the two flash types.
Indeed, this is an interesting aspect to explore. We investigated this point and found no significant difference in Flash Detection Efficiency (FDE) between the two families of EUCLID flashes. Although Combarnous et al. (2025) reported two distinct FDE values for the families classified by Météorage—a network with detection performance comparable to EUCLID—the difference remains minor, aligning with our observations. In any case, our study focuses on total lightning activity rather than discriminating between CG and IC flashes. Furthermore, while EUCLID detects approximately 95% of CG flashes, its FDE for IC flashes is less well characterized. We believe the most reliable assessment of MTG-LI performance across both flash families will come from comparisons with ELMA, the results of which will soon be published by Montanyà et al.
L329: The GLM fields of view extend to 55-56N. This should also be corrected in Table 1. May also need to check the observing angles cited on L509.
Done. The E-W extension has been included too. The change was also included in the text.
L329-330: To my eye, the FDE value at 70N appears much lower than 80%, but it’s difficult to tell since the curve is so steep. Consider adding grid lines within the plot so the values can be identified more clearly.
Done. Indeed, at 70 deg N one has FDE = 73%. The text has been updated accordingly. All plots were updated with grids.
L365-366: Consider adding a couple sentences summarizing how LI’s performance vs an LMA compares with the performance metrics you’ve presented.
As indicated in the reference list, the manuscript evaluating the comparison between MTG-LI and ELMA is currently in preparation and awaiting submission. To preserve the integrity of the peer-review process, we intend to withhold the disclosure of these findings until formal publication.
L369-370: GLM also has larger pixel size near the FOV edges (from 8 km at the satellite subpoint to 14 km near the edge). This should also be corrected in Table 1.
Done. Here we included also the reference to the new Figure with the LI spatial sampling.
L396-407: This is a very good explanation of the diurnal variability in LA that confused me very much when thinking about Fig. 8 and 10. It’s difficult for the reader when those figures were introduced ~100 lines before this explanation was provided.
We thank the reviewer for this note. We prefer keeping the Results and Discussion sections separate to keep data presentation distinct from interpretation. To ensure clear navigation across the line gap, the Discussion section explicitly cross-references back to the corresponding findings and figures in the Results section.
L400-402: Does this also imply seasonal variations in location accuracy?
Correct. The Northern Hemisphere—where most MTG-LI landmarks are located—receives significantly less illumination in winter. Consequently, early-operations winter-time LA (e.g., November 2024–February 2025) was slightly less stable. However, EUMETSAT INR experts have since improved processing/configuration, and work is ongoing. To keep our manuscript focused on aggregated/average performance rather than long time series, we have omitted this detail. Users can still inspect historical INR performance via the link in Section 6.
L447: The timing accuracy is stated but never shown. Consider adding a figure showing the timing accuracy, either as a histogram or map.
Done. A new figure was requested by Referee#1 (Douglas Mach).
L450-454: Bateman et al. (2021) and Virts et al. (2025) calculate domain-wide GLM FAR differently. Bateman et al. calculate the FAR for each grid box, then average the grid box FAR values to get the domain-wide value. Virts et al. use the same method as in the present manuscript, the domain-total # of false flashes divided by the domain-total # of all flashes.
See answer to the major comment.
Table 1: I am no LMI expert, but the coverage area listed in this table seems much smaller than the FOV maps I have seen. Please validate this.
Done. The table has been updated.
Table 2: Based on this table, an asymmetric stroke/group matching window was used (from 10 ms before to 5 ms after the stroke time). The text should state the reason for this.
Done. The explanation has been added in the notes to the Table. In addition, the description of the time window was amended.
FDE is usually plotted as a % ranging from 0-100%. The text describes the FDE values this way, but the figures show fractions from 0-1. Consider scaling the plots.
Done
Figure 3: The plot labels are too small.
Done
Figure 11, left panel: There appear to be values along the coast of Ecuador—were those intended to be masked out?
This should be interpreted as random/spurious matches with very poor navigation and/or parallax correction that ended up in those bins at the extreme West of the FOV.
Grammar comments (note that some may be legitimate differences between British and American English):
L2, 25, and 498: “the diagnosis and”
Done
L5: “period is eighteen”
Done
L16: There’s an extra space before Mitchard
Done
L19: “continuously monitoring”
Done
L22: “to modeling and measuring the ratio”
Done
L23-24: “to comprise” or “to make up”
Modified to answer to another comment.
L26: Missing comma after activity (at the end of the clause)
Done
L26: No comma needed after locate
Done
L35: “progressively loses” – although it’s more accurate to say that the capability of monitoring IC decreases. Even networks such as WWLLN with low DE can detect some IC lightning.
Done
L41-42: Perhaps “any lightning discharge produces visible photons” or “any lightning discharge emits visible photons”
Done
L51: No comma after November 2016
Done
L54: “Zealand”
Done
L56: “for several years”
Done
L60: “Table 1 summarizes”
Done
L71: “of the development”
Done
L80: “emitted by lightning channels”
Modified based on a comment of the Referee #1 (Douglas Mach).
L87: “defined relative to a”
Done
L99: “for monitoring purposes”
Done
L126: “an LLS” because the letter L sounds like it begins with a vowel
Done
L166-167: “when matching between”
Done
L191: “cloud-top-height”
Done
L202: “detection of CG”
Done
L205-206: “of a few hundred meters”
Done
L214: “Zealand”
Done
L218: No comma after EUCLID
Done
L256: “the Arabian peninsula”
Done
L259-260: “is in line with”
Done
L263: “the total of ## flashes”
Done
L321: “combined with”
Done
L353: “close to the edge of the GLM FOV”. Similarly on L461.
Done
L436: “but quite”
Done
L479: “over the southern Atlantic Ocean” and “the equatorial Atlantic Ocean”
Done
L514: “The locations of such landmarks”
Done
Table 2 caption: “For each LLS”
Done
Citation: https://doi.org/10.5194/egusphere-2026-3177-AC2
-
AC2: 'Reply on RC2', Bartolomeo Viticchie, 01 Sep 2026
Peer review completion


Interactive discussion
Status: closed
-
RC1: 'Comment on egusphere-2026-3177', Douglas Mach, 28 Jul 2026
This manuscript is an excellent description of the LI data and system. I believe this manuscript, once published, will be one of the first papers to be read by anyone wanting to use the LI data. The links to the user guide and software will be quite useful to users of the LI data. As such, I have been a bit "picky" about my suggestions so that the manuscript will be the best it can be. I suggest it be published with very minor revisions.
Specific Minor Issues
Line 1: delete “brand-new”.
Line 17: add comma after “(Grebovi´c et al., 2025)”.
Line 19: add comma after “(or location accuracy)”.
Line 26: replace “two big families” with “two major families”.
Lines 31-32: Need a reference for the statement starting with “The accuracy with which such systems describe…”.
Line 32: replace “LF and VLF LLSs one gets…” with “LF and VLF LLSs one gains…”.
Line 40: using the phrase “visible photons” implies that the optical signals from lightning detected by the LI are in the visible range. The ones I am familiar with are near-infrared, outside of the visible range. I would simply delete the word “visible” and add a phrase about the optical signal usually being in the near-infrared (and the specific spectral line at 777.4 nm).
Line 42: same issue as in line 40. Remove the word “visible”.
Line 42: the authors should reference the work of Koshak and others (e.g., DOI: 10.1175/JTECH-D-14-00085.1) that use statistical methods to estimate the IC/CG ratio of satellite based lightning data.
Line 53: replace “flying aboard” with “on”.
Line 56: replace “globe since several” with “globe for several”.
Line 60: replace “Table 1 resumes” with “Table 1 presents the”.
Line 62: The statement starting with “Space-based geostationary LLSs are superior to…” needs a reference to support it.
Line 80: replace “sense optical photons emitted in correspondence of lightning” with “sense optical photons emitted by lightning”.
Lines 82-83: this statement about the optical band for LI should be included in the discussion of the other orbital optical instruments, since they use the same oxygen triplet emission line.
Line 84: The authors should also provide the spatial sampling range of LI (from 4.5 km at nadir to X km near the edges of the detectors). Note, the second figure from Figure 1 in the LI user guide (https://user.eumetsat.int/resources/user-guides/mtg-li-level-2-data-guide) would be perfect.
Line 94: comma after “direct sunlight”.
Lines 108-110: the authors should state if the lightning locations are computed to the ground or some other “lightning ellipse”. The authors should also state if the times of the lightning are corrected for time of flight. Both of these bits of information are critical for users wanting to analyze the lightning data from LI.
Line 118: the authors should also state if the individual events are made available to the public and if those events are geolocated (to what altitude) and if they are time of flight corrected. The GLMs and LISs provide geolocated, time of flight corrected event data.
Line 118: At the end of this paragraph would be a good place to state if the data in the group and flash products are time of flight corrected.
Lines 129-131: Are there filters in the LI processing stream that remove known non-lightning sources?
Line 194: thank you for providing a link to code to correct time of flight and parallax.
Line 257: The authors should add an additional figure showing the overall distribution of location accuracy represented by Figure 5 (a single distribution with the X axis being km and the Y axis being counts).
Line 261: The authors should add an additional figure showing the overall distribution of time accuracy (a single distribution with the X axis being ms and the Y axis being counts).
Line 329: add a comma after “above 50◦ N” and after “FDE ≈ 80%”.
Line 378: remove the word “also”.
Line 380: remove the word “also”.
Line 431: remove comma after “et al.” and add “(“.
Lines 447-448: the sentence starting with “MTG-LI TA…” is confusing in its present form. I am not sure how to fix it, but please try to reword it. Maybe “MTG-LI TA is less than 1 ms over the entire reference period except for a few episodes of limited temporal duration.” My suggestion may not convey what you wanted, so you should try your own fix.
Line 448: change the phrase “…are related with outages…” to “…are related to outages…”.
Line 459: replace the phrase “…deviations from this mean pattern are met only on a limited number of…” with “…deviations from this mean pattern occur only in a limited number of…”
Lines 466-468: It would be interesting to recompute the overall FFAR values excluding those time periods (and locations) where there are known problems with the LI processing. It would provide the reader with more of the “true” FFAR value for LI.
Figure 3: Please make the various lines in the figure thicker. It will make them easier to read.
Figure 4: as mentioned earlier, the authors should add a line plot (extra figure) showing the distribution of LA for the whole dataset.
Citation: https://doi.org/10.5194/egusphere-2026-3177-RC1 -
AC1: 'Reply on RC1', Bartolomeo Viticchie, 01 Sep 2026
This manuscript is an excellent description of the LI data and system. I believe this manuscript, once published, will be one of the first papers to be read by anyone wanting to use the LI data. The links to the user guide and software will be quite useful to users of the LI data. As such, I have been a bit "picky" about my suggestions so that the manuscript will be the best it can be. I suggest it be published with very minor revisions.
We sincerely thank Referee #1 for these encouraging and complimentary words, as well as for the meticulous review of our manuscript. We are delighted that the reviewer recognizes the value of this work as a primary reference for future MTG-LI data users. We greatly appreciate the thoughtful, detailed suggestions provided to help polish the manuscript, and we have addressed every point raised to ensure the paper is as accurate, thorough, and clear as possible.
Specific Minor Issues:
Line 1: delete “brand-new”.
Done
Line 17: add comma after “(Grebovi´c et al., 2025)”.
Done
Line 19: add comma after “(or location accuracy)”.
Done
Line 26: replace “two big families” with “two major families”.
Done
Lines 31-32: Need a reference for the statement starting with “The accuracy with which such systems describe…”.
Done
Line 32: replace “LF and VLF LLSs one gets…” with “LF and VLF LLSs one gains…”.
Done
Line 40: using the phrase “visible photons” implies that the optical signals from lightning detected by the LI are in the visible range. The ones I am familiar with are near-infrared, outside of the visible range. I would simply delete the word “visible” and add a phrase about the optical signal usually being in the near-infrared (and the specific spectral line at 777.4 nm).
Done. Because of the changes to the text, part of Section 2 (namely Lines 80 and 81) were modified to avoid duplicating information.
Line 42: same issue as in line 40. Remove the word “visible”.
Done
Line 42: the authors should reference the work of Koshak and others (e.g., DOI: 10.1175/JTECH-D-14-00085.1) that use statistical methods to estimate the IC/CG ratio of satellite based lightning data.
Done
Line 53: replace “flying aboard” with “on”.
Done
Line 56: replace “globe since several” with “globe for several”.
Done
Line 60: replace “Table 1 resumes” with “Table 1 presents the”.
Done
Line 62: The statement starting with “Space-based geostationary LLSs are superior to…” needs a reference to support it.
The statement should be read together with the following one. The author modified the text to relate the two statements and included two additional references to support the point.
Line 80: replace “sense optical photons emitted in correspondence of lightning” with “sense optical photons emitted by lightning”.
Lines 82-83: this statement about the optical band for LI should be included in the discussion of the other orbital optical instruments, since they use the same oxygen triplet emission line.
This information is now available in Section 1 and has been removed from Section 2 to avoid duplicating information.
Line 84: The authors should also provide the spatial sampling range of LI (from 4.5 km at nadir to X km near the edges of the detectors). Note, the second figure from Figure 1 in the LI user guide (https://user.eumetsat.int/resources/user-guides/mtg-li-level-2-data-guide) would be perfect.
Done. In addition, the new figure was referenced in the document. In particular, in the discussion of the MTG-LI Location Accuracy (LA).
Line 94: comma after “direct sunlight”.
Done
Lines 108-110: the authors should state if the lightning locations are computed to the ground or some other “lightning ellipse”. The authors should also state if the times of the lightning are corrected for time of flight. Both of these bits of information are critical for users wanting to analyze the lightning data from LI.
Line 118: the authors should also state if the individual events are made available to the public and if those events are geolocated (to what altitude) and if they are time of flight corrected. The GLMs and LISs provide geolocated, time of flight corrected event data.
Line 118: At the end of this paragraph would be a good place to state if the data in the group and flash products are time of flight corrected.
Line 194: thank you for providing a link to code to correct time of flight and parallax.
As described in Section 3, comparing MTG-LI data with ground-based observations requires corrections for both parallax and light travel time. We appreciate the referee’s acknowledgment regarding the code provided for these corrections.
More broadly, while the comprehensive operational details requested in these comments are fully documented in the MTG-LI User Guide (linked in Section 2), we believe the manuscript itself should remain focused on information directly relevant to the core analyses presented in the subsequent sections. Because the primary objective of this manuscript is to evaluate and communicate MTG-LI detection performances rather than serve as a supplementary user manual, we have kept these background details concise, directing interested readers to the linked User Guide.
Lines 129-131: Are there filters in the LI processing stream that remove known non-lightning sources?
As highlighted in Section 5, the draft already notes that significant local increases in the Flash False Alarm Rate are confined to limited episodes driven by specific observational conditions—such as solar stray light near the FOV or Sun glint—as well as instrument artifacts like the parallel features caused by heightened Read-Out Noise (RON). Because these identified sources represent localized, secondary contributions rather than the primary driver of the overall FFAR, dedicated filters for them were not implemented in the initial baseline. However, to address these minor sources, an adapted version of a filter originally designed for RTS-like (Random Telegraph Signal) noise is currently undergoing testing.
Line 257: The authors should add an additional figure showing the overall distribution of location accuracy represented by Figure 5 (a single distribution with the X axis being km and the Y axis being counts).
Line 261: The authors should add an additional figure showing the overall distribution of time accuracy (a single distribution with the X axis being ms and the Y axis being counts).
Done. A new 2D histogram has been created and included in the manuscript. To be noted, in the parts discussing the Location Accuracy (LA) an effort was made to remove the ambiguity between LA and location offset.
Line 329: add a comma after “above 50◦ N” and after “FDE ≈ 80%”.
Done
Line 378: remove the word “also”.
Done
Line 380: remove the word “also”.
Done
Line 431: remove comma after “et al.” and add “(“.
Done
Lines 447-448: the sentence starting with “MTG-LI TA…” is confusing in its present form. I am not sure how to fix it, but please try to reword it. Maybe “MTG-LI TA is less than 1 ms over the entire reference period except for a few episodes of limited temporal duration.” My suggestion may not convey what you wanted, so you should try your own fix.
Line 448: change the phrase “…are related with outages…” to “…are related to outages…”.
The author re-wrote the sentence.
Line 459: replace the phrase “…deviations from this mean pattern are met only on a limited number of…” with “…deviations from this mean pattern occur only in a limited number of…”
Done
Lines 466-468: It would be interesting to recompute the overall FFAR values excluding those time periods (and locations) where there are known problems with the LI processing. It would provide the reader with more of the “true” FFAR value for LI.
We thank the referee for this valid observation. To address this, significant effort was dedicated to screening the dataset and ensuring the highest possible data quality for the performance assessment. Specifically, periods corresponding to operational outages—in both the MTG-LI production and the ground-based reference datasets—were strictly excluded from the analysis. As a result, we consider the reported Flash False Alarm Rate (FFAR) assessment to be highly robust against missing-data artifacts.
Figure 3: Please make the various lines in the figure thicker. It will make them easier to read.
Done
Figure 4: as mentioned earlier, the authors should add a line plot (extra figure) showing the distribution of LA for the whole dataset.
Done
Citation: https://doi.org/10.5194/egusphere-2026-3177-AC1
-
AC1: 'Reply on RC1', Bartolomeo Viticchie, 01 Sep 2026
-
RC2: 'Comment on egusphere-2026-3177', Anonymous Referee #2, 11 Aug 2026
The manuscript gives a good and thorough analysis of the key performance metrics of the new Lightning Imager, evaluating location accuracy, detection efficiency, and false alarm rate in relation to key ground-based (GLD360 and EUCLID) and satellite-based (GLM16, GLM19) lightning detection systems. The manuscript is well-organized, and the explanations of why the performance metrics vary geographically or temporally are notably clear. Once published, the paper will be a valuable resource to those using the MTG LI data for scientific research or operational monitoring. I recommend minor revision and have listed below some suggestions for the authors’ consideration.
Major comment:
The authors use a very broad window when calculating LI’s false alarm rate: +/-10 minutes and 10 pixels (1 degree, or 111 km). Studies of GLM performance have also used broad temporal windows (on the order of minutes), and Virts et al. (2023, https://doi.org/10.1175/JTECH-D-22-0050.1) demonstrated that broad temporal windows are needed to accurately estimate FAR when comparing with LLSs with limited detection ability. However, the broadest spatial window I can recall for FAR analysis in past studies is 50 km. The spatial window used in this study is thus more than twice as broad as the standard, with the risk that the reported FFAR is too low because flashes are deemed legitimate even if there is no thunderstorm in the immediate area. The authors address this on L464-467, but the explanation is brief and lacking in detail. They should justify this choice, and it would be helpful to state what the FFAR would be if a more standard matching window were used.
Minor comments:
L23: I’m not sure why it is necessary to define an assumption about the IC/CG ratio. Maybe sufficient to just state the general values based on previous research?
L55: GOES-East is at 75.2W, and GOES-West is at 137W
L85: Please also describe how LI’s spatial sampling changes with zenith angle. What is the resolution near the FOV edge? This also seems relevant to mention on L289-290.
L133: Literally, a decision to achieve the highest possible detection efficiency would probably involve no filtering at all. It might be more accurate to say “to achieve higher detection efficiency.”
Consider adding a figure (or a panel to Fig. 6) showing the % of false flashes (often called the FAR) at each grid point. The reader can try to deduce this by comparing the existing panels of Fig. 6, but it would be helpful to show it explicitly.
L255: Is there reason to think that GLD360’s location accuracy is lower over the ocean, which might also contribute to this?
L310: One could argue that EUCLID is not the best ground-based LLS in continental Europe, that an LMA is “better” (more sensitive) although for a limited region. Consider rewording.
L300-321: This is a long paragraph with a lot of information—consider splitting it in two, perhaps separate paragraphs for continental Europe and Africa.
L319-320: Assuming that EUCLID designates flashes as IC or CG, it would be very interesting to include statistics on MTG-LI’s DE vs the two flash types.
L329: The GLM fields of view extend to 55-56N. This should also be corrected in Table 1. May also need to check the observing angles cited on L509.
L329-330: To my eye, the FDE value at 70N appears much lower than 80%, but it’s difficult to tell since the curve is so steep. Consider adding grid lines within the plot so the values can be identified more clearly.
L365-366: Consider adding a couple sentences summarizing how LI’s performance vs an LMA compares with the performance metrics you’ve presented.
L369-370: GLM also has larger pixel size near the FOV edges (from 8 km at the satellite subpoint to 14 km near the edge). This should also be corrected in Table 1.
L396-407: This is a very good explanation of the diurnal variability in LA that confused me very much when thinking about Fig. 8 and 10. It’s difficult for the reader when those figures were introduced ~100 lines before this explanation was provided.
L400-402: Does this also imply seasonal variations in location accuracy?
L447: The timing accuracy is stated but never shown. Consider adding a figure showing the timing accuracy, either as a histogram or map.
L450-454: Bateman et al. (2021) and Virts et al. (2025) calculate domain-wide GLM FAR differently. Bateman et al. calculate the FAR for each grid box, then average the grid box FAR values to get the domain-wide value. Virts et al. use the same method as in the present manuscript, the domain-total # of false flashes divided by the domain-total # of all flashes.
Table 1: I am no LMI expert, but the coverage area listed in this table seems much smaller than the FOV maps I have seen. Please validate this.
Table 2: Based on this table, an asymmetric stroke/group matching window was used (from 10 ms before to 5 ms after the stroke time). The text should state the reason for this.
FDE is usually plotted as a % ranging from 0-100%. The text describes the FDE values this way, but the figures show fractions from 0-1. Consider scaling the plots.
Figure 3: The plot labels are too small.
Figure 11, left panel: There appear to be values along the coast of Ecuador—were those intended to be masked out?
Grammar comments (note that some may be legitimate differences between British and American English):
L2, 25, and 498: “the diagnosis and”
L5: “period is eighteen”
L16: There’s an extra space before Mitchard
L19: “continuously monitoring”
L22: “to modeling and measuring the ratio”
L23-24: “to comprise” or “to make up”
L26: Missing comma after activity (at the end of the clause)
L26: No comma needed after locate
L35: “progressively loses” – although it’s more accurate to say that the capability of monitoring IC decreases. Even networks such as WWLLN with low DE can detect some IC lightning.
L41-42: Perhaps “any lightning discharge produces visible photons” or “any lightning discharge emits visible photons”
L51: No comma after November 2016
L54: “Zealand”
L56: “for several years”
L60: “Table 1 summarizes”
L71: “of the development”
L80: “emitted by lightning channels”
L87: “defined relative to a”
L99: “for monitoring purposes”
L126: “an LLS” because the letter L sounds like it begins with a vowel
L166-167: “when matching between”
L191: “cloud-top-height”
L202: “detection of CG”
L205-206: “of a few hundred meters”
L214: “Zealand”
L218: No comma after EUCLID
L256: “the Arabian peninsula”
L259-260: “is in line with”
L263: “the total of ## flashes”
L321: “combined with”
L353: “close to the edge of the GLM FOV”. Similarly on L461.
L436: “but quite”
L479: “over the southern Atlantic Ocean” and “the equatorial Atlantic Ocean”
L514: “The locations of such landmarks”
Table 2 caption: “For each LLS”
Citation: https://doi.org/10.5194/egusphere-2026-3177-RC2 -
AC2: 'Reply on RC2', Bartolomeo Viticchie, 01 Sep 2026
The manuscript gives a good and thorough analysis of the key performance metrics of the new Lightning Imager, evaluating location accuracy, detection efficiency, and false alarm rate in relation to key ground-based (GLD360 and EUCLID) and satellite-based (GLM16, GLM19) lightning detection systems. The manuscript is well-organized, and the explanations of why the performance metrics vary geographically or temporally are notably clear. Once published, the paper will be a valuable resource to those using the MTG LI data for scientific research or operational monitoring. I recommend minor revision and have listed below some suggestions for the authors’ consideration.
We sincerely thank Referee #2 for the positive evaluation of our work and for recognizing the value of this manuscript to the scientific and operational lightning communities. We appreciate the reviewer’s thoughtful feedback and constructive comments, particularly regarding the key performance metric analyses. We have taken these suggestions very seriously and carried out additional work to address all the points raised—most notably regarding the Flash False Alarm Rate (FFAR). A detailed, point-by-point response and descriptions of the corresponding revisions are provided below.
Major comment:
The authors use a very broad window when calculating LI’s false alarm rate: +/-10 minutes and 10 pixels (1 degree, or 111 km). Studies of GLM performance have also used broad temporal windows (on the order of minutes), and Virts et al. (2023, https://doi.org/10.1175/JTECH-D-22-0050.1) demonstrated that broad temporal windows are needed to accurately estimate FAR when comparing with LLSs with limited detection ability. However, the broadest spatial window I can recall for FAR analysis in past studies is 50 km. The spatial window used in this study is thus more than twice as broad as the standard, with the risk that the reported FFAR is too low because flashes are deemed legitimate even if there is no thunderstorm in the immediate area. The authors address this on L464-467, but the explanation is brief and lacking in detail. They should justify this choice, and it would be helpful to state what the FFAR would be if a more standard matching window were used.
Thank you for this very valid comment, which helps us improve our discussion on this key point.
The authors are aware that the difference in False Alarm Rate (FAR) between GLM and MTG-LI stems from the different choice of spatial window, and this is now clearly stated in the discussion: “However, an important difference must be highlighted with respect to the configuration of Virts et al. (2025): the spatial window to classify flashes used in our study is more than twice as broad as the one they employ”.
Consequently, the discussion regarding this key configuration parameter has been moved to follow immediately after the comparison between GLM and MTG-LI, addressing this critical point up front. We offer the following explanation (slightly reinforced compared to the original draft): “The use of a much smaller spatial buffer (∆pix in Table 2; initially set at two pixels) would result in a large number of true flashes being misclassified as false at several locations in the MTG-LI FOV. In central Africa, MTG-LI false flashes would clearly resemble true ones when considering their spatial distribution, for example, with sharp count drop between land and ocean or with extended clusters of false flashes following seasonal patterns. The buffer had to be increased to ten pixels to counterbalance the limitations of GLD360 over Africa”.
Minor comments:
L23: I’m not sure why it is necessary to define an assumption about the IC/CG ratio. Maybe sufficient to just state the general values based on previous research?
Done. Referred to a specific publication and presented the value of the ratio IC/CG.
L55: GOES-East is at 75.2W, and GOES-West is at 137W
Done
L85: Please also describe how LI’s spatial sampling changes with zenith angle. What is the resolution near the FOV edge? This also seems relevant to mention on L289-290.
Done. New figures have been included as requested by Referee#1 (Douglas Mach).
L133: Literally, a decision to achieve the highest possible detection efficiency would probably involve no filtering at all. It might be more accurate to say “to achieve higher detection efficiency.”
Done
Consider adding a figure (or a panel to Fig. 6) showing the % of false flashes (often called the FAR) at each grid point. The reader can try to deduce this by comparing the existing panels of Fig. 6, but it would be helpful to show it explicitly.
Done. The same colour table used in Virtz et al. (2025) was used for this new map for direct comparison (see major comment).
L255: Is there reason to think that GLD360’s location accuracy is lower over the ocean, which might also contribute to this?
One cannot find any publication indicating that GLD360 suffers degraded location accuracy over Oceans. In addition, VLF LLSs are known to generally perform better over the oceans due to the conductivity of the environment facilitating VLF signal propagation and detection.
L310: One could argue that EUCLID is not the best ground-based LLS in continental Europe, that an LMA is “better” (more sensitive) although for a limited region. Consider rewording.
The sentence has been removed
L300-321: This is a long paragraph with a lot of information—consider splitting it in two, perhaps separate paragraphs for continental Europe and Africa.
Done
L319-320: Assuming that EUCLID designates flashes as IC or CG, it would be very interesting to include statistics on MTG-LI’s DE vs the two flash types.
Indeed, this is an interesting aspect to explore. We investigated this point and found no significant difference in Flash Detection Efficiency (FDE) between the two families of EUCLID flashes. Although Combarnous et al. (2025) reported two distinct FDE values for the families classified by Météorage—a network with detection performance comparable to EUCLID—the difference remains minor, aligning with our observations. In any case, our study focuses on total lightning activity rather than discriminating between CG and IC flashes. Furthermore, while EUCLID detects approximately 95% of CG flashes, its FDE for IC flashes is less well characterized. We believe the most reliable assessment of MTG-LI performance across both flash families will come from comparisons with ELMA, the results of which will soon be published by Montanyà et al.
L329: The GLM fields of view extend to 55-56N. This should also be corrected in Table 1. May also need to check the observing angles cited on L509.
Done. The E-W extension has been included too. The change was also included in the text.
L329-330: To my eye, the FDE value at 70N appears much lower than 80%, but it’s difficult to tell since the curve is so steep. Consider adding grid lines within the plot so the values can be identified more clearly.
Done. Indeed, at 70 deg N one has FDE = 73%. The text has been updated accordingly. All plots were updated with grids.
L365-366: Consider adding a couple sentences summarizing how LI’s performance vs an LMA compares with the performance metrics you’ve presented.
As indicated in the reference list, the manuscript evaluating the comparison between MTG-LI and ELMA is currently in preparation and awaiting submission. To preserve the integrity of the peer-review process, we intend to withhold the disclosure of these findings until formal publication.
L369-370: GLM also has larger pixel size near the FOV edges (from 8 km at the satellite subpoint to 14 km near the edge). This should also be corrected in Table 1.
Done. Here we included also the reference to the new Figure with the LI spatial sampling.
L396-407: This is a very good explanation of the diurnal variability in LA that confused me very much when thinking about Fig. 8 and 10. It’s difficult for the reader when those figures were introduced ~100 lines before this explanation was provided.
We thank the reviewer for this note. We prefer keeping the Results and Discussion sections separate to keep data presentation distinct from interpretation. To ensure clear navigation across the line gap, the Discussion section explicitly cross-references back to the corresponding findings and figures in the Results section.
L400-402: Does this also imply seasonal variations in location accuracy?
Correct. The Northern Hemisphere—where most MTG-LI landmarks are located—receives significantly less illumination in winter. Consequently, early-operations winter-time LA (e.g., November 2024–February 2025) was slightly less stable. However, EUMETSAT INR experts have since improved processing/configuration, and work is ongoing. To keep our manuscript focused on aggregated/average performance rather than long time series, we have omitted this detail. Users can still inspect historical INR performance via the link in Section 6.
L447: The timing accuracy is stated but never shown. Consider adding a figure showing the timing accuracy, either as a histogram or map.
Done. A new figure was requested by Referee#1 (Douglas Mach).
L450-454: Bateman et al. (2021) and Virts et al. (2025) calculate domain-wide GLM FAR differently. Bateman et al. calculate the FAR for each grid box, then average the grid box FAR values to get the domain-wide value. Virts et al. use the same method as in the present manuscript, the domain-total # of false flashes divided by the domain-total # of all flashes.
See answer to the major comment.
Table 1: I am no LMI expert, but the coverage area listed in this table seems much smaller than the FOV maps I have seen. Please validate this.
Done. The table has been updated.
Table 2: Based on this table, an asymmetric stroke/group matching window was used (from 10 ms before to 5 ms after the stroke time). The text should state the reason for this.
Done. The explanation has been added in the notes to the Table. In addition, the description of the time window was amended.
FDE is usually plotted as a % ranging from 0-100%. The text describes the FDE values this way, but the figures show fractions from 0-1. Consider scaling the plots.
Done
Figure 3: The plot labels are too small.
Done
Figure 11, left panel: There appear to be values along the coast of Ecuador—were those intended to be masked out?
This should be interpreted as random/spurious matches with very poor navigation and/or parallax correction that ended up in those bins at the extreme West of the FOV.
Grammar comments (note that some may be legitimate differences between British and American English):
L2, 25, and 498: “the diagnosis and”
Done
L5: “period is eighteen”
Done
L16: There’s an extra space before Mitchard
Done
L19: “continuously monitoring”
Done
L22: “to modeling and measuring the ratio”
Done
L23-24: “to comprise” or “to make up”
Modified to answer to another comment.
L26: Missing comma after activity (at the end of the clause)
Done
L26: No comma needed after locate
Done
L35: “progressively loses” – although it’s more accurate to say that the capability of monitoring IC decreases. Even networks such as WWLLN with low DE can detect some IC lightning.
Done
L41-42: Perhaps “any lightning discharge produces visible photons” or “any lightning discharge emits visible photons”
Done
L51: No comma after November 2016
Done
L54: “Zealand”
Done
L56: “for several years”
Done
L60: “Table 1 summarizes”
Done
L71: “of the development”
Done
L80: “emitted by lightning channels”
Modified based on a comment of the Referee #1 (Douglas Mach).
L87: “defined relative to a”
Done
L99: “for monitoring purposes”
Done
L126: “an LLS” because the letter L sounds like it begins with a vowel
Done
L166-167: “when matching between”
Done
L191: “cloud-top-height”
Done
L202: “detection of CG”
Done
L205-206: “of a few hundred meters”
Done
L214: “Zealand”
Done
L218: No comma after EUCLID
Done
L256: “the Arabian peninsula”
Done
L259-260: “is in line with”
Done
L263: “the total of ## flashes”
Done
L321: “combined with”
Done
L353: “close to the edge of the GLM FOV”. Similarly on L461.
Done
L436: “but quite”
Done
L479: “over the southern Atlantic Ocean” and “the equatorial Atlantic Ocean”
Done
L514: “The locations of such landmarks”
Done
Table 2 caption: “For each LLS”
Done
Citation: https://doi.org/10.5194/egusphere-2026-3177-AC2
-
AC2: 'Reply on RC2', Bartolomeo Viticchie, 01 Sep 2026
Peer review completion
Journal article(s) based on this preprint
Viewed
| HTML | XML | Total | BibTeX | EndNote | |
|---|---|---|---|---|---|
| 340 | 143 | 32 | 515 | 21 | 22 |
- HTML: 340
- PDF: 143
- XML: 32
- Total: 515
- BibTeX: 21
- EndNote: 22
Viewed (geographical distribution)
| Country | # | Views | % |
|---|
| Total: | 0 |
| HTML: | 0 |
| PDF: | 0 |
| XML: | 0 |
- 1
Bartolomeo Viticchié

Sven-Erik Enno
David Navia
Janja Avbelj
Jochen Grandell
The requested preprint has a corresponding peer-reviewed final revised paper. You are encouraged to refer to the final revised version.
- Preprint
(5799 KB) - Metadata XML