
the Creative Commons Attribution 4.0 License.
the Creative Commons Attribution 4.0 License.
 | 23 Jun 2026
Validation of cloud macrophysical properties from the ATLID Level 2a products A-TC, A-FM, A-CTH using airborne lidar observations during the HALO missions PERCUSION, ASCCI and NAWDIC
Abstract. The Earth Cloud, Aerosol, and Radiation Explors (EarthCARE) satellite mission aims to improve our understanding of cloud–aerosol–radiation interactions in the Earth’s climate system. The Atmospheric Lidar (ATLID) instrument aboard EarthCARE provides important observational data for determining the properties of clouds and aerosols; therefore, thorough validation of ATLID products is a prerequisite for their reliable scientific use. This study evaluates the reliability of selected parameters applicable to study cloud macrophysical properties of three ATLID single-sensor Level 2 products: The ‘simple classification’ of the ATLID Target Classification (A-TC) product, the ‘feature mask’ of the ATLID Feature Mask (A-FM) product, and the ‘cloud top height’ of the ATLID Cloud Top Height (A-CTH) product. We present an independent validation using a comprehensive multi-campaign dataset of airborne high spectral resolution lidar (HSRL) backscatter ratio (BSR) measurements. During each flight at least one coordinated underpass underneath EarthCARE ground track was conducted ensuring high spatial and temporal matching of the spaceborne and airborne lidars. The dataset spans a wide range of tropical and extratropical cloud regimes, enabling robust assessment under diverse atmospheric conditions. The evaluation addresses two main objectives: (i) assessing how well A-TC and A-FM represent the vertical cloud distribution compared to the airborne HSRL observations, and (ii) quantifying the accuracy of A-CTH cloud top heights for different classes of cloud regimes. In general, the vertical cloud distribution observed from the airborne data is well captured by both A-TC and A-FM products. However, we found a systematic overestimation of ice clouds by A-TC in Baseline BA. This overestimation is related to spreading effects in the retrieval, but also to some extent to misclassified aerosol pixels as ice clouds (at temperatures >0 °C), and to a spurious occurrence of stratospheric aerosol features near the tropopause. A-TC liquid cloud fractions show very good agreement with airborne observations. A-CTH exhibits a consistent positive bias in cloud top height of almost 300 m across different cloud regimes, along with occasional low-altitude cloud top detections, particularly over ocean surfaces, suggesting issues in surface assignment. The presented results primarily reflect Baseline BA, while first comparisons with Baseline BC and a prototype version of Baseline CA indicate improvements in future processing baselines, including a reduction of low-cloud artefacts in A-CTH, improved cloud phase representation in A-TC, and a strong reduction of misclassified ice clouds in aerosol layers at temperatures >0 °C. Altogether, the validated ATLID Level 2 products demonstrate a high ability to realistically represent key macrophysical cloud properties—including cloud cover and cloud top height—which confirms their suitability for scientific applications. The identified limitations in the performance of the BA and BC baselines can help users make optimal use of these datasets, point to expected improvements in the upcoming CA baseline, and may support the further refinement of the ATLID Level 2 products.
Competing interests: At least one of the (co-)authors serves as editor for the special issue to which this paper belongs.
Publisher's note: Copernicus Publications remains neutral with regard to jurisdictional claims made in the text, published maps, institutional affiliations, or any other geographical representation in this paper. While Copernicus Publications makes every effort to include appropriate place names, the final responsibility lies with the authors. Views expressed in the text are those of the authors and do not necessarily reflect the views of the publisher.-
Notice on discussion status
The requested preprint has a corresponding peer-reviewed final revised paper. You are encouraged to refer to the final revised version.
-
Preprint
(3533 KB)
-
The requested preprint has a corresponding peer-reviewed final revised paper. You are encouraged to refer to the final revised version.
- Preprint
(3533 KB) - Metadata XML
- BibTeX
- EndNote
- Final revised paper


Journal article(s) based on this preprint
Interactive discussion
Status: closed
-
RC1: 'Comment on egusphere-2026-3051', Anonymous Referee #1, 15 Jul 2026
-
AC1: 'Reply on RC1', Konstantin Krueger, 09 Sep 2026
The comment was uploaded in the form of a supplement: https://egusphere.copernicus.org/preprints/2026/egusphere-2026-3051/egusphere-2026-3051-AC1-supplement.pdf
-
AC1: 'Reply on RC1', Konstantin Krueger, 09 Sep 2026
-
RC2: 'Comment on egusphere-2026-3051', Anonymous Referee #2, 10 Aug 2026
The comment was uploaded in the form of a supplement: https://egusphere.copernicus.org/preprints/2026/egusphere-2026-3051/egusphere-2026-3051-RC2-supplement.pdf
-
AC2: 'Reply on RC2', Konstantin Krueger, 09 Sep 2026
The comment was uploaded in the form of a supplement: https://egusphere.copernicus.org/preprints/2026/egusphere-2026-3051/egusphere-2026-3051-AC2-supplement.pdf
-
AC2: 'Reply on RC2', Konstantin Krueger, 09 Sep 2026
Peer review completion


Interactive discussion
Status: closed
-
RC1: 'Comment on egusphere-2026-3051', Anonymous Referee #1, 15 Jul 2026
This manuscript presents a comprehensive validation of the EarthCARE ATLID Level 2 products - specifically the A-TC, A-FM, and A-CTH - using an extensive multi-campaign airborne dataset. The study is well-structured and demonstrates high scientific quality, providing a clear and methodical assessment of cloud macrophysical properties across diverse tropical and extratropical regimes. This research is important to the broader scientific community, especially for users of EarthCARE and airborne lidar data. Furthermore, the identification of systematic biases (e.g. the ice cloud overestimation in A-TC and the cloud top height discrepancies in A-CTH) provides critical feedback to the developers of the of the retrieval algorithms. I recommend that this paper be accepted for publication after addressing the (mainly minor) revisions discussed in the following comments/questions.
- "Spreading Effect": In the abstract (lines 25-26) and the Summary (line 820), the authors refer to a spreading effect as a primary cause for the overestimation of ice cloud occurrence. Does this spreading effect have to do with averaging or interpolation?
- In Section 5.2 (lines 759–760) and the abstract (lines 28–30), the authors link the low-altitude cloud top height underestimations specifically to surface misidentification over the ocean. However, given that Figure 1 illustrates that the majority of the flight data were acquired over oceanic regions, it is unclear if this is an inherent ocean-specific retrieval issue or simply a result of the sampling distribution. Please clarify whether this would similarly happen over land surfaces if the sampling were equivalent, and consider qualifying the statement to reflect that the observation may be a consequence of the mission’s oceanic flight coverage.
- In lines 74–79, the authors discuss the limitations and advantages of validation methodologies. To provide a more complete picture of the current state of EarthCARE product validation, I suggest acknowledging and citing recent works that utilize ground-based networks (e.g., ACTRIS). Including references such as Baars et al. (2026) and Feuillard et al. (2026) would help readers better understand how airborne campaigns (like the one in this study) complement ongoing ground-based validation activities.
- In line 116, the authors say that the A-CTH product is evaluated against a "postulated accuracy requirement of 300 m." Is this a specific mission requirement (e.g., the EarthCARE Mission Requirements Document or the cited Wandinger et al. (2023) paper) or another mission document?
- It is clear that WALES is a well-established instrument, but it would be beneficial to include a brief statement regarding the calibration and maintenance procedures, specifically how the system ensures long-term stability and accuracy across different campaigns. Additionally, if the WALES dataset has been utilized in previous satellite validation studies, I suggest acknowledging these contributions with relevant citations.
- In Table 1, the authors provide the "leg distance" for each flight, defined as the horizontal distance flown along the EarthCARE ground track. To assist readers understand what is this leg distance, it would be helpful to include a brief explanation of how it is determined and its significance to the overall statistical power of the study. Furthermore, given the variability in leg distances across the campaigns, I suggest adding a sensitivity analysis (or a brief discussion) on how this horizontal extent affects the collocation statistics. Specifically, would increasing the number of collocated profiles or refining the spatial matching criteria significantly alter the identified performance biases, or is the current sample size sufficient to represent the observed atmospheric variability?
- Lines 243-244: Could the authors elaborate more on these "3 bins" window (e.g., how many meters vertically or how many seconds horizontally the window spans)? Specifically, does the window cover a fixed vertical altitude range, and how does the 3-bin horizontal width relate to the 1-second temporal resolution? Why was this specific window chosen?
- In the entire paper, there are no explicit units provided for the backscatter ratio (BSR). Could the authors please specify the units or define the normalization used? Additionally, is the BSR parameter consistent with the A-EBD BSR in Figures 3 and 4? Please define what does the parameter R|| represent in these plots? Regarding the altitude axis in the plots: Is the altitude relative to the Earth's surface (above ground level), or is it referenced differently? Please clarify this convention in text as well, and if there is height correction implemented. It would also be beneficial to clarify the observational geometry of the WALES lidar during the coordinated underpasses: does the instrument only provide observations of the atmospheric column above the aircraft, or does it also capture the column below the aircraft? This distinction is important for understanding the spatial matching relative to the EarthCARE ground track.
- Did the authors use quality masking for the A-FM product?
- Following the previous comment, in my opinion it’s a confusing viewing geometry logic in Lines 375–377: The sentence regarding cloud top heights is ambiguous: "although fewer cloud top detections are visible compared to the WALES-derived cloud tops (Fig. 3b) as they occasionally are located above the flight level." Which instrument has fewer detections and why? If HALO is flying below the cloud top (e.g., at 10 km while clouds are at 13 km), a nadir-pointing WALES wouldn't see the cloud tops, but the EarthCARE satellite (looking from above) would. The authors need to rewrite this sentence to explicitly state which instrument's view is obstructed and how that impacts the A-CTH vs. WALES comparison
- Lines 371 & 380: Regarding the Aerosol vs. Ice Cloud Misclassification, the text notes that A-TC classifies some aerosol pixels as ice clouds (often a known artifact with dust in lidar retrievals). The authors briefly mention Saharan dust at the very end. It would strengthen the analysis if they explicitly stated earlier that this A-TC misclassification is likely an artifact of dust depolarization mimicking ice crystals.
- In lines 395 and 400, is it really intented to write Figure 3c and Figure 3d (extratropical case)? I understand that the authors compare to the previous case, but the text meaning would point the reader to figure 4.
- Lines 396-398 lines: “Interestingly, the cloud formation between 6-10 km altitude in the A-TC product is subdivided near the approx. constant tropopause level into an ice cloud component below and a stratospheric aerosol layer above.” If this is a cloud-to-aerosol transition at the tropopause, it is a scientifically interesting feature. However, calling it a "stratospheric aerosol layer" while discussing an altitude of 6–10 km is geographically sensitive. In the tropics, 6–10 km is mid-troposphere; in the Arctic 6–10 km can indeed be near the tropopause. I would recommend to explicitly state the altitude of the local tropopause for this flight to confirm why a 6–10 km feature is considered "stratospheric." Or maybe add a small description in the discussion.
- In many points in the paper flags of A-FM are mentioned (e.g. line 407) and it is a bit difficult to understand which flag is which mainly from the colorbar of figures 3+4. The reader may not have memorized the A-FM flag definitions, therefore I would suggest to add a brief parenthetical description, e.g., (representing the most optically thick features) or include that to the appendix (if it is not already anywhere in the text) or point the reader to the hand book of that product (https://earthcarehandbook.earth.esa.int/catalogue/atl_fm__2a)
- In the text (line 96), the authors state that the study comprises 35 dedicated research flights. However, Table 1 lists 40 flights. It appears that this is because a single flight may cover multiple EarthCARE orbits, with each orbit being treated as an individual entry in the table. Maybe this terminology could be conciled throughout the manuscript to avoid confusion. I suggest clarifying the distinction between a "research flightand an "underflight segment" (the specific collocated orbit) early in the text so that the reader understands why 40 segments are derived from 35 flights.
- In Figure 6, where do the temperature data come from? While Figure 8 suggests the use of TIFS , I suggest to state in the text or relevant figure captions whether the temperatures presented are derived from the EarthCARE L2 product files themselves or from an external model analysis. For the sake of reproducibility, it is good for the reader to know exactly which dataset (and maybe which version of the auxiliary data) is being utilized for these comparisons.
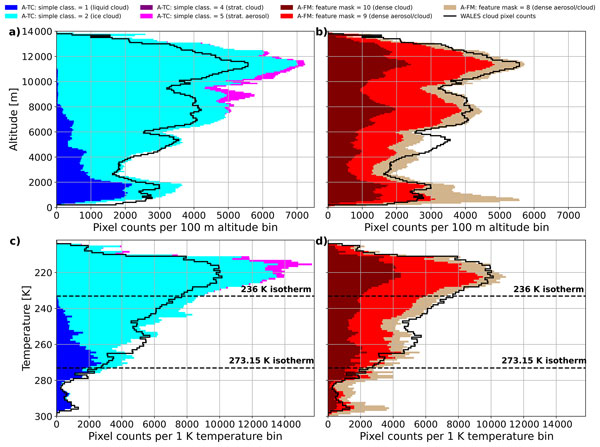
- In the discussion regarding the overestimation of ice cloud occurrence (lines 437–440), the authors note higher pixel counts but leave the underlying physical mechanism open to interpretation. In the context of lidar remote sensing, such discrepancies often stem from differences in instrument sensitivity thresholds, multiple scattering, or other algorithmic classification criteria. Could you clarify if these higher counts are a result of ATLID’s sensitivity to thinner features that might be below the detection limit of the airborne HSRL, or if they are primarily artifacts of algorithmic misclassification (e.g., aerosol-as-cloud)? Given the mention of the "stratospheric aerosol flag" (line 443), please expand the discussion to explain how this flag interacts with the cloud classification logic and to what extent it quantitatively impacts the overall statistics.
- Regarding the temperature thresholds discussed in the analysis of cloud pixel counts (lines 484–490), the physical role of the 236 K and 295 K peaks requires further clarification. Is the 236 K threshold a specific hard-coded limit in the A-TC classification algorithm, or does it correspond to a physical boundary in the underlying auxiliary data? I think that the local maximum at 295 K feels conceptually disconnected from the rest of the discussion. Please be more direct regarding what this peak represents. Are these counts identified as low-level liquid clouds, or does this peak highlight a known challenge in the A-TC/A-FM product's ability to distinguish between boundary layer aerosols and near-surface cloud features?
- The observation that no stratospheric aerosol flags were detected during the 2026 NAWDIC campaign (lines 444–446) is an important finding regarding algorithm robustness. This point is currently understated; I suggest moving it to the "Discussion" section. Please clarify if this absence reflects a genuine improvement in the BC baseline, a difference in atmospheric conditions, or a change in the classification logic.
- Figure 8 is packed with information. Please expand the caption to explicitly define the correspondence between the filled/unfilled circles and their respective violin plots, as well as the need to reference the secondary logarithmic y-axis. Furthermore, clarify if the shaded region (-300 to 300 m) represents the mission’s formal accuracy requirement (in accordance to comment 3). If so, is this 300 m threshold tied to a specific physical constraint, such as the ATLID vertical sampling grid size? Please if possible also address whether this observed systematic bias is inherent to the retrieval architecture or potentially resolvable in future processing versions.
- I would suggest to include a regression line for Fig 7, it is intresting to see the correlation coefficient. Even if there are many CTH that WALES captured while A-CTH didn’t, the agreement still look really good with most points around the 1-1 line.|
- Lines 556-558: “Interestingly the distribution of differences in this category is bimodal, with one maximum similar to the other categories at slightly above +300 m, and a broader secondary maximum ranging between –200 m and –600 m which may point to a potential systematic misclassification in this category.” Te authors identified a bimodal distribution for liquid clouds (one peak at +300 m, one at -200 to -600 m). But potential systematic misclassification is a bit vague. Based on the physics, if A-CTH is underestimating liquid cloud tops, is it failing to detect the thin, wispy tops of boundary-layer clouds? Or is it incorrectly "locking on" to the cloud base in some cases?
- A general queston for section 4.2: Since the authors are comparing WALES and ATLID cloud tops, it would be helpful for the reader to include the viewing geometry (see also comment 6). WALES is nadir-looking from inside the atmosphere and EarthCARE is looking from space (looking down through the atmosphere). Could the 300 m bias be related to the attenuation of the satellite signal as it travels through the atmosphere, vs. the much shorter path length for the aircraft?
- The text highlights that the WALES dataset is used for robust validation due to its spatiotemporal collocation. Is it possible that the high-altitude maxima observed during tropical campaigns (as noted) could introduce a geographic bias in the product validation if not properly accounted for?
- In Section 5.1, the authors attribute improvements in the prototype CA version (e.g., elimination of stratospheric aerosol misclassifications) to both "improved tropopause determination" and the general evolution of the Baseline. Given that the EarthCARE handbook link is provided, I would suggest to
disentangle the specific causes of the improvements: is it solely due to the new tropopause logic or other changes in the A-TC processor contributed? - A general comment: The technical depth of the analysis is commendable, but sections 3-5 feature some dense paragraphs that make it hard for the reader to digest the results effectively. To improve readability, I would suggest to break the massive blocks of text into smaller, and focus on the core findings for each product.
Citation: https://doi.org/10.5194/egusphere-2026-3051-RC1 -
AC1: 'Reply on RC1', Konstantin Krueger, 09 Sep 2026
The comment was uploaded in the form of a supplement: https://egusphere.copernicus.org/preprints/2026/egusphere-2026-3051/egusphere-2026-3051-AC1-supplement.pdf
- "Spreading Effect": In the abstract (lines 25-26) and the Summary (line 820), the authors refer to a spreading effect as a primary cause for the overestimation of ice cloud occurrence. Does this spreading effect have to do with averaging or interpolation?
-
RC2: 'Comment on egusphere-2026-3051', Anonymous Referee #2, 10 Aug 2026
The comment was uploaded in the form of a supplement: https://egusphere.copernicus.org/preprints/2026/egusphere-2026-3051/egusphere-2026-3051-RC2-supplement.pdf
-
AC2: 'Reply on RC2', Konstantin Krueger, 09 Sep 2026
The comment was uploaded in the form of a supplement: https://egusphere.copernicus.org/preprints/2026/egusphere-2026-3051/egusphere-2026-3051-AC2-supplement.pdf
-
AC2: 'Reply on RC2', Konstantin Krueger, 09 Sep 2026
Peer review completion
Journal article(s) based on this preprint
Viewed
| HTML | XML | Total | BibTeX | EndNote | |
|---|---|---|---|---|---|
| 222 | 90 | 48 | 360 | 30 | 27 |
- HTML: 222
- PDF: 90
- XML: 48
- Total: 360
- BibTeX: 30
- EndNote: 27
Viewed (geographical distribution)
| Country | # | Views | % |
|---|
| Total: | 0 |
| HTML: | 0 |
| PDF: | 0 |
| XML: | 0 |
- 1
Cited


Konstantin Krüger

Martin Wirth
Athena Augusta Floutsi
David Patrick Donovan
Gerd-Jan van Zadelhoff
Silke Martha Groß
The requested preprint has a corresponding peer-reviewed final revised paper. You are encouraged to refer to the final revised version.
- Preprint
(3533 KB) - Metadata XML
This manuscript presents a comprehensive validation of the EarthCARE ATLID Level 2 products - specifically the A-TC, A-FM, and A-CTH - using an extensive multi-campaign airborne dataset. The study is well-structured and demonstrates high scientific quality, providing a clear and methodical assessment of cloud macrophysical properties across diverse tropical and extratropical regimes. This research is important to the broader scientific community, especially for users of EarthCARE and airborne lidar data. Furthermore, the identification of systematic biases (e.g. the ice cloud overestimation in A-TC and the cloud top height discrepancies in A-CTH) provides critical feedback to the developers of the of the retrieval algorithms. I recommend that this paper be accepted for publication after addressing the (mainly minor) revisions discussed in the following comments/questions.
disentangle the specific causes of the improvements: is it solely due to the new tropopause logic or other changes in the A-TC processor contributed?