
the Creative Commons Attribution 4.0 License.
the Creative Commons Attribution 4.0 License.
 | 03 Jun 2026
Seasonal evolution of suncup roughness describes broadband albedo decay on alpine snow
Abstract. We monitored the formation and seasonal evolution of suncup roughness over three snow ablation seasons at Weissfluhjoch, Swiss Alps, using a terrestrial LiDAR scanner. Suncup onset required two concurrent conditions, identified from high-temporal-resolution digital surface models of surface roughness: sustained surface melting through most of the day and reduced wind speeds. Suncups formed in all three years, but their planar arrangement and geometric properties varied substantially across seasons, controlled by whether radiative or turbulent heat exchange dominated ablation. Comparing measured broadband albedo to flat-surface simulations from TARTES forced by SNOWPACK-modelled snow properties, we find that the combined effect of suncup roughness and surface impurity loading reduces albedo by 0.02–0.15, depending on illumination geometry and impurity load, consistent with previous literature. Isolating the two contributions is complicated by their co-evolution during the ablation season: the same melt processes that progressively deepen suncups also drive surface enrichment and spatial redistribution of impurities. Resolving the two effects independently would in principle require equally fine-scale measurements of both roughness and impurity distribution. We identify a robust logarithmic correlation between broadband albedo and aerodynamic roughness length that simultaneously captures the radiative effects of roughness and impurities, regardless of their relative contributions. During early suncup formation, impurities remained uniformly distributed. At later stages, meltwater scavenging concentrated impurities to the suncup hollows. As the rate of broadband albedo decay is strongest at the beginning of suncup formation and relaxes thereafter, we infer that the interaction between the multiple-reflection mechanism and the more uniform distribution of impurities is particularly effective in accelerating albedo decay, beyond the effect of either factor alone. Given that C-band SAR backscatter is sensitive to the early development of surface roughness on wet snow, these findings encourage future work on the assimilation of surface roughness into snow energy balance models.
Competing interests: At least one of the (co-)authors is a member of the editorial board of The Cryosphere. The peer-review process was guided by an independent editor, and the authors also have no other competing interests to declare.
Publisher's note: Copernicus Publications remains neutral with regard to jurisdictional claims made in the text, published maps, institutional affiliations, or any other geographical representation in this paper. While Copernicus Publications makes every effort to include appropriate place names, the final responsibility lies with the authors. Views expressed in the text are those of the authors and do not necessarily reflect the views of the publisher.-
Notice on discussion status
The requested preprint has a corresponding peer-reviewed final revised paper. You are encouraged to refer to the final revised version.
-
Preprint
(6887 KB)
-
The requested preprint has a corresponding peer-reviewed final revised paper. You are encouraged to refer to the final revised version.
- Preprint
(6887 KB) - Metadata XML
- BibTeX
- EndNote
- Final revised paper


Journal article(s) based on this preprint
Interactive discussion
Status: closed
-
RC1: 'Comment on egusphere-2026-3049', Steven Fassnacht, 15 Jul 2026
-
AC1: 'Reply on RC1', Francesca Carletti, 24 Jul 2026
Dear Reviewers,
Many thanks for the detailed, rigorous reviews of our manuscript and for all the positive, encouraging comments about this work.
Please find attached our point-to-point responses.
With the best regards,
Francesca Carletti, on behalf of all Authors
-
AC1: 'Reply on RC1', Francesca Carletti, 24 Jul 2026
-
RC2: 'Comment on egusphere-2026-3049', Anonymous Referee #2, 19 Jul 2026
The paper addresses the seasonal evolution of snow surface roughness features (suncups), their interplay with light absorbing particles (LAPs), and the combined effect of suncups and LAPs on surface albedo using 3 years of unique continuous observations on Swiss Alps.
The paper includes an in-depth overview of the current knowledge of snow suncup physics and modelling, with excellent literature review. This knowledge is significantly expanded through the work presented in the paper, which is very well written and very pleasant to read. The discussion is particularly interesting: the limits of the measured dataset, of the modelling approach, and of the assumptions made are properly discussed. The applicability of the developed parameterization of the combined effect of roughness and LAPs on albedo is highlighted, as well as the implications of the results for the snow remote sensing and modelling.
This excellent paper makes a significant contribution to the field of interaction of solar radiation with snow, and for the first time it describes the entangled evolution of suncups and LAPs spatial distribution and their combined impact on albedo. I therefore recommend the editor to accept this paper with minor revision, detailed below. The suggested revision mostly includes requests for clarifications and corrections of typos.
Specific comments:
Line 47: after Betterton (2001), replace “;” with “and”.
Line 90: correct “urface roughness” with “Surface roughness”.
Line 148: The “mean planar extension” is later referred to as “mean equivalent diameter”. I recommend to provide a consistent definition and also explain how it is calculated.
Line 223: could you please explain how you calculated the horizontal roughness index σΔCL from the correlation lenghs CL?
Caption of Figure 1: Please specify the temporal interval of all the time series (it is specified only for wind speed).
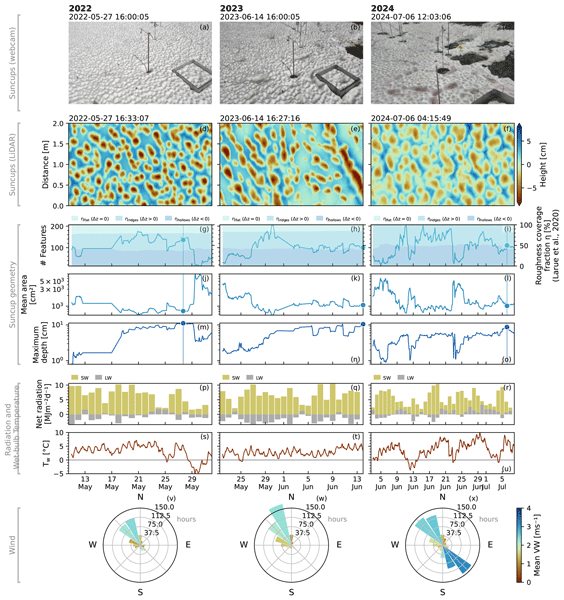
Line 260-261: “depth and size reached peak values of approximately 30 mm and 10 cm”. Please use the same unit for both numbers (cm, as in Fig. 2). 3 cm is not a peak in suncup depth: Fig 2m shows peaks around 11 cm. Do you mean here that when the equivalent suncup diameter was largest (after snowfall) the mean suncup depth decreased to about 3 cm? Please clarify.
Line 261-273: “and depth growth rate was also considerably faster” compared to the other years? please specify. From here until the end of the paragraph, I recommend providing quantitative estimations of the differences between the years, instead of qualitative statements that are difficult to extract from the sublots of Fig 2. Also, please clarify what is σ (the standard deviation of wind direction?).
Caption of Figure 2: please specify that plots g-o and s-u show hourly time series smoothed with a 3h moving average, and explain what the time interval of the data in v, w, x is.
Caption of Figure 3: to simplify, after (d-f) I recommend replacing “Measured and TARTES flat-surface broadband albedo for pristine and impurity-loaded snow under” with “and”.
Line 283: “As the snow wets and SSA decreases, prior to suncup development, the overestimation of albedo in TARTES increases”. The verb “increases” does not seem appropriate. TARTES underestimated albedo in dry conditions, whereas overestimated it in wet conditions. Hence, rather than an increase in bias from dry to wet conditions, there was a change of sign in the bias.
Line 285-290: “We interpret this as the signal of wetting and metamorphism (βwet,smooth)” What “this” refers to? I guess it is the bias between measured and modelled albedo, and not the RMSE, right? Please clarify. Also, I recommend improving the explanation of what βwet,smooth represents. Rather than “the signal of wetting and metamorphism”, I would explain that it a bias due to TARTES misrepresentation of wet snow metamorphism over a flat surface. This will help in understanding your use of βwet,smooth in the calculation of the suncup signature.
Line 293: “This suggests that roughness and impurities jointly contribute to the observed albedo deficit that TARTES cannot reproduce from optical properties alone”. Instead of “from optical properties alone” I recommend using something like “when assuming a flat surface” which I guess is what you mean (optical properties could be parameterized including the effect of roughness, and in that case the observed albedo deficit could disappear just by applying those optical properties).
Line 395-397: “It is only for extremely high impurity contents or algal bloom that the suncup signal partially decouples from the impurity signal. In such cases, the suncup signal either only slightly persists or disappears (Fig. 3m).” I don’t understand what you mean: in my view, the fact that the high impurity content cancels the suncup signature suggests that the combined effect of suncups and impurity content on albedo is comparable to that of the simulated (and possibly too high?) impurity content over a perfectly flat surface. I don’t see how the suncup signal decouples from the impurity signal. Could you please clarify?
Line 304: “High impurity and algal bloom scenarios are, on the other hand, likely on the extreme side, and the fact that residuals fall below zero in such cases seems to support the hypothesis” What do you mean by “on the extreme side”? “Unrealistic”? Please clarify. You are interpreting your results more than making a hypothesis, so I would rephrase the last sentence with something like “as suggested by the fact that residuals fall below zero in such cases”.
Caption of Figure 4: Please specify date and time of the photos in subplots d and e.
Line 315: “At early stages, visible impurities are distributed relatively homogeneously across the snow surface.” I partly disagree. Looking at your Fig 4b, it seems to me that the impurities are concentrated on the upwind side of parallel waves. This does not contradict your conclusion that impurities are more concentrated into the hollows at the final stage of the suncup formation and therefore have less effect on albedo than at the early stage. In fact, it strengthens your conclusions. I would spend few words describing the wavy pattern of the early snow roughness, with parallel ripples aligned perpendicular to the wind (very typical of the interaction of a fluid with the underlying granular material). I think that this is very important, because it explains how impurity and roughness are coupled from the very beginning, and it also makes it easier to understand the further evolution of the roughness into suncups.
Line 472: I suppose that Manninen et al (2012) should be corrected with Manninen et al (2021).
Line 491-501: this whole paragraph seems to be a repetition of the previous one. I suggest removing it.
Citation: https://doi.org/10.5194/egusphere-2026-3049-RC2 -
AC2: 'Reply on RC2', Francesca Carletti, 24 Jul 2026
Dear Reviewers,
Many thanks for the detailed, rigorous reviews of our manuscript and for all the positive, encouraging comments about this work.
Please find attached our point-to-point responses.
With the best regards,
Francesca Carletti, on behalf of all Authors
-
AC2: 'Reply on RC2', Francesca Carletti, 24 Jul 2026
Peer review completion


Interactive discussion
Status: closed
-
RC1: 'Comment on egusphere-2026-3049', Steven Fassnacht, 15 Jul 2026
Review of egusphere-2026-3049 “Seasonal evolution of suncup roughness describes broadband albedo decay on alpine snow”
General
This is a very relevant paper that addresses the difficult topic of disentangling surface roughness and albedo. Suncups and similar features do occur regularly on the snow surface during ablation, and this paper uses a combination of measurements and modeling to understand the processes and the model limitations. This work will help inform additional data collection and is a step towards model improvement.
The collect hourly lidar data for a ∼10 x ∼4 m region of interest over three winters, interpolated to a 5 mm grid. The physical evolution of the suncups is evaluated from a series of metrics. The snowpack is modeled in 1-D using SNOWPACK driven by meteorological data collected onsite. TARTES is used to “simulate the spectral albedo of a flat snowpack” to consider a several impurity scenarios. The flat snowpack surface is modified considering the Löwe and Helbig (2012) albedo parametrization for subgrid topographic shading. The modeling describes the within snowpack properties to match with the geometric properties of the snowpack. Overall, this is a solid approach.
The time series analysis of the suncups, together with the interpretation of the meteorological data provides some excellent insight into processes. This is likely a unique dataset that allows for this interpretation – well done.
Some of the interpretation, such as “impurities act as thermal insulators for snow” (lines 347-348) may not be fully justified. However, I appreciate that the authors are piecing together the story. Overall, well done. I really like this paper and enjoyed reading it. I wanted to have a lot more to say (I do have specific comments below), but I don’t need to criticize excellent work!
What to address:
How is z0 computed from Lettau (1969)? This is not trivial, yet it is not explained in the Methods section.
I not this below (lines 433 and 483) about “scavenging of impurities.” This could be true but has not directly been seen. Instead, impurities, specifically dust, tend to accumulate at the surface. Within a suncup, they can be redistributed to the bottom and concentrated at the ridges. Consider how you write this.
While it is impossible to disentangle impurities versus roughness, it should at least be discussed that some amount of impurities may not allow suncups to form (Fassnacht et al., 2009; cited in the paper) or may reduce roughness (Fassnacht et al., 2010; cited above). This could be briefly discussed in the paper.
Specifics
- Lines 34-35: “since pyranometer-based measurements inherently integrate the effects of surface roughness within their radiative footprint” – also, consider which (intrinsic vs. apparent) impacts the energy balance
- Lines 39, 107, 333, and elsewhere: it should be “elevation” and not “altitude.” I know that people interchange these, but “altitude” is above the ground and here you are speaking to the “elevation” of the snowpack.
- Line 74: This is not crucial, but I would assume that nutrients in any dust, beside “Saharan” dust, may also drive algal blooms.
- Line 90 (mid-line): the “s” is missing from “surface”
- Line 133: I recommend using the word “slope” rather than “altitude,” as it is the removal of the bias of the overall surface slope (in X and Y) on the surface roughness indices (Fassnacht et al., 2009; https://doi.org/10.1029/2008WR006986)
- Line 138: “the raster-based version of Lettau (1969)” can also be computed by Neville et al. (2025; https://doi.org/10.3390/rs17121984). Mostly as FYI here. Your method of applying Lettau (1969) is not explained.
- Line 144-146: Sastrugi fields are much direction than sun cups. Mostly as FYI here.
- Table 1: should appear after it is cited on line 174
- Table 1: is there a difference between Black Carbon versus Dust modeled in SNOWPACK, i.e., should there be scenarios where one is 0 and the other is > 0?
- Line 161-162: How is “[s]uch information is combined with the nearest acquisition of surface roughness in time?”
- Line 214: “Multiple reflections are not accounted for under either condition in the parametrization of Löwe and Helbig (2012).” Understandable that this is not included due to the computations burden. But are the implications of not doing this discussed? This could/likely further reduces albedo.
- Line 230: what do you mean by “flattens to a near-zero trend?” In particular, the word “trend” seems unclear.
- Figure 1: I really like this figure. It is very informative. Would it be worthwhile putting (a) to (f) on a log scale to highlight the difference between vertical and horizontal being dominant?
- Figure 2: Is it worth it to denote when in the time series (g) to (u) the photos and surface geometry from (a) to (f) where taken? A vertical line provide context.
- Line 252: why a 5x5 m sub-domain and not the 10 x 4 m lidar domain?
- Lines 277-280: these are Methods, not Results
- Lines 337-339, especially the part of the sentence “it provides a simple diagnostic …” is very insightful. No action necessary.
- Lines 433, 483 (and I think elsewhere?): “impurities that are not scavenged through percolating meltwater.” This really depends on the size, color (albedo) and composition of the impurities. Larger impurities “melt” into the snowpack (Fassnacht et al., 2010; https://doi.org/10.1002/hyp.7661) but dust generally tends to stay close to the surface and “accumulates” as the snow melts down to subsequent dust layers. This is not crucial, but the processes is not the same as ionic elution (e.g., Bales et al., 1989; https://doi.org/10.1029/WR025i008p01869) where the ions move through the snowpack. In line 483, redistribution within the suncup is understood, but scavenging may not be correct. Reconsider how this is written.
- Lines 454-455: “tracking both suncup geometry and LAPs distribution at the same fine spatial resolution” –does your TLS not collect RGB (or red reflectivity if the TLS is 532 nm) data at the same time and resolution at the geometry? While I don’t expect the analysis of said data (to overcome this fundamental obstacle), it should at least be mentioned here that some of these data are available. Or not?
- Line 463: change the word “lower” to “smaller” as the former may indicate height
- Lines 489-490: “these results highlight the potential value of assimilating surface roughness observations into snow energy balance models” – z0 varies but is considered a constant in most (all?) models. z0 was varied in SNOWPACK (Sanow et al., 2024; https://doi.org/10.1016/j.polar.2024.101110) and this yielded quite different simulated turbulent fluxes.
- Lines 491-501: This last paragraph seems to be a repeat of previous statements. Consider making this its own subsection, as I think it is an important summary. Maybe it is the last paragraph of the Conclusions?
Citation: https://doi.org/10.5194/egusphere-2026-3049-RC1 -
AC1: 'Reply on RC1', Francesca Carletti, 24 Jul 2026
Dear Reviewers,
Many thanks for the detailed, rigorous reviews of our manuscript and for all the positive, encouraging comments about this work.
Please find attached our point-to-point responses.
With the best regards,
Francesca Carletti, on behalf of all Authors
-
RC2: 'Comment on egusphere-2026-3049', Anonymous Referee #2, 19 Jul 2026
The paper addresses the seasonal evolution of snow surface roughness features (suncups), their interplay with light absorbing particles (LAPs), and the combined effect of suncups and LAPs on surface albedo using 3 years of unique continuous observations on Swiss Alps.
The paper includes an in-depth overview of the current knowledge of snow suncup physics and modelling, with excellent literature review. This knowledge is significantly expanded through the work presented in the paper, which is very well written and very pleasant to read. The discussion is particularly interesting: the limits of the measured dataset, of the modelling approach, and of the assumptions made are properly discussed. The applicability of the developed parameterization of the combined effect of roughness and LAPs on albedo is highlighted, as well as the implications of the results for the snow remote sensing and modelling.
This excellent paper makes a significant contribution to the field of interaction of solar radiation with snow, and for the first time it describes the entangled evolution of suncups and LAPs spatial distribution and their combined impact on albedo. I therefore recommend the editor to accept this paper with minor revision, detailed below. The suggested revision mostly includes requests for clarifications and corrections of typos.
Specific comments:
Line 47: after Betterton (2001), replace “;” with “and”.
Line 90: correct “urface roughness” with “Surface roughness”.
Line 148: The “mean planar extension” is later referred to as “mean equivalent diameter”. I recommend to provide a consistent definition and also explain how it is calculated.
Line 223: could you please explain how you calculated the horizontal roughness index σΔCL from the correlation lenghs CL?
Caption of Figure 1: Please specify the temporal interval of all the time series (it is specified only for wind speed).
Line 260-261: “depth and size reached peak values of approximately 30 mm and 10 cm”. Please use the same unit for both numbers (cm, as in Fig. 2). 3 cm is not a peak in suncup depth: Fig 2m shows peaks around 11 cm. Do you mean here that when the equivalent suncup diameter was largest (after snowfall) the mean suncup depth decreased to about 3 cm? Please clarify.
Line 261-273: “and depth growth rate was also considerably faster” compared to the other years? please specify. From here until the end of the paragraph, I recommend providing quantitative estimations of the differences between the years, instead of qualitative statements that are difficult to extract from the sublots of Fig 2. Also, please clarify what is σ (the standard deviation of wind direction?).
Caption of Figure 2: please specify that plots g-o and s-u show hourly time series smoothed with a 3h moving average, and explain what the time interval of the data in v, w, x is.
Caption of Figure 3: to simplify, after (d-f) I recommend replacing “Measured and TARTES flat-surface broadband albedo for pristine and impurity-loaded snow under” with “and”.
Line 283: “As the snow wets and SSA decreases, prior to suncup development, the overestimation of albedo in TARTES increases”. The verb “increases” does not seem appropriate. TARTES underestimated albedo in dry conditions, whereas overestimated it in wet conditions. Hence, rather than an increase in bias from dry to wet conditions, there was a change of sign in the bias.
Line 285-290: “We interpret this as the signal of wetting and metamorphism (βwet,smooth)” What “this” refers to? I guess it is the bias between measured and modelled albedo, and not the RMSE, right? Please clarify. Also, I recommend improving the explanation of what βwet,smooth represents. Rather than “the signal of wetting and metamorphism”, I would explain that it a bias due to TARTES misrepresentation of wet snow metamorphism over a flat surface. This will help in understanding your use of βwet,smooth in the calculation of the suncup signature.
Line 293: “This suggests that roughness and impurities jointly contribute to the observed albedo deficit that TARTES cannot reproduce from optical properties alone”. Instead of “from optical properties alone” I recommend using something like “when assuming a flat surface” which I guess is what you mean (optical properties could be parameterized including the effect of roughness, and in that case the observed albedo deficit could disappear just by applying those optical properties).
Line 395-397: “It is only for extremely high impurity contents or algal bloom that the suncup signal partially decouples from the impurity signal. In such cases, the suncup signal either only slightly persists or disappears (Fig. 3m).” I don’t understand what you mean: in my view, the fact that the high impurity content cancels the suncup signature suggests that the combined effect of suncups and impurity content on albedo is comparable to that of the simulated (and possibly too high?) impurity content over a perfectly flat surface. I don’t see how the suncup signal decouples from the impurity signal. Could you please clarify?
Line 304: “High impurity and algal bloom scenarios are, on the other hand, likely on the extreme side, and the fact that residuals fall below zero in such cases seems to support the hypothesis” What do you mean by “on the extreme side”? “Unrealistic”? Please clarify. You are interpreting your results more than making a hypothesis, so I would rephrase the last sentence with something like “as suggested by the fact that residuals fall below zero in such cases”.
Caption of Figure 4: Please specify date and time of the photos in subplots d and e.
Line 315: “At early stages, visible impurities are distributed relatively homogeneously across the snow surface.” I partly disagree. Looking at your Fig 4b, it seems to me that the impurities are concentrated on the upwind side of parallel waves. This does not contradict your conclusion that impurities are more concentrated into the hollows at the final stage of the suncup formation and therefore have less effect on albedo than at the early stage. In fact, it strengthens your conclusions. I would spend few words describing the wavy pattern of the early snow roughness, with parallel ripples aligned perpendicular to the wind (very typical of the interaction of a fluid with the underlying granular material). I think that this is very important, because it explains how impurity and roughness are coupled from the very beginning, and it also makes it easier to understand the further evolution of the roughness into suncups.
Line 472: I suppose that Manninen et al (2012) should be corrected with Manninen et al (2021).
Line 491-501: this whole paragraph seems to be a repetition of the previous one. I suggest removing it.
Citation: https://doi.org/10.5194/egusphere-2026-3049-RC2 -
AC2: 'Reply on RC2', Francesca Carletti, 24 Jul 2026
Dear Reviewers,
Many thanks for the detailed, rigorous reviews of our manuscript and for all the positive, encouraging comments about this work.
Please find attached our point-to-point responses.
With the best regards,
Francesca Carletti, on behalf of all Authors
-
AC2: 'Reply on RC2', Francesca Carletti, 24 Jul 2026
Peer review completion
Journal article(s) based on this preprint
Viewed
| HTML | XML | Total | BibTeX | EndNote | |
|---|---|---|---|---|---|
| 244 | 110 | 44 | 398 | 30 | 29 |
- HTML: 244
- PDF: 110
- XML: 44
- Total: 398
- BibTeX: 30
- EndNote: 29
Viewed (geographical distribution)
| Country | # | Views | % |
|---|
| Total: | 0 |
| HTML: | 0 |
| PDF: | 0 |
| XML: | 0 |
- 1
Francesca Carletti

Nora Helbig
Nander Wever
Loïc Brouet
Mathias Bavay
Benjamin Walter
Michael Lehning
The requested preprint has a corresponding peer-reviewed final revised paper. You are encouraged to refer to the final revised version.
- Preprint
(6887 KB) - Metadata XML
Review of egusphere-2026-3049 “Seasonal evolution of suncup roughness describes broadband albedo decay on alpine snow”
General
This is a very relevant paper that addresses the difficult topic of disentangling surface roughness and albedo. Suncups and similar features do occur regularly on the snow surface during ablation, and this paper uses a combination of measurements and modeling to understand the processes and the model limitations. This work will help inform additional data collection and is a step towards model improvement.
The collect hourly lidar data for a ∼10 x ∼4 m region of interest over three winters, interpolated to a 5 mm grid. The physical evolution of the suncups is evaluated from a series of metrics. The snowpack is modeled in 1-D using SNOWPACK driven by meteorological data collected onsite. TARTES is used to “simulate the spectral albedo of a flat snowpack” to consider a several impurity scenarios. The flat snowpack surface is modified considering the Löwe and Helbig (2012) albedo parametrization for subgrid topographic shading. The modeling describes the within snowpack properties to match with the geometric properties of the snowpack. Overall, this is a solid approach.
The time series analysis of the suncups, together with the interpretation of the meteorological data provides some excellent insight into processes. This is likely a unique dataset that allows for this interpretation – well done.
Some of the interpretation, such as “impurities act as thermal insulators for snow” (lines 347-348) may not be fully justified. However, I appreciate that the authors are piecing together the story. Overall, well done. I really like this paper and enjoyed reading it. I wanted to have a lot more to say (I do have specific comments below), but I don’t need to criticize excellent work!
What to address:
How is z0 computed from Lettau (1969)? This is not trivial, yet it is not explained in the Methods section.
I not this below (lines 433 and 483) about “scavenging of impurities.” This could be true but has not directly been seen. Instead, impurities, specifically dust, tend to accumulate at the surface. Within a suncup, they can be redistributed to the bottom and concentrated at the ridges. Consider how you write this.
While it is impossible to disentangle impurities versus roughness, it should at least be discussed that some amount of impurities may not allow suncups to form (Fassnacht et al., 2009; cited in the paper) or may reduce roughness (Fassnacht et al., 2010; cited above). This could be briefly discussed in the paper.
Specifics