
the Creative Commons Attribution 4.0 License.
the Creative Commons Attribution 4.0 License.
 | 29 May 2026
Statistical properties of internal modulation in pulsating aurora
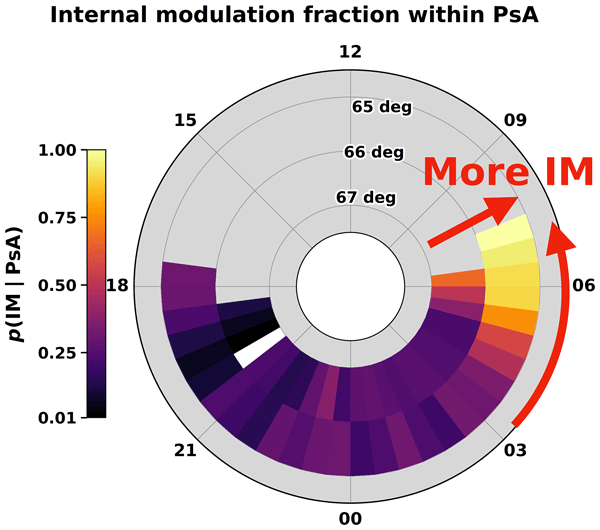
Abstract. We statistically investigated the occurrence characteristics of internal modulation (IM), a rapid intensity modulation of a few hertz embedded in pulsating aurora (PsA), using high-speed ground-based optical data obtained with qCMOS cameras. For datasets acquired at Kiruna, Sweden, and Skibotn, Norway, we applied a two-step hierarchical machine-learning classification, first identifying the presence of PsA and then determining whether IM was present within the PsA. This enabled IM, which has previously been examined mainly through case studies, to be quantified for the first time in a systematic and statistically comparable manner. The results show that the fraction of PsA accompanied by IM increases toward the morning-sector magnetic local time (MLT) sector and tends to be higher at the lower-latitude site, Kiruna, than at the higher-latitude site, Skibotn. Representative examples from the classification results show that, on the midnight sector, IM commonly appears as a hierarchical structure superposed on clear main pulsations, whereas on the morning sector, the main pulsation tends to be relatively weak and the IM component often becomes dominant, suggesting that the morphology of IM itself also depends on MLT. These results suggest that IM is not merely an apparent subtype accompanying PsA, but rather a diagnostic feature that may provide insight into the wave--particle interaction underlying PsA.
Competing interests: At least one of the (co-)authors is a member of the editorial board of Annales Geophysicae. The peer-review process was guided by an independent editor, and the authors also have no other competing interests to declare.
Publisher's note: Copernicus Publications remains neutral with regard to jurisdictional claims made in the text, published maps, institutional affiliations, or any other geographical representation in this paper. While Copernicus Publications makes every effort to include appropriate place names, the final responsibility lies with the authors. Views expressed in the text are those of the authors and do not necessarily reflect the views of the publisher.-
Notice on discussion status
The requested preprint has a corresponding peer-reviewed final revised paper. You are encouraged to refer to the final revised version.
-
Preprint
(12617 KB)
-
The requested preprint has a corresponding peer-reviewed final revised paper. You are encouraged to refer to the final revised version.
- Preprint
(12617 KB) - Metadata XML
- BibTeX
- EndNote
- Final revised paper


Journal article(s) based on this preprint
Interactive discussion
Status: closed
-
RC1: 'Comment on egusphere-2026-2506', Allison Jaynes, 29 Jun 2026
-
AC1: 'Reply on RC1', Sota Nanjo, 10 Aug 2026
We thank the referee for carefully reviewing our manuscript and for the constructive comments and suggestions. Below, each referee comment is followed by our planned approach to revision.
Comment 1
Line 58: The text states that the IM “presumably reflect the generation of discrete chorus elements”, implying that patchy pulsations do not contain such discrete elements, but I think this is a mischaracterization and is not supported by the data included in this study. The patchy pulsating aurora (without IM) may well contain discrete elements but only lower energy precipitation (possibly from the lack of high-latitude propagation, as argued in Miyoshi 2020). In that 2020 paper, the ‘patch’ luminosity varies on the larger scale for lower energy precipitation while the bursty luminosity, that corresponds to individual chorus elements, varies on the scale of IM. It doesn’t mean there is no generation of chorus elements just because there is no IM present. I think this can be more plainly stated here in the introduction, by making it clear that there are multiple reasons why IM would or would not be present — as are discussed in the Discussion section.
Response:
We will revise the final paragraph of the Introduction so that the absence of optically identifiable IM is not interpreted as evidence for the absence of discrete chorus elements. We will instead state that several factors may affect whether IM is visible in optical observations, including variations in the temporal structure and propagation of chorus waves.
Comment 2
Figure 2 and associated text: It would be excellent to see a line plot of the IM, as well as the larger patches. The IM are difficult to pick out in the keogram format, but a horizontal cut would show the modulations clearly as well as how close to background they are, which is important for reasons stated later in the paper. I suggest adding a panel showing these line plots for panels (a) and (b).
Response:
We will add line plots for Figures 2(a) and 2(b), using the raw signal extracted from narrow horizontal bands marked in the keograms. The two plots will use the same vertical span so that the modulation amplitudes and their levels relative to the background can be compared directly.
Comment 3
Figures 4, 5, and Results: It is difficult to understand the physical reasons underlying the drastic difference in occurrence rate of IM over a 1.7 degree change in magnetic latitude. Could you speculate on this more in the Discussion? Is there no chance it is due to observational bias? You have done a rigorous job of explaining the robustness of the model results, but it is still a bit baffling that such a strong delta exists over this relatively small latitudinal range.
Response:
We will examine the robustness of the site-to-site difference more directly. This will include repeating the analysis with a broader auroral pre-screen, evaluating qCMOS data availability and observable exposure, and considering weather, lunar conditions, PsA occurrence, and differences in the parts of the auroral oval sampled by the two sites. We will add these checks to an appendix and expand the Discussion of both observational biases and possible geometrical or physical explanations.
Comment 4
Discussion: I think it might be worth commenting even more on microbursts directly and their potential relationship to the conclusions presented here. If IM are indeed a signature of the high-energy tail of PA, then the kind of statistics you show here is very important for understanding radiation belt dynamics and that energy transfer from the magnetosphere to the atmosphere. It would be great to include the observations by Shumko et al. 2021 and by Elliott et al. 2022 when discussing these implications. I think it’s worth pointing out how ELFIN or REAL cubesats may help make the connection between the optical signatures you show and the microburst/relativisitc signatures measured in the precipitation.
Response:
We will expand the Discussion of the possible relationship between optical IM and energetic-electron microbursts, including Shumko et al. (2021) and Elliott et al. (2022). We will also note that coordinated optical observations and particle measurements from missions such as ELFIN and REAL could test this connection, while making clear that optical observations alone cannot identify relativistic microbursts.
Citation: https://doi.org/10.5194/egusphere-2026-2506-AC1
-
AC1: 'Reply on RC1', Sota Nanjo, 10 Aug 2026
-
RC2: 'Comment on egusphere-2026-2506', Maxime Grandin, 16 Jul 2026
Summary
This manuscript presents a statistical study of pulsating aurora – especially regarding internal modulation of the optical emissions at a few hertz – relying on automated classification of keograms from two high-cadence imagers in northern Scandinavia using machine learning methods. The analysis first identifies 1 min intervals containing pulsating aurora, and as a second step assesses whether internal modulation is present and dominates the internal structuring of the pulsating aurora structures. The Authors then analyse the magnetic local time distribution of pulsating aurora associated with internal modulations. They find a statistically significant increase in the fraction of pulsating aurora with internal modulation towards the morning sector, especially at the lower-latitude site (Kiruna). Based on an example night of observations, they also highlight that pulsating aurora with internal modulations can take various forms, sometimes with modulations clearly embedded within well-defined patches, whereas in other cases the internal modulations dominate the structuring of the pulsating aurora.
The manuscript is very well written, the methodology is carefully detailed, the figures are of high quality, and the presented results are very suitable for Annales Geophysicae. I only have a few minor comments and suggestions to offer to the Authors; I believe that this manuscript is otherwise almost publishable as is.
Minor comments
– l. 41: Would it be possible to indicate an order of magnitude for the typical amplitude of the internal modulation?
– l. 96: The definition of the F1 score could be introduced already here (rather than on l. 131)
– l. 111: Would it be worth indicating how many different nights of observations comprise keograms labelled as containing PsA and as containing IM within PsA? It could be insightful to relate these numbers to that of manually annotated Kiruna keograms given just above.
– Fig. 2: Since this is the first figure showing keograms and discussing the PsA morphologies, I suggest adding arrows in the various panels to help the reader recognise the identified signatures, and refer to these in the text when describing the figure.
– l. 166: I would suggest mentioning the number of test keograms earlier in the manuscript (e.g. in Sect. 3.1) and briefly explaining how the test set was selected (in a similar way as for the training set) and how many different nights it contains.
– l. 258: Was there any particular reason to select this specific night (20–21 November 2025)? Is there a way to assess to what extent it is a representative night? If possible, please briefly comment on it.
– l. 387: On microbursts, Kang et al. (2022) studied scale size and effects of oblique propagation of chorus waves in the inner magnetosphere; their results might prove worth briefly discussing in this paragraph.
– l. 397: Could the claims based on Fig. 8B, regarding the morphology of the IM in the midnight and morning sectors, be substantiated with some numbers? For instance, you could make an argument based on the test data set that you have inspected thoroughly and which is of a reasonable size to make rough statistics, which would presumably not require an extensive amount of additional work.
– Discussion: I wonder whether from your analysis you could identify any seasonal trend for IM occurrence; is this something you have considered looking into? It could be worth briefly discussing it if there is anything worth noting on that respect.
– Discussion: It could be worth discussing whether IM may be preferably associated with patchy pulsating aurora (PPA) or amorphous pulsating aurora (APA), if this is an aspect that you could investigate without too many difficulties. Your results could then be discussed in relation to PPA/APA studies (e.g. Grono & Donovan, 2020; Tesema et al., 2020).
Cited references
– Grono & Donovan (2020), https://doi.org/10.5194/angeo-38-1-2020
– Kang et al. (2022), https://doi.org/10.1029/2022GL100841
– Tesema et al. (2020), https://doi.org/10.5194/angeo-38-1191-2020
Citation: https://doi.org/10.5194/egusphere-2026-2506-RC2 -
AC2: 'Reply on RC2', Sota Nanjo, 10 Aug 2026
We thank the referee for carefully reviewing our manuscript and for the constructive comments and suggestions. Below, each referee comment is followed by our planned approach to revision.
Minor comment 1
l. 41: Would it be possible to indicate an order of magnitude for the typical amplitude of the internal modulation?
Response:
We will add a reference in the Introduction. We plan to cite Røyrvik and Davis (1977), who reported that the 3 ± 1 Hz modulation could reach approximately 20% in relative intensity.
Minor comment 2
l. 96: The definition of the F1 score could be introduced already here (rather than on l. 131)
Response:
We will move the definition of the F1 score to its first appearance and remove the later duplicate definition.
Minor comment 3
l. 111: Would it be worth indicating how many different nights of observations comprise keograms labelled as containing PsA and as containing IM within PsA? It could be insightful to relate these numbers to that of manually annotated Kiruna keograms given just above.
Response:
We will report the number of observing nights represented in the manually annotated dataset and in the PsA-positive and IM-positive subsets, alongside the corresponding numbers of keograms.
Minor comment 4
Fig. 2: Since this is the first figure showing keograms and discussing the PsA morphologies, I suggest adding arrows in the various panels to help the reader recognise the identified signatures, and refer to these in the text when describing the figure.
Response:
We will add arrows to the Figure 2 panels to identify representative PsA structures without IM, regions with visible IM, and the discrete auroral structure that is not classified as PsA. We will refer to the arrows explicitly in the accompanying text.
Minor comment 5
l. 166: I would suggest mentioning the number of test keograms earlier in the manuscript (e.g. in Sect. 3.1) and briefly explaining how the test set was selected (in a similar way as for the training set) and how many different nights it contains.
Response:
We will describe the night-level training, validation, and test split earlier in the manuscript, including the numbers of keograms and observing nights in each subset. We will also state explicitly that the independent test set is used only for final performance evaluation.
Minor comment 6
l. 258: Was there any particular reason to select this specific night (20–21 November 2025)? Is there a way to assess to what extent it is a representative night? If possible, please briefly comment on it.
Response:
We will explain that this night was selected because auroral activity persisted throughout the night, allowing the evening-to-morning evolution to be illustrated continuously, and because it was not used for model training. We will clarify that the event is intended as an illustration of the morphologies underlying the statistical tendencies, rather than as a statistically representative night.
Minor comment 7
l. 387: On microbursts, Kang et al. (2022) studied scale size and effects of oblique propagation of chorus waves in the inner magnetosphere; their results might prove worth briefly discussing in this paragraph.
Response:
We will examine Kang et al. (2022) and consider whether its results on chorus-wave scale size and oblique propagation can be briefly discussed in relation to the present optical observations.
Minor comment 8
l. 397: Could the claims based on Fig. 8B, regarding the morphology of the IM in the midnight and morning sectors, be substantiated with some numbers? For instance, you could make an argument based on the test data set that you have inspected thoroughly and which is of a reasonable size to make rough statistics, which would presumably not require an extensive amount of additional work.
Response:
Following the referee’s suggestion, we will visually inspect the test dataset to make a rough quantitative comparison of IM morphology between the midnight and morning sectors, and briefly add the result to the Discussion.
Minor comment 9
Discussion: I wonder whether from your analysis you could identify any seasonal trend for IM occurrence; is this something you have considered looking into? It could be worth briefly discussing it if there is anything worth noting on that respect.
Response:
We will examine the monthly IM fraction using the same classification and uncertainty scheme as in the main analysis and show the result to the referee.
Minor comment 10
Discussion: It could be worth discussing whether IM may be preferably associated with patchy pulsating aurora (PPA) or amorphous pulsating aurora (APA), if this is an aspect that you could investigate without too many difficulties. Your results could then be discussed in relation to PPA/APA studies (e.g. Grono & Donovan, 2020; Tesema et al., 2020).
Response:
We will consider whether the present dataset allows a meaningful assessment of the association between IM and PPA/APA, taking into account the limitations of the one-dimensional keograms.
Citation: https://doi.org/10.5194/egusphere-2026-2506-AC2
-
AC2: 'Reply on RC2', Sota Nanjo, 10 Aug 2026
Peer review completion


Interactive discussion
Status: closed
-
RC1: 'Comment on egusphere-2026-2506', Allison Jaynes, 29 Jun 2026
General comments
This manuscript details the identification and statistical analysis of internal modulations embedded within pulsating aurora at a few Hz frequency across MLT and two different latitudes. The results show a preference for internal modulations in the morning sector and at the lower latitude station (65 degrees MLAT vs 67 degrees MLAT). The overall conclusion of the paper has the potential to be very impactful for the community, especially those studying M-I coupling and energy transfer, microbursts, and wave-particle interactions in the inner magnetosphere. The paper is very well-written and includes appropriate citations. The conclusions are very significant and timely. I suggest publication after the authors consider a few minor suggestions.
Specific comments
- Line 58: The text states that the IM “presumably reflect the generation of discrete chorus elements”, implying that patchy pulsations do not contain such discrete elements, but I think this is a mischaracterization and is not supported by the data included in this study. The patchy pulsating aurora (without IM) may well contain discrete elements but only lower energy precipitation (possibly from the lack of high-latitude propagation, as argued in Miyoshi 2020). In that 2020 paper, the ‘patch’ luminosity varies on the larger scale for lower energy precipitation while the bursty luminosity, that corresponds to individual chorus elements, varies on the scale of IM. It doesn’t mean there is no generation of chorus elements just because there is no IM present. I think this can be more plainly stated here in the introduction, by making it clear that there are multiple reasons why IM would or would not be present — as are discussed in the Discussion section.
- Figure 2 and associated text: It would be excellent to see a line plot of the IM, as well as the larger patches. The IM are difficult to pick out in the keogram format, but a horizontal cut would show the modulations clearly as well as how close to background they are, which is important for reasons stated later in the paper. I suggest adding a panel showing these line plots for panels (a) and (b).
- Figures 4, 5, and Results: It is difficult to understand the physical reasons underlying the drastic difference in occurrence rate of IM over a 1.7 degree change in magnetic latitude. Could you speculate on this more in the Discussion? Is there no chance it is due to observational bias? You have done a rigorous job of explaining the robustness of the model results, but it is still a bit baffling that such a strong delta exists over this relatively small latitudinal range.
- Discussion: I think it might be worth commenting even more on microbursts directly and their potential relationship to the conclusions presented here. If IM are indeed a signature of the high-energy tail of PA, then the kind of statistics you show here is very important for understanding radiation belt dynamics and that energy transfer from the magnetosphere to the atmosphere. It would be great to include the observations by Shumko et al. 2021 (https://agupubs.onlinelibrary.wiley.com/doi/full/10.1029/2021GL094696) and by Elliott et al. 2022 (https://essopenarchive.org/doi/full/10.1002/essoar.10511530.1) when discussing these implications. I think it’s worth pointing out how ELFIN or REAL cubesats may help make the connection between the optical signatures you show and the microburst/relativisitc signatures measured in the precipitation.
Citation: https://doi.org/10.5194/egusphere-2026-2506-RC1 -
AC1: 'Reply on RC1', Sota Nanjo, 10 Aug 2026
We thank the referee for carefully reviewing our manuscript and for the constructive comments and suggestions. Below, each referee comment is followed by our planned approach to revision.
Comment 1
Line 58: The text states that the IM “presumably reflect the generation of discrete chorus elements”, implying that patchy pulsations do not contain such discrete elements, but I think this is a mischaracterization and is not supported by the data included in this study. The patchy pulsating aurora (without IM) may well contain discrete elements but only lower energy precipitation (possibly from the lack of high-latitude propagation, as argued in Miyoshi 2020). In that 2020 paper, the ‘patch’ luminosity varies on the larger scale for lower energy precipitation while the bursty luminosity, that corresponds to individual chorus elements, varies on the scale of IM. It doesn’t mean there is no generation of chorus elements just because there is no IM present. I think this can be more plainly stated here in the introduction, by making it clear that there are multiple reasons why IM would or would not be present — as are discussed in the Discussion section.
Response:
We will revise the final paragraph of the Introduction so that the absence of optically identifiable IM is not interpreted as evidence for the absence of discrete chorus elements. We will instead state that several factors may affect whether IM is visible in optical observations, including variations in the temporal structure and propagation of chorus waves.
Comment 2
Figure 2 and associated text: It would be excellent to see a line plot of the IM, as well as the larger patches. The IM are difficult to pick out in the keogram format, but a horizontal cut would show the modulations clearly as well as how close to background they are, which is important for reasons stated later in the paper. I suggest adding a panel showing these line plots for panels (a) and (b).
Response:
We will add line plots for Figures 2(a) and 2(b), using the raw signal extracted from narrow horizontal bands marked in the keograms. The two plots will use the same vertical span so that the modulation amplitudes and their levels relative to the background can be compared directly.
Comment 3
Figures 4, 5, and Results: It is difficult to understand the physical reasons underlying the drastic difference in occurrence rate of IM over a 1.7 degree change in magnetic latitude. Could you speculate on this more in the Discussion? Is there no chance it is due to observational bias? You have done a rigorous job of explaining the robustness of the model results, but it is still a bit baffling that such a strong delta exists over this relatively small latitudinal range.
Response:
We will examine the robustness of the site-to-site difference more directly. This will include repeating the analysis with a broader auroral pre-screen, evaluating qCMOS data availability and observable exposure, and considering weather, lunar conditions, PsA occurrence, and differences in the parts of the auroral oval sampled by the two sites. We will add these checks to an appendix and expand the Discussion of both observational biases and possible geometrical or physical explanations.
Comment 4
Discussion: I think it might be worth commenting even more on microbursts directly and their potential relationship to the conclusions presented here. If IM are indeed a signature of the high-energy tail of PA, then the kind of statistics you show here is very important for understanding radiation belt dynamics and that energy transfer from the magnetosphere to the atmosphere. It would be great to include the observations by Shumko et al. 2021 and by Elliott et al. 2022 when discussing these implications. I think it’s worth pointing out how ELFIN or REAL cubesats may help make the connection between the optical signatures you show and the microburst/relativisitc signatures measured in the precipitation.
Response:
We will expand the Discussion of the possible relationship between optical IM and energetic-electron microbursts, including Shumko et al. (2021) and Elliott et al. (2022). We will also note that coordinated optical observations and particle measurements from missions such as ELFIN and REAL could test this connection, while making clear that optical observations alone cannot identify relativistic microbursts.
Citation: https://doi.org/10.5194/egusphere-2026-2506-AC1
-
RC2: 'Comment on egusphere-2026-2506', Maxime Grandin, 16 Jul 2026
Summary
This manuscript presents a statistical study of pulsating aurora – especially regarding internal modulation of the optical emissions at a few hertz – relying on automated classification of keograms from two high-cadence imagers in northern Scandinavia using machine learning methods. The analysis first identifies 1 min intervals containing pulsating aurora, and as a second step assesses whether internal modulation is present and dominates the internal structuring of the pulsating aurora structures. The Authors then analyse the magnetic local time distribution of pulsating aurora associated with internal modulations. They find a statistically significant increase in the fraction of pulsating aurora with internal modulation towards the morning sector, especially at the lower-latitude site (Kiruna). Based on an example night of observations, they also highlight that pulsating aurora with internal modulations can take various forms, sometimes with modulations clearly embedded within well-defined patches, whereas in other cases the internal modulations dominate the structuring of the pulsating aurora.
The manuscript is very well written, the methodology is carefully detailed, the figures are of high quality, and the presented results are very suitable for Annales Geophysicae. I only have a few minor comments and suggestions to offer to the Authors; I believe that this manuscript is otherwise almost publishable as is.
Minor comments
– l. 41: Would it be possible to indicate an order of magnitude for the typical amplitude of the internal modulation?
– l. 96: The definition of the F1 score could be introduced already here (rather than on l. 131)
– l. 111: Would it be worth indicating how many different nights of observations comprise keograms labelled as containing PsA and as containing IM within PsA? It could be insightful to relate these numbers to that of manually annotated Kiruna keograms given just above.
– Fig. 2: Since this is the first figure showing keograms and discussing the PsA morphologies, I suggest adding arrows in the various panels to help the reader recognise the identified signatures, and refer to these in the text when describing the figure.
– l. 166: I would suggest mentioning the number of test keograms earlier in the manuscript (e.g. in Sect. 3.1) and briefly explaining how the test set was selected (in a similar way as for the training set) and how many different nights it contains.
– l. 258: Was there any particular reason to select this specific night (20–21 November 2025)? Is there a way to assess to what extent it is a representative night? If possible, please briefly comment on it.
– l. 387: On microbursts, Kang et al. (2022) studied scale size and effects of oblique propagation of chorus waves in the inner magnetosphere; their results might prove worth briefly discussing in this paragraph.
– l. 397: Could the claims based on Fig. 8B, regarding the morphology of the IM in the midnight and morning sectors, be substantiated with some numbers? For instance, you could make an argument based on the test data set that you have inspected thoroughly and which is of a reasonable size to make rough statistics, which would presumably not require an extensive amount of additional work.
– Discussion: I wonder whether from your analysis you could identify any seasonal trend for IM occurrence; is this something you have considered looking into? It could be worth briefly discussing it if there is anything worth noting on that respect.
– Discussion: It could be worth discussing whether IM may be preferably associated with patchy pulsating aurora (PPA) or amorphous pulsating aurora (APA), if this is an aspect that you could investigate without too many difficulties. Your results could then be discussed in relation to PPA/APA studies (e.g. Grono & Donovan, 2020; Tesema et al., 2020).
Cited references
– Grono & Donovan (2020), https://doi.org/10.5194/angeo-38-1-2020
– Kang et al. (2022), https://doi.org/10.1029/2022GL100841
– Tesema et al. (2020), https://doi.org/10.5194/angeo-38-1191-2020
Citation: https://doi.org/10.5194/egusphere-2026-2506-RC2 -
AC2: 'Reply on RC2', Sota Nanjo, 10 Aug 2026
We thank the referee for carefully reviewing our manuscript and for the constructive comments and suggestions. Below, each referee comment is followed by our planned approach to revision.
Minor comment 1
l. 41: Would it be possible to indicate an order of magnitude for the typical amplitude of the internal modulation?
Response:
We will add a reference in the Introduction. We plan to cite Røyrvik and Davis (1977), who reported that the 3 ± 1 Hz modulation could reach approximately 20% in relative intensity.
Minor comment 2
l. 96: The definition of the F1 score could be introduced already here (rather than on l. 131)
Response:
We will move the definition of the F1 score to its first appearance and remove the later duplicate definition.
Minor comment 3
l. 111: Would it be worth indicating how many different nights of observations comprise keograms labelled as containing PsA and as containing IM within PsA? It could be insightful to relate these numbers to that of manually annotated Kiruna keograms given just above.
Response:
We will report the number of observing nights represented in the manually annotated dataset and in the PsA-positive and IM-positive subsets, alongside the corresponding numbers of keograms.
Minor comment 4
Fig. 2: Since this is the first figure showing keograms and discussing the PsA morphologies, I suggest adding arrows in the various panels to help the reader recognise the identified signatures, and refer to these in the text when describing the figure.
Response:
We will add arrows to the Figure 2 panels to identify representative PsA structures without IM, regions with visible IM, and the discrete auroral structure that is not classified as PsA. We will refer to the arrows explicitly in the accompanying text.
Minor comment 5
l. 166: I would suggest mentioning the number of test keograms earlier in the manuscript (e.g. in Sect. 3.1) and briefly explaining how the test set was selected (in a similar way as for the training set) and how many different nights it contains.
Response:
We will describe the night-level training, validation, and test split earlier in the manuscript, including the numbers of keograms and observing nights in each subset. We will also state explicitly that the independent test set is used only for final performance evaluation.
Minor comment 6
l. 258: Was there any particular reason to select this specific night (20–21 November 2025)? Is there a way to assess to what extent it is a representative night? If possible, please briefly comment on it.
Response:
We will explain that this night was selected because auroral activity persisted throughout the night, allowing the evening-to-morning evolution to be illustrated continuously, and because it was not used for model training. We will clarify that the event is intended as an illustration of the morphologies underlying the statistical tendencies, rather than as a statistically representative night.
Minor comment 7
l. 387: On microbursts, Kang et al. (2022) studied scale size and effects of oblique propagation of chorus waves in the inner magnetosphere; their results might prove worth briefly discussing in this paragraph.
Response:
We will examine Kang et al. (2022) and consider whether its results on chorus-wave scale size and oblique propagation can be briefly discussed in relation to the present optical observations.
Minor comment 8
l. 397: Could the claims based on Fig. 8B, regarding the morphology of the IM in the midnight and morning sectors, be substantiated with some numbers? For instance, you could make an argument based on the test data set that you have inspected thoroughly and which is of a reasonable size to make rough statistics, which would presumably not require an extensive amount of additional work.
Response:
Following the referee’s suggestion, we will visually inspect the test dataset to make a rough quantitative comparison of IM morphology between the midnight and morning sectors, and briefly add the result to the Discussion.
Minor comment 9
Discussion: I wonder whether from your analysis you could identify any seasonal trend for IM occurrence; is this something you have considered looking into? It could be worth briefly discussing it if there is anything worth noting on that respect.
Response:
We will examine the monthly IM fraction using the same classification and uncertainty scheme as in the main analysis and show the result to the referee.
Minor comment 10
Discussion: It could be worth discussing whether IM may be preferably associated with patchy pulsating aurora (PPA) or amorphous pulsating aurora (APA), if this is an aspect that you could investigate without too many difficulties. Your results could then be discussed in relation to PPA/APA studies (e.g. Grono & Donovan, 2020; Tesema et al., 2020).
Response:
We will consider whether the present dataset allows a meaningful assessment of the association between IM and PPA/APA, taking into account the limitations of the one-dimensional keograms.
Citation: https://doi.org/10.5194/egusphere-2026-2506-AC2
-
AC2: 'Reply on RC2', Sota Nanjo, 10 Aug 2026
Peer review completion
Journal article(s) based on this preprint
Viewed
| HTML | XML | Total | BibTeX | EndNote | |
|---|---|---|---|---|---|
| 161 | 65 | 17 | 243 | 15 | 12 |
- HTML: 161
- PDF: 65
- XML: 17
- Total: 243
- BibTeX: 15
- EndNote: 12
Viewed (geographical distribution)
| Country | # | Views | % |
|---|
| Total: | 0 |
| HTML: | 0 |
| PDF: | 0 |
| XML: | 0 |
- 1

Tomoe Taki
Keisuke Hosokawa
Urban Brändström
Yoshizumi Miyoshi
Magnar G. Johnsen
The requested preprint has a corresponding peer-reviewed final revised paper. You are encouraged to refer to the final revised version.
- Preprint
(12617 KB) - Metadata XML
General comments
This manuscript details the identification and statistical analysis of internal modulations embedded within pulsating aurora at a few Hz frequency across MLT and two different latitudes. The results show a preference for internal modulations in the morning sector and at the lower latitude station (65 degrees MLAT vs 67 degrees MLAT). The overall conclusion of the paper has the potential to be very impactful for the community, especially those studying M-I coupling and energy transfer, microbursts, and wave-particle interactions in the inner magnetosphere. The paper is very well-written and includes appropriate citations. The conclusions are very significant and timely. I suggest publication after the authors consider a few minor suggestions.
Specific comments