
the Creative Commons Attribution 4.0 License.
the Creative Commons Attribution 4.0 License.
 | 16 Jun 2026
Evaluating EUCLID location accuracy using lightning events near tall structures
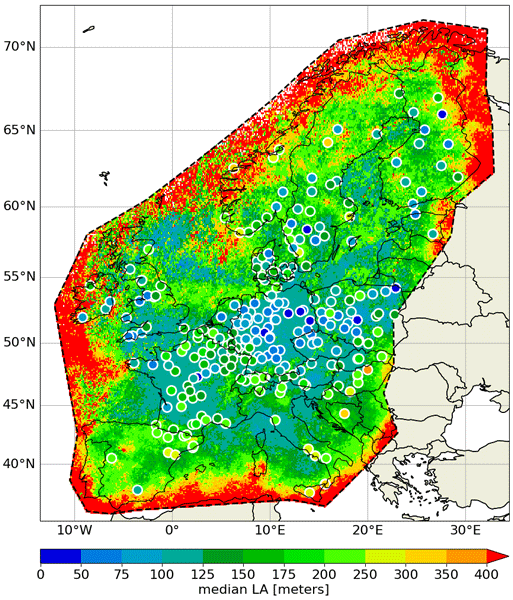
Abstract. This study evaluates the location accuracy (LA) of the European Cooperation for Lightning Detection (EUCLID) network by analysing lightning strikes recorded near tall structures located either on flat ground or on elevated terrain, such as mountain ridges, over a 14-year period from 2012 to 2025. Structures selected for this analysis, either exceeding 150 meters in height or situated on prominent terrain like mountain tops, serve as proxy reference points for assessing the network's performance. The methodology involves calculating the ratio of lightning strike densities within 500 m of each structure to those within the surrounding ring extending from 500 m to 2 km. Structures with ratios below a defined threshold are excluded from further analysis, as the absence of elevated lightning density near the structure suggests it does not significantly attract or initiate lightning and is therefore unsuitable for our methodology. Subsequently, a density-based clustering algorithm is used to identify the most likely cluster of lightning events associated with the structure. It is then assumed that the lightning events within this cluster have struck the structure and can therefore be used in the analysis of location accuracy. Results indicate a median LA of 124 m and a 95th percentile of 258 m. These values align well with those obtained from past ground-truth campaigns using high-speed video cameras and instrumented towers. Moreover, the spatial distribution of LA derived from this methodology shows a similar pattern to that of the median value of the 50 % error ellipse semi-major axis reported by the network. In addition, a focused analysis of two well-known instrumented towers, i.e., Gaisberg and Säntis, confirms that the results in terms of LA from this methodology correspond well with findings previously reported in the literature. More generally, an overall decreasing trend in median LA over time is observed across all towers, which is consistent with expectations given the continuous evolution and improvement of the detection network. This analysis underscores the importance of consistent sensor upgrades and optimized placements to achieve high detection efficiency and location accuracy.
-
Notice on discussion status
The requested preprint has a corresponding peer-reviewed final revised paper. You are encouraged to refer to the final revised version.
-
Preprint
(1908 KB)
-
The requested preprint has a corresponding peer-reviewed final revised paper. You are encouraged to refer to the final revised version.
- Preprint
(1908 KB) - Metadata XML
- BibTeX
- EndNote
- Final revised paper


Journal article(s) based on this preprint
Interactive discussion
Status: closed
-
CC1: 'Comment on egusphere-2026-2100', Hugh Hunt, 30 Jun 2026
-
AC1: 'Reply on CC1', Dieter Poelman, 23 Jul 2026
We thank you for these helpful comments.
- The "events" used refer to individual reports, i.e., CG strokes and IC pulses, as stated at the end of Sect. 2.1. We agree this can be made more explicit in Sect. 2.2.2 and will revise the text accordingly.
- Once the most probable cluster, i.e., the cluster of events identified by DBSCAN as most likely associated with the tower, has been determined, the location accuracy (LA) is calculated for each individual event within that cluster as its distance to the tower location. The reported median LA is the median of these individual per-event distances. We will state this explicitly in the revised Sect. 2.2.2.
- No timing information is used in the clustering procedure. DBSCAN is applied purely to the spatial coordinates of the individual events.
Citation: https://doi.org/10.5194/egusphere-2026-2100-AC1 -
CC2: 'Reply on AC1', Hugh Hunt, 31 Jul 2026
One other comment of interest on the approach - a similar study on the NLDN was published in 2020 (https://agupubs.onlinelibrary.wiley.com/doi/10.1029/2020JD032530) - how does the clustering approach they use compare with your DBSCAN approach?
Citation: https://doi.org/10.5194/egusphere-2026-2100-CC2 -
AC3: 'Reply on CC2', Dieter Poelman, 06 Aug 2026
The comment was uploaded in the form of a supplement: https://egusphere.copernicus.org/preprints/2026/egusphere-2026-2100/egusphere-2026-2100-AC3-supplement.pdf
-
AC3: 'Reply on CC2', Dieter Poelman, 06 Aug 2026
-
AC1: 'Reply on CC1', Dieter Poelman, 23 Jul 2026
-
RC1: 'Comment on egusphere-2026-2100', Martin Murphy, 23 Jul 2026
line 163: “statistically robust”: I would interpret that to mean “can you randomly subset the towers and end up with the same general result?” Based on the spatial distribution in figure 6, it looks like the answer is “yes”. At the point of discussion of figure 6, it might be worth making an explicit comment in reference to those words from line 163
line 190: the question of an adaptive value of eps is a good one, but you could even further support the choice of 0.1 km by referring to figure 5a, where the ground-truth data from the 25-year history of Gaisberg tower validation and the DBSCAN analysis agree very nicely. That also adds more support to the question of "statistically robust".
line 193/ figure 3: are the cluster sizes based on the entire period 2012-2025? I assume so, but it would probably be worth mentioning explicitly.
figure 7 / lines 276-294: I think that the "count" on the vertical axis of figure 7 is the number of structures, not the number of lightning events, but this probably should be made clear. Following from the discussion about the near-zero median and the definition of the 50% ellipse, the fact that the median offset is only -10 m says that almost exactly 50% of the towers have a larger median SMA than the DBSCAN results and 50% have smaller median SMA. That further supports the usefulness of the ellipse as a location accuracy metric where/when direct validation is not available. A potential "future work" analysis based on this paper, if one really wanted to dig deep into verifying the representativeness of the error ellipses, could be to look at the individual events that are included in the DBSCAN clusters at a few of the towers, comparing their ellipses to their position offsets from the tower.
Citation: https://doi.org/10.5194/egusphere-2026-2100-RC1 -
AC2: 'Reply on RC1', Dieter Poelman, 27 Jul 2026
The comment was uploaded in the form of a supplement: https://egusphere.copernicus.org/preprints/2026/egusphere-2026-2100/egusphere-2026-2100-AC2-supplement.pdf
-
AC2: 'Reply on RC1', Dieter Poelman, 27 Jul 2026
-
RC2: 'Comment on egusphere-2026-2100', Anonymous Referee #2, 31 Aug 2026
It appears there are references missing in lines 75 through 79, or at least a note to reference the following paragraph where the references exist.
Is there logic as to why the threshold for structure height was 150 m?
Regarding the sentence in line 195, how many clusters are there total? Are event clusters comprised of strokes?
Some acronym definitions are repeated, please check for first appearance of acronyms appropriately.
Is the EUCLID data filtered to only be reported CG strokes? Or are IC discharges included? What method is used to exclude ICs if ICs are excluded?
For structures located on the edge of the sensor network, should there be a separate consideration due to the worse DE as represented by the larger median location accuracy in Figure 6? Additionally, it is odd that the latter years exhibit a worse median location accuracy for some structure locations (between 450m and 500m). Are these outliers towers that are on the edge of the network?
A few case studies using known structures, such as from video camera observations of lightning or documented structure information, may provide further validation to the method.
Citation: https://doi.org/10.5194/egusphere-2026-2100-RC2 -
AC4: 'Reply on RC2', Dieter Poelman, 02 Sep 2026
The comment was uploaded in the form of a supplement: https://egusphere.copernicus.org/preprints/2026/egusphere-2026-2100/egusphere-2026-2100-AC4-supplement.pdf
-
AC4: 'Reply on RC2', Dieter Poelman, 02 Sep 2026
Peer review completion


Interactive discussion
Status: closed
-
CC1: 'Comment on egusphere-2026-2100', Hugh Hunt, 30 Jun 2026
In section 2.2.2, the clustering algorithm and its sensitivity and advantages and disadvantages are well explained but the are a couple of clarifications that would assist greatly:
Firstly, the text refers to 'clustering events' - by events, are the authors are referring to individual stroke reports? It would be good to state this explicitly.Secondly, once a cluster (of strokes?) has been identified, are the individual location error from the relevant tower of each one of these strokes then calculated? Again, this seems to be the case but it would be good to state explicitly.
Also, it appears no timing information is being applied here ie. you are not trying to identify how many. specific "flashes" attached to the towers or any type of stroke order, just a cluster of strokes - is that correct?Citation: https://doi.org/10.5194/egusphere-2026-2100-CC1 -
AC1: 'Reply on CC1', Dieter Poelman, 23 Jul 2026
We thank you for these helpful comments.
- The "events" used refer to individual reports, i.e., CG strokes and IC pulses, as stated at the end of Sect. 2.1. We agree this can be made more explicit in Sect. 2.2.2 and will revise the text accordingly.
- Once the most probable cluster, i.e., the cluster of events identified by DBSCAN as most likely associated with the tower, has been determined, the location accuracy (LA) is calculated for each individual event within that cluster as its distance to the tower location. The reported median LA is the median of these individual per-event distances. We will state this explicitly in the revised Sect. 2.2.2.
- No timing information is used in the clustering procedure. DBSCAN is applied purely to the spatial coordinates of the individual events.
Citation: https://doi.org/10.5194/egusphere-2026-2100-AC1 -
CC2: 'Reply on AC1', Hugh Hunt, 31 Jul 2026
One other comment of interest on the approach - a similar study on the NLDN was published in 2020 (https://agupubs.onlinelibrary.wiley.com/doi/10.1029/2020JD032530) - how does the clustering approach they use compare with your DBSCAN approach?
Citation: https://doi.org/10.5194/egusphere-2026-2100-CC2 -
AC3: 'Reply on CC2', Dieter Poelman, 06 Aug 2026
The comment was uploaded in the form of a supplement: https://egusphere.copernicus.org/preprints/2026/egusphere-2026-2100/egusphere-2026-2100-AC3-supplement.pdf
-
AC3: 'Reply on CC2', Dieter Poelman, 06 Aug 2026
-
AC1: 'Reply on CC1', Dieter Poelman, 23 Jul 2026
-
RC1: 'Comment on egusphere-2026-2100', Martin Murphy, 23 Jul 2026
line 163: “statistically robust”: I would interpret that to mean “can you randomly subset the towers and end up with the same general result?” Based on the spatial distribution in figure 6, it looks like the answer is “yes”. At the point of discussion of figure 6, it might be worth making an explicit comment in reference to those words from line 163
line 190: the question of an adaptive value of eps is a good one, but you could even further support the choice of 0.1 km by referring to figure 5a, where the ground-truth data from the 25-year history of Gaisberg tower validation and the DBSCAN analysis agree very nicely. That also adds more support to the question of "statistically robust".
line 193/ figure 3: are the cluster sizes based on the entire period 2012-2025? I assume so, but it would probably be worth mentioning explicitly.
figure 7 / lines 276-294: I think that the "count" on the vertical axis of figure 7 is the number of structures, not the number of lightning events, but this probably should be made clear. Following from the discussion about the near-zero median and the definition of the 50% ellipse, the fact that the median offset is only -10 m says that almost exactly 50% of the towers have a larger median SMA than the DBSCAN results and 50% have smaller median SMA. That further supports the usefulness of the ellipse as a location accuracy metric where/when direct validation is not available. A potential "future work" analysis based on this paper, if one really wanted to dig deep into verifying the representativeness of the error ellipses, could be to look at the individual events that are included in the DBSCAN clusters at a few of the towers, comparing their ellipses to their position offsets from the tower.
Citation: https://doi.org/10.5194/egusphere-2026-2100-RC1 -
AC2: 'Reply on RC1', Dieter Poelman, 27 Jul 2026
The comment was uploaded in the form of a supplement: https://egusphere.copernicus.org/preprints/2026/egusphere-2026-2100/egusphere-2026-2100-AC2-supplement.pdf
-
AC2: 'Reply on RC1', Dieter Poelman, 27 Jul 2026
-
RC2: 'Comment on egusphere-2026-2100', Anonymous Referee #2, 31 Aug 2026
It appears there are references missing in lines 75 through 79, or at least a note to reference the following paragraph where the references exist.
Is there logic as to why the threshold for structure height was 150 m?
Regarding the sentence in line 195, how many clusters are there total? Are event clusters comprised of strokes?
Some acronym definitions are repeated, please check for first appearance of acronyms appropriately.
Is the EUCLID data filtered to only be reported CG strokes? Or are IC discharges included? What method is used to exclude ICs if ICs are excluded?
For structures located on the edge of the sensor network, should there be a separate consideration due to the worse DE as represented by the larger median location accuracy in Figure 6? Additionally, it is odd that the latter years exhibit a worse median location accuracy for some structure locations (between 450m and 500m). Are these outliers towers that are on the edge of the network?
A few case studies using known structures, such as from video camera observations of lightning or documented structure information, may provide further validation to the method.
Citation: https://doi.org/10.5194/egusphere-2026-2100-RC2 -
AC4: 'Reply on RC2', Dieter Poelman, 02 Sep 2026
The comment was uploaded in the form of a supplement: https://egusphere.copernicus.org/preprints/2026/egusphere-2026-2100/egusphere-2026-2100-AC4-supplement.pdf
-
AC4: 'Reply on RC2', Dieter Poelman, 02 Sep 2026
Peer review completion
Journal article(s) based on this preprint
Viewed
| HTML | XML | Total | BibTeX | EndNote | |
|---|---|---|---|---|---|
| 202 | 92 | 29 | 323 | 13 | 15 |
- HTML: 202
- PDF: 92
- XML: 29
- Total: 323
- BibTeX: 13
- EndNote: 15
Viewed (geographical distribution)
| Country | # | Views | % |
|---|
| Total: | 0 |
| HTML: | 0 |
| PDF: | 0 |
| XML: | 0 |
- 1
Dieter Roel Poelman

Hannes Kohlmann
Wolfgang Schulz
The requested preprint has a corresponding peer-reviewed final revised paper. You are encouraged to refer to the final revised version.
- Preprint
(1908 KB) - Metadata XML
In section 2.2.2, the clustering algorithm and its sensitivity and advantages and disadvantages are well explained but the are a couple of clarifications that would assist greatly:
Firstly, the text refers to 'clustering events' - by events, are the authors are referring to individual stroke reports? It would be good to state this explicitly.
Secondly, once a cluster (of strokes?) has been identified, are the individual location error from the relevant tower of each one of these strokes then calculated? Again, this seems to be the case but it would be good to state explicitly.
Also, it appears no timing information is being applied here ie. you are not trying to identify how many. specific "flashes" attached to the towers or any type of stroke order, just a cluster of strokes - is that correct?