
the Creative Commons Attribution 4.0 License.
the Creative Commons Attribution 4.0 License.
 | 16 Apr 2026
Ultraviolet observations of the Earth and Moon during the JUICE Lunar-Earth flyby
Abstract. During the JUICE Lunar-Earth Gravity Assist (LEGA) period in August 2024, the JUICE ultraviolet imaging spectrograph (JUICE-UVS) performed a series of observations of the Earth and Moon, detecting reflected sunlight at the Moon and emissions of atmospheric species including hydrogen, oxygen, and nitrogen at the Earth. These observations provided the first opportunity for in-flight calibration of the instrument response to extended planetary targets. They were used to refine the wavelength calibration across the full instrument bandpass, confirm accurate knowledge of the pointing of the UVS field-of-view relative to the spacecraft, and validate previous measurements of the UV effective area determined from observations of UV-bright stars. The observations performed also demonstrate the range of scientific analyses to be performed during the science phase of the mission and are useful for the development and testing of relevant mapping tools and procedures. The JUICE-UVS LEGA data confirm that the instrument is in good health and well suited to its goals of characterizing the surfaces and atmospheres of Jupiter’s icy moons, mapping and monitoring Jupiter’s aurora and upper atmosphere, and studying the Jupiter-Io connection.
-
Notice on discussion status
The requested preprint has a corresponding peer-reviewed final revised paper. You are encouraged to refer to the final revised version.
-
Preprint
(9895 KB)
-
The requested preprint has a corresponding peer-reviewed final revised paper. You are encouraged to refer to the final revised version.
- Preprint
(9895 KB) - Metadata XML
- BibTeX
- EndNote
- Final revised paper


Journal article(s) based on this preprint
Interactive discussion
Status: closed
-
RC1: 'Comment on egusphere-2026-2038', Anonymous Referee #1, 26 May 2026
-
AC1: 'Reply on RC1', Philippa Molyneux, 14 Jul 2026
We thank the reviewer for taking the time to carefully read the paper and for their constructive comments. Please see our responses below.
Lines 22-27: What is meant by “first ever”? Is this the first time JUICE flew by the Earth and Moon, or the first time any spacecraft has flown by both objects?
It was the first time any spacecraft performed a double flyby like this. We’ll clarify this.
Figure 1: Is it possible to include a higher resolution version of this image?
Yes, we will replace the photograph of the full instrument with a higher resolution version when we submit the revised manuscript. The slit image is more difficult because we don’t have a better version of the original photograph it was cropped from.
Line 81: Please define UVS NECP
NECP was the Near-Earth Commissioning Phase when we first switched on and checked the basic instrument functions a few months after launch. It’s defined on line 38 and we’ll add a reminder near line 81.
Lines 82-83: Please include a brief justification explaining why the active area of the detector is a small fraction of the available space
This is because a microchannel plate detector doesn’t have physical pixels but instead uses a cross-delay line (XDL) anode to map the position of events on the detector. Each incident photon generates a charge cloud that moves through the two orthogonal delay lines, and the difference in arrival time at each end of the two lines allows the x and y position of the photon to be deduced. The JUICE-UVS detector electronics use 12-bit encoding for both x and y position, leading to a 4096 x 4096 image size. The size of the active area is limited by the physical size of the detector and the time resolution of the electronics to a small fraction of this, but the extra space is useful for multiple reasons. First, it lets us include additional stimulated signals outside of the active area (the stim pixels in Figure 2) to monitor the instrument health and any drift in the position of the active area with temperature. Additionally, at high count rates the detector is unable to process every event fast enough and we start to see signal incorrectly mapped to regions outside of the active area. In this case, the extra pixels are useful for monitoring the fraction of dropped counts, allowing better calibration of the data.
We’ll expand the description of Figure 2 to explain this.
Figure 2: There is brightening that is visible at the edges of the detector spectral area. This is most evident at the rightmost edge of the AP histogram. Is this a detector effect?
Yes, this pileup edge effect is typical of MCP detectors and results from field interactions with the MCP mounting clamps (e.g., Davis et al. 2011: https://doi.org/10.1117/12.894274; Siegmund et al. 2013: 10.1109/TNS.2013.2252364). We’ll note this in the figure caption.
Lines 98-99: Helium is given in nm, but the figures are all given in spectral bins/pixels. Please include a pixel that corresponds to 58.4, similar to what is done with H I Lyman alpha in the previous line.
Thanks for this suggestion. We’ll add the pixel value for 58.4 nm on this line (pixel 871).
Line 202: Please explain what is meant by “extensive and intense”.
We meant that there are more dayglow than nightglow lines, and the dayglow emissions are brighter and cover an extended spectral range rather than being concentrated in the 121.6 – 135.6 nm region containing hydrogen Lyman alpha and the two oxygen emissions, which are the only UV lines present at detectable levels on the night side. The dayglow and nightglow emissions are also excited via different processes, leading to large differences in intensity: for example, the nightside UV oxygen emissions result from radiative recombination of O+ ions and electrons, while on the dayside they are produced by resonant scattering of sunlight and photoelectron impact excitation (e.g., Meier 1991: https://doi.org/10.1007/BF01206000).
We’ll edit the start of this paragraph to make that clearer.
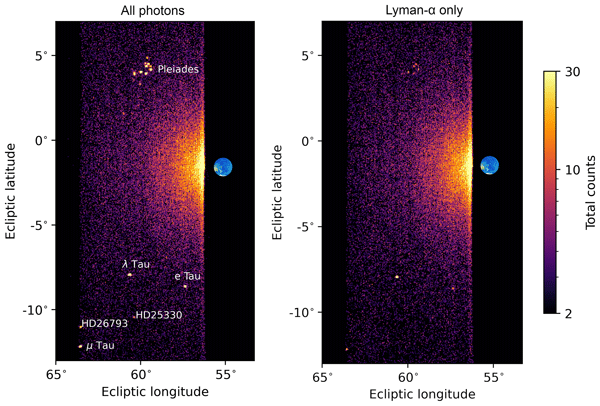
Figure 11: Interestingly, HD26793 and HD25330 are not visible in the Lyman alpha panel at all!
Yes! It’s a combination of the magnitude and spectral type of each star that determines whether we can detect it at Lyman alpha. We haven’t looked at all the stars in enough detail to say which of these factors is most important for each one, but HD26793 is the coolest of the stars in the bottom half of the image (spectral type B9), so its spectrum will be shifted to longer wavelengths, which probably explains why that one wasn’t visible at Lyman alpha despite being relatively bright in the summed image.
Line 418: A placeholder DOI is included – please ensure the data is published at the time of publication
We’re working on this with the JUICE archiving team. We now have a doi for the PSA delivery that we will add to the revised manuscript.
Citation: https://doi.org/10.5194/egusphere-2026-2038-AC1
-
AC1: 'Reply on RC1', Philippa Molyneux, 14 Jul 2026
-
RC2: 'Comment on egusphere-2026-2038', Anonymous Referee #2, 18 Jun 2026
Referee comments on Ann. Geo. paper:"Ultraviolet observations of the Earth and Moon during the JUICE Lunar-Earth flyby"
by Philippa Molyneux et al.
Overall this is a very good paper worthy of publication in Ann. Geo. This paper reports the capabilities and scientific data from the JUICE-UVS instrument in its fly-bys of the Moon and the Earth (LEGA), and as such is appropriate for publication in Ann. Geo. A few comments are given below but the paper is in good shape as is.
- The description of the instrument and the observations is clear and well written. No comments on this part.
- Thanks to the authors for including brightness values for the emission lines from the Earth. However, the comparison values from Meier 1991 are out of date, since they are not for a similar level of solar activity and based on early uncertain measurements with large uncertainties. The Meier 1304 daytime values are known to be unrealistically high. More recent observations by missions such as TWINS, PROCYON/LAICA, and GUVI would give more appropriate comparisons. In addition, for reference recent observations of the H Lyman-alpha emission from the Earth's dayside have shown brightnesses of 50-60 kR, compared with an apparent measurement of ~ 20 kR in this paper (Fig. 10). The recent data are roughly consistent with brightness values near solar max. reported from the STP-78 mission (Chakrabarti et al., JGR, 88, 4898-4904 (1983)). They found a total (looking up + looking down from 600 km) of 12-13 kR for OI 1304 A and 57 kR for H 1216 A during a period of high solar activity. These total columns correspond to what a distant mission would observe looking down into the sunlit atmosphere. I do recommend that Figure 10 at least be changed to compare with some other measurement than Meier 1991, and that the authors consider comparing to a different data set for both Lyman-alpha and OI 1304 brightnesses.
- The observations of the Moon are a different case, since the lunar albedo is fairly well measured but there is a phase effect that has to be taken into account (the brightness increases sharply close to a line of sight normal to the surface - the "opposition surge"). I am not familiar with the Lommel-Seeliger function but this must be intended to take into account the known phase effect. It appears that the reported observations where at a sufficient angle that this effect might not apply. The comparison with LAMP spectra gives confidence in the absolute calibration of the instrument, or at least consistency with another instrument.
- The description of planned observations at Jupiter is interesting and clearly worded.
Citation: https://doi.org/10.5194/egusphere-2026-2038-RC2 -
AC2: 'Reply on RC2', Philippa Molyneux, 14 Jul 2026
We would like to thank the reviewer for their helpful feedback. Please see our responses below.
- The description of the instrument and the observations is clear and well written. No comments on this part.
Thanks!
- Thanks to the authors for including brightness values for the emission lines from the Earth. However, the comparison values from Meier 1991 are out of date, since they are not for a similar level of solar activity and based on early uncertain measurements with large uncertainties. The Meier 1304 daytime values are known to be unrealistically high. More recent observations by missions such as TWINS, PROCYON/LAICA, and GUVI would give more appropriate comparisons. In addition, for reference recent observations of the H Lyman-alpha emission from the Earth's dayside have shown brightnesses of 50-60 kR, compared with an apparent measurement of ~ 20 kR in this paper (Fig. 10). The recent data are roughly consistent with brightness values near solar max. reported from the STP-78 mission (Chakrabarti et al., JGR, 88, 4898-4904 (1983)). They found a total (looking up + looking down from 600 km) of 12-13 kR for OI 1304 A and 57 kR for H 1216 A during a period of high solar activity. These total columns correspond to what a distant mission would observe looking down into the sunlit atmosphere. I do recommend that Figure 10 at least be changed to compare with some other measurement than Meier 1991, and that the authors consider comparing to a different data set for both Lyman-alpha and OI 1304 brightnesses.
We are happy to include additional references. The Meier values were intended to demonstrate a broad, order-of-magnitude agreement with expectations, and that paper remains the best available compilation of UV airglow processes and emission intensities. We can’t directly compare our results to TWINS or PROCYON/LAICA, because published studies using those missions exclude the region near the Earth and we weren’t able to find anything within ~3 RE. It’s also surprisingly difficult to find papers from any recent mission about UV dayglow rather than aurora or nightglow emissions. However, Fig. 4 in Paxton et al. 2017 (https://doi.org/10.1002/2016JA023578) shows GUVI measurements of dayglow 130.4 nm and Lyman alpha emissions peaking in the low 10s of kR, consistent with our observations.
We checked the GUVI level 1B summary products (https://guvitimed.jhuapl.edu/index.php/guvi-galleryl1bspec_V013) for the day of the JUICE Earth flyby, and their dayside intensities agree very well with ours, with both Lyman alpha and 130.4 nm peaking around 20 kR (we will attach the GUVI screenshot as a pdf supplement to this comment for reference). Note that although there was a difference in altitude between TIMED/GUVI and JUICE (625 km for TIMED vs. ~7000 km for JUICE), we expect to measure similar intensities in the nadir direction because the emissions are optically thick, limiting the line-of-sight through the emitting region. We’ll add this comparison with GUVI to the paper.
- The observations of the Moon are a different case, since the lunar albedo is fairly well measured but there is a phase effect that has to be taken into account (the brightness increases sharply close to a line of sight normal to the surface - the "opposition surge"). I am not familiar with the Lommel-Seeliger function but this must be intended to take into account the known phase effect. It appears that the reported observations where at a sufficient angle that this effect might not apply. The comparison with LAMP spectra gives confidence in the absolute calibration of the instrument, or at least consistency with another instrument.
Yes, the Lommel-Seeliger function corrects for phase angle effects and you’re correct to say that we were not observing at small enough phase angles to see the opposition effect.
- The description of planned observations at Jupiter is interesting and clearly worded.
Thank you!
-
AC2: 'Reply on RC2', Philippa Molyneux, 14 Jul 2026
Peer review completion


Interactive discussion
Status: closed
-
RC1: 'Comment on egusphere-2026-2038', Anonymous Referee #1, 26 May 2026
Review of "Ultraviolet observations of the Earth and Moon during the JUICE Lunar-Earth flyby"
This article presents JUICE LEGA observations of the Moon and Earth and characterizes the calibration and instrument response. The manuscript is well written, clear, and complete. The figures adequately support the text, and the conclusions appropriately summarize the work. With minor revisions outlined below, this paper deserves publication in this journal.
Lines 22-27: What is meant by “first ever”? Is this the first time JUICE flew by the Earth and Moon, or the first time any spacecraft has flown by both objects?
Figure 1: Is it possible to include a higher resolution version of this image?
Line 81: Please define UVS NECPLines 82-83: Please include a brief justification explaining why the active area of the detector is a small fraction of the available space
Figure 2: There is brightening that is visible at the edges of the detector spectral area. This is most evident at the rightmost edge of the AP histogram. Is this a detector effect?
Lines 98-99: Helium is given in nm, but the figures are all given in spectral bins/pixels. Please include a pixel that corresponds to 58.4, similar to what is done with H I Lyman alpha in the previous line.
Line 202: Please explain what is meant by “extensive and intense”.
Figure 11: Interestingly, HD26793 and HD25330 are not visible in the Lyman alpha panel at all!
Line 418: A placeholder DOI is included – please ensure the data is published at the time of publication
Citation: https://doi.org/10.5194/egusphere-2026-2038-RC1 -
AC1: 'Reply on RC1', Philippa Molyneux, 14 Jul 2026
We thank the reviewer for taking the time to carefully read the paper and for their constructive comments. Please see our responses below.
Lines 22-27: What is meant by “first ever”? Is this the first time JUICE flew by the Earth and Moon, or the first time any spacecraft has flown by both objects?
It was the first time any spacecraft performed a double flyby like this. We’ll clarify this.
Figure 1: Is it possible to include a higher resolution version of this image?
Yes, we will replace the photograph of the full instrument with a higher resolution version when we submit the revised manuscript. The slit image is more difficult because we don’t have a better version of the original photograph it was cropped from.
Line 81: Please define UVS NECP
NECP was the Near-Earth Commissioning Phase when we first switched on and checked the basic instrument functions a few months after launch. It’s defined on line 38 and we’ll add a reminder near line 81.
Lines 82-83: Please include a brief justification explaining why the active area of the detector is a small fraction of the available space
This is because a microchannel plate detector doesn’t have physical pixels but instead uses a cross-delay line (XDL) anode to map the position of events on the detector. Each incident photon generates a charge cloud that moves through the two orthogonal delay lines, and the difference in arrival time at each end of the two lines allows the x and y position of the photon to be deduced. The JUICE-UVS detector electronics use 12-bit encoding for both x and y position, leading to a 4096 x 4096 image size. The size of the active area is limited by the physical size of the detector and the time resolution of the electronics to a small fraction of this, but the extra space is useful for multiple reasons. First, it lets us include additional stimulated signals outside of the active area (the stim pixels in Figure 2) to monitor the instrument health and any drift in the position of the active area with temperature. Additionally, at high count rates the detector is unable to process every event fast enough and we start to see signal incorrectly mapped to regions outside of the active area. In this case, the extra pixels are useful for monitoring the fraction of dropped counts, allowing better calibration of the data.
We’ll expand the description of Figure 2 to explain this.
Figure 2: There is brightening that is visible at the edges of the detector spectral area. This is most evident at the rightmost edge of the AP histogram. Is this a detector effect?
Yes, this pileup edge effect is typical of MCP detectors and results from field interactions with the MCP mounting clamps (e.g., Davis et al. 2011: https://doi.org/10.1117/12.894274; Siegmund et al. 2013: 10.1109/TNS.2013.2252364). We’ll note this in the figure caption.
Lines 98-99: Helium is given in nm, but the figures are all given in spectral bins/pixels. Please include a pixel that corresponds to 58.4, similar to what is done with H I Lyman alpha in the previous line.
Thanks for this suggestion. We’ll add the pixel value for 58.4 nm on this line (pixel 871).
Line 202: Please explain what is meant by “extensive and intense”.
We meant that there are more dayglow than nightglow lines, and the dayglow emissions are brighter and cover an extended spectral range rather than being concentrated in the 121.6 – 135.6 nm region containing hydrogen Lyman alpha and the two oxygen emissions, which are the only UV lines present at detectable levels on the night side. The dayglow and nightglow emissions are also excited via different processes, leading to large differences in intensity: for example, the nightside UV oxygen emissions result from radiative recombination of O+ ions and electrons, while on the dayside they are produced by resonant scattering of sunlight and photoelectron impact excitation (e.g., Meier 1991: https://doi.org/10.1007/BF01206000).
We’ll edit the start of this paragraph to make that clearer.
Figure 11: Interestingly, HD26793 and HD25330 are not visible in the Lyman alpha panel at all!
Yes! It’s a combination of the magnitude and spectral type of each star that determines whether we can detect it at Lyman alpha. We haven’t looked at all the stars in enough detail to say which of these factors is most important for each one, but HD26793 is the coolest of the stars in the bottom half of the image (spectral type B9), so its spectrum will be shifted to longer wavelengths, which probably explains why that one wasn’t visible at Lyman alpha despite being relatively bright in the summed image.
Line 418: A placeholder DOI is included – please ensure the data is published at the time of publication
We’re working on this with the JUICE archiving team. We now have a doi for the PSA delivery that we will add to the revised manuscript.
Citation: https://doi.org/10.5194/egusphere-2026-2038-AC1
-
AC1: 'Reply on RC1', Philippa Molyneux, 14 Jul 2026
-
RC2: 'Comment on egusphere-2026-2038', Anonymous Referee #2, 18 Jun 2026
Referee comments on Ann. Geo. paper:"Ultraviolet observations of the Earth and Moon during the JUICE Lunar-Earth flyby"
by Philippa Molyneux et al.
Overall this is a very good paper worthy of publication in Ann. Geo. This paper reports the capabilities and scientific data from the JUICE-UVS instrument in its fly-bys of the Moon and the Earth (LEGA), and as such is appropriate for publication in Ann. Geo. A few comments are given below but the paper is in good shape as is.
- The description of the instrument and the observations is clear and well written. No comments on this part.
- Thanks to the authors for including brightness values for the emission lines from the Earth. However, the comparison values from Meier 1991 are out of date, since they are not for a similar level of solar activity and based on early uncertain measurements with large uncertainties. The Meier 1304 daytime values are known to be unrealistically high. More recent observations by missions such as TWINS, PROCYON/LAICA, and GUVI would give more appropriate comparisons. In addition, for reference recent observations of the H Lyman-alpha emission from the Earth's dayside have shown brightnesses of 50-60 kR, compared with an apparent measurement of ~ 20 kR in this paper (Fig. 10). The recent data are roughly consistent with brightness values near solar max. reported from the STP-78 mission (Chakrabarti et al., JGR, 88, 4898-4904 (1983)). They found a total (looking up + looking down from 600 km) of 12-13 kR for OI 1304 A and 57 kR for H 1216 A during a period of high solar activity. These total columns correspond to what a distant mission would observe looking down into the sunlit atmosphere. I do recommend that Figure 10 at least be changed to compare with some other measurement than Meier 1991, and that the authors consider comparing to a different data set for both Lyman-alpha and OI 1304 brightnesses.
- The observations of the Moon are a different case, since the lunar albedo is fairly well measured but there is a phase effect that has to be taken into account (the brightness increases sharply close to a line of sight normal to the surface - the "opposition surge"). I am not familiar with the Lommel-Seeliger function but this must be intended to take into account the known phase effect. It appears that the reported observations where at a sufficient angle that this effect might not apply. The comparison with LAMP spectra gives confidence in the absolute calibration of the instrument, or at least consistency with another instrument.
- The description of planned observations at Jupiter is interesting and clearly worded.
Citation: https://doi.org/10.5194/egusphere-2026-2038-RC2 -
AC2: 'Reply on RC2', Philippa Molyneux, 14 Jul 2026
We would like to thank the reviewer for their helpful feedback. Please see our responses below.
- The description of the instrument and the observations is clear and well written. No comments on this part.
Thanks!
- Thanks to the authors for including brightness values for the emission lines from the Earth. However, the comparison values from Meier 1991 are out of date, since they are not for a similar level of solar activity and based on early uncertain measurements with large uncertainties. The Meier 1304 daytime values are known to be unrealistically high. More recent observations by missions such as TWINS, PROCYON/LAICA, and GUVI would give more appropriate comparisons. In addition, for reference recent observations of the H Lyman-alpha emission from the Earth's dayside have shown brightnesses of 50-60 kR, compared with an apparent measurement of ~ 20 kR in this paper (Fig. 10). The recent data are roughly consistent with brightness values near solar max. reported from the STP-78 mission (Chakrabarti et al., JGR, 88, 4898-4904 (1983)). They found a total (looking up + looking down from 600 km) of 12-13 kR for OI 1304 A and 57 kR for H 1216 A during a period of high solar activity. These total columns correspond to what a distant mission would observe looking down into the sunlit atmosphere. I do recommend that Figure 10 at least be changed to compare with some other measurement than Meier 1991, and that the authors consider comparing to a different data set for both Lyman-alpha and OI 1304 brightnesses.
We are happy to include additional references. The Meier values were intended to demonstrate a broad, order-of-magnitude agreement with expectations, and that paper remains the best available compilation of UV airglow processes and emission intensities. We can’t directly compare our results to TWINS or PROCYON/LAICA, because published studies using those missions exclude the region near the Earth and we weren’t able to find anything within ~3 RE. It’s also surprisingly difficult to find papers from any recent mission about UV dayglow rather than aurora or nightglow emissions. However, Fig. 4 in Paxton et al. 2017 (https://doi.org/10.1002/2016JA023578) shows GUVI measurements of dayglow 130.4 nm and Lyman alpha emissions peaking in the low 10s of kR, consistent with our observations.
We checked the GUVI level 1B summary products (https://guvitimed.jhuapl.edu/index.php/guvi-galleryl1bspec_V013) for the day of the JUICE Earth flyby, and their dayside intensities agree very well with ours, with both Lyman alpha and 130.4 nm peaking around 20 kR (we will attach the GUVI screenshot as a pdf supplement to this comment for reference). Note that although there was a difference in altitude between TIMED/GUVI and JUICE (625 km for TIMED vs. ~7000 km for JUICE), we expect to measure similar intensities in the nadir direction because the emissions are optically thick, limiting the line-of-sight through the emitting region. We’ll add this comparison with GUVI to the paper.
- The observations of the Moon are a different case, since the lunar albedo is fairly well measured but there is a phase effect that has to be taken into account (the brightness increases sharply close to a line of sight normal to the surface - the "opposition surge"). I am not familiar with the Lommel-Seeliger function but this must be intended to take into account the known phase effect. It appears that the reported observations where at a sufficient angle that this effect might not apply. The comparison with LAMP spectra gives confidence in the absolute calibration of the instrument, or at least consistency with another instrument.
Yes, the Lommel-Seeliger function corrects for phase angle effects and you’re correct to say that we were not observing at small enough phase angles to see the opposition effect.
- The description of planned observations at Jupiter is interesting and clearly worded.
Thank you!
-
AC2: 'Reply on RC2', Philippa Molyneux, 14 Jul 2026
Peer review completion
Journal article(s) based on this preprint
Viewed
| HTML | XML | Total | BibTeX | EndNote | |
|---|---|---|---|---|---|
| 319 | 290 | 41 | 650 | 34 | 33 |
- HTML: 319
- PDF: 290
- XML: 41
- Total: 650
- BibTeX: 34
- EndNote: 33
Viewed (geographical distribution)
| Country | # | Views | % |
|---|
| Total: | 0 |
| HTML: | 0 |
| PDF: | 0 |
| XML: | 0 |
- 1

Michael Davis
Rohini Giles
Thomas Greathouse
Kurt Retherford
Maarten Versteeg
Sue Ferrell
Tracy Becker
G. Randall Gladstone
Bradley Trantham
Joshua Kammer
Matthew Freeman
Steven Persyn
The requested preprint has a corresponding peer-reviewed final revised paper. You are encouraged to refer to the final revised version.
- Preprint
(9895 KB) - Metadata XML
Review of "Ultraviolet observations of the Earth and Moon during the JUICE Lunar-Earth flyby"
This article presents JUICE LEGA observations of the Moon and Earth and characterizes the calibration and instrument response. The manuscript is well written, clear, and complete. The figures adequately support the text, and the conclusions appropriately summarize the work. With minor revisions outlined below, this paper deserves publication in this journal.
Lines 22-27: What is meant by “first ever”? Is this the first time JUICE flew by the Earth and Moon, or the first time any spacecraft has flown by both objects?
Figure 1: Is it possible to include a higher resolution version of this image?
Line 81: Please define UVS NECP
Lines 82-83: Please include a brief justification explaining why the active area of the detector is a small fraction of the available space
Figure 2: There is brightening that is visible at the edges of the detector spectral area. This is most evident at the rightmost edge of the AP histogram. Is this a detector effect?
Lines 98-99: Helium is given in nm, but the figures are all given in spectral bins/pixels. Please include a pixel that corresponds to 58.4, similar to what is done with H I Lyman alpha in the previous line.
Line 202: Please explain what is meant by “extensive and intense”.
Figure 11: Interestingly, HD26793 and HD25330 are not visible in the Lyman alpha panel at all!
Line 418: A placeholder DOI is included – please ensure the data is published at the time of publication