
the Creative Commons Attribution 4.0 License.
the Creative Commons Attribution 4.0 License.
 | 16 Apr 2026
From regular to random: a unifying framework for step-pool spacing
Abstract. Steep streams frequently display a distinctive step-pool structure where water crests over a near-vertical drop and plunges into a deeper depression in a repeated pattern. Because they naturally moderate the flow of water and sediment in hazardous mountain catchments, step-pools are often installed in stream management and restoration projects. However, emulating step-pool sequences is hindered by debate on whether natural step-pools are themselves regularly or randomly spaced. Here we show that the spacing of step-pool sequences spans a continuum between regularity and randomness driven by multiple formation mechanisms. Analyzing a compilation of natural, experimental, and numerically simulated step-pools, we found that natural variability and inherent limits on minimum spacing prevent fully regular or random sequences. While certain mechanisms result in comparatively regular or random spacing, no single mechanism dominates step-pool development. Our results resolve longstanding tension between a plethora of proposed formation mechanisms that yield contrasting predictions. Furthermore, the emergent limits on spacing variability provide testable predictions about the adjustment of sequence spacing following river disturbance that may eventually be used to define concrete targets for stream restoration and hazard management.
-
Notice on discussion status
The requested preprint has a corresponding peer-reviewed final revised paper. You are encouraged to refer to the final revised version.
-
Preprint
(745 KB)
-
Supplement
(333 KB)
-
The requested preprint has a corresponding peer-reviewed final revised paper. You are encouraged to refer to the final revised version.
- Preprint
(745 KB) - Metadata XML
-
Supplement
(333 KB) - BibTeX
- EndNote
- Final revised paper


Journal article(s) based on this preprint
Interactive discussion
Status: closed
-
RC1: 'Comment on egusphere-2026-1994', James Pizzuto, 15 Jun 2026
I really enjoyed this paper, and appreciated how its approach to data analysis allows one to better understand the implications of step-pool spacing with regard to possible governing processes. As pointed out by the authors, the approach has important implications for restoration designs.
I have made a few, mostly minor, editorial comments that I believe will improve the authors’ ability to communicate their ideas, but otherwise the manuscript is pretty close to being ready for publication.
Jim Pizzuto
Professor Emeritus
University of Delaware
USA
Some detailed comments, keyed to the text:
1. Line 11. Is it possible to describe these inherent limits on minimum spacing, so the reader can understand this without going through the entire article? This would help facilitate acceptance of the authors' ideas, though it might be difficult to achieve.
2. Line 44. Is it possible to more clearly state the goal of this paper? What is a "framework"? Is it a mathematical approach to evaluating step-pool spacing that is independent of formation mechanism? Is it a hypothesis? A type of formal data analysis (i.e., a process for analyzing observations of step-pool spacing)? Something else? It would be helpful to the reader to better understand what the authors are contributing here.
3. Line 81. In the spirit of reproducibility, it might be helpful to include (likely in the supplement) a series of computational steps followed in creating the reference lines. I have some rather dim idea regarding how this is done, but if I wanted to recreate Figure 2, I would be pretty confused regarding the details. Ok, now I see this in the Appendix, so ideally the appendix can be referenced here so the reader knows where to look.
4. Line 86. I think it would be helpful to add a figure to illustrate the concept of "space between reference lines". I am not sure what this concept refers to. Is this the sequence of points within a certain scaled distance of each line, or something like this? Rather than relying on abstract terms, a graphical illustration would be much more effective in communicating the author's concept here. Or better yet (now that I have read ahead), please see comments on Figure 2.
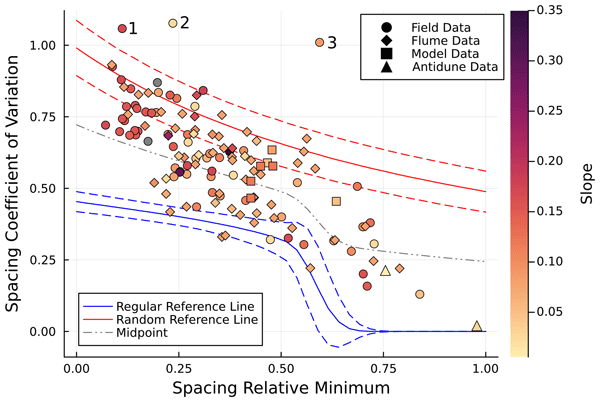
5. Figure 2. At the risk of complicating this figure, it might be helpful to label CV_N = 0 and 1 on the figure. I guess the solid blue line is CV_N = 0 and the solid red line is CV_N = 1, right?
6. Line 113. “Closer” would be a better description than "closest". This change is appropriate because only 2 options are being compared, and also because the data do not generally plot "close" to either end member, but are actually "closest" to the gray line separating the two end members in Figure 3.
7. Line 122. Can this data point be highlighted in Figure 3, so the reader doesn't have to hunt for it by scanning the long and complex legend to the right?Citation: https://doi.org/10.5194/egusphere-2026-1994-RC1 -
AC1: 'Reply on RC1', Christian Erikson, 08 Jul 2026
We thank the reviewer for providing these comments and detail the changes we made to address them below. The original comments are copied in italics with the response beneath.
Reviewer 1
1. Line 11. Is it possible to describe these inherent limits on minimum spacing, so the reader can understand this without going through the entire article? This would help facilitate acceptance of the authors' ideas, though it might be difficult to achieve.
To provide more context within the limited space in the abstract, we replaced “inherent” with “hydraulically-set”.
2. Line 44. Is it possible to more clearly state the goal of this paper? What is a "framework"? Is it a mathematical approach to evaluating step-pool spacing that is independent of formation mechanism? Is it a hypothesis? A type of formal data analysis (i.e., a process for analyzing observations of step-pool spacing)? Something else? It would be helpful to the reader to better understand what the authors are contributing here.We added clarification by now stating: “The framework consists of two statistical measures of variability, which define a simple diagram. Within this space, the relative regularity and randomness of a step sequence becomes readily discernable.”
3. Line 81. In the spirit of reproducibility, it might be helpful to include (likely in the supplement) a series of computational steps followed in creating the reference lines. I have some rather dim idea regarding how this is done, but if I wanted to recreate Figure 2, I would be pretty confused regarding the details. Ok, now I see this in the Appendix, so ideally the appendix can be referenced here so the reader knows where to look.We added the missing appropriate references to the appendix.
4. Line 86. I think it would be helpful to add a figure to illustrate the concept of "space between reference lines". I am not sure what this concept refers to. Is this the sequence of points within a certain scaled distance of each line, or something like this? Rather than relying on abstract terms, a graphical illustration would be much more effective in communicating the author's concept here. Or better yet (now that I have read ahead), please see comments on Figure 2.Although falling short of adding a dedicated figure, we tried to make the explanation more intuitive by changing “space” to “range” here as well as noting in the caption that it is the y-axis range between lines. Following the previous comment, we also added a reference to the appendix where a mathematical definition is given. We hope that these changes together clarify what the normalization is.
5. Figure 2. At the risk of complicating this figure, it might be helpful to label CV_N = 0 and 1 on the figure. I guess the solid blue line is CV_N = 0 and the solid red line is CV_N = 1, right?We have now added to the caption to explain that the solid lines do indeed correspond to CV_N = 0 and CV_N = 1. We also changed the lines in the next figure to have the same style.
6. Line 113. “Closer” would be a better description than "closest". This change is appropriate because only 2 options are being compared, and also because the data do not generally plot "close" to either end member, but are actually "closest" to the gray line separating the two end members in Figure 3.We changed the language to use “closer” rather than “closest”.
7. Line 122. Can this data point be highlighted in Figure 3, so the reader doesn't have to hunt for it by scanning the long and complex legend to the right?This point has the “Mixed” label directly above it in the figure. We have now added a parenthetical note to make that clearer and similarly did so for the other points.
Citation: https://doi.org/10.5194/egusphere-2026-1994-AC1
-
AC1: 'Reply on RC1', Christian Erikson, 08 Jul 2026
-
RC2: 'Comment on egusphere-2026-1994', Shawn Chartrand, 17 Jun 2026
-
AC2: 'Reply on RC2', Christian Erikson, 08 Jul 2026
We thank the reviewer for providing these comments and detail the changes we made to address them below. The original comments are copied in italics with the response beneath.
Reviewer 2
Introduction: I think it would be helpful if the authors explicitly define “regular” and “random” in the context of this paper. Later on in Section 3, a set of definitions are given in relation to the coefficient of variation. But the authors also invoke a Poisson process to define the random reference line used in several figures, essentially defining random as consistent with a Poisson process. Being explicit would be helpful.
We now mention in the introduction that Poisson processes emerge from the assumption that all locations have an equal probability of a step forming. We added further detail in the Appendix as well to explain that a Poisson process is a natural expression for randomness, which we modify with the exclusion zone.
Lines 10-11. I appreciate the fact that the authors have compiled a comprehensive data set to test their proposed framework, and I applaud them for doing so. However, on face value I think it is tricky to place numerical simulations in the same category as the field-based and experimental observations. Whereas I think the numerical work that has been done has helped to advance step-pool science – to me that is clear. Nonetheless, the numerics are biased in terms of the rules/mechanisms implemented which effect step spacing. To be clear, I have no issue with use of the numerical results to test the framework presented here. At the very least, some level of background context on the numerical simulations and specifially the algorithms developed to drive the associated simulations can be discussed so readers understand these in relation to field-based and experimental observations. My fundamental difficulty is weighting field-based, experimental and numerical simulations equally when considerating the results illustrated in the authors organizing framework (an additional comment is provided below in relation to the framework, and what it represents).
We now expand the explanation for the numerical simulations as a new section in the supporting information. In it, we briefly describe the modeling assumptions and how we implemented the model in order to provide more context to aid the reader in evaluating the results. We reference the new explanation after separately noting the CV_N value of the simulations.
Lines 21. Can the authors add references documenting the > 3% slope statement. A tremendous amount of fieldwork by numerous teams over the past four decades went into identifying this approximate minimum slope.
We added four references explicitly noting 3%.
Lines 21-23. I am curious why in referencing resistance to flow the authors do not mention or discuss the work by A.D. Abrahams and colleagues (1995, Water Resources Research)? Their research focused squarely on developing what is called the “maximum resistance to flow” hypothesis through a careful set of flume experiments and field-based observations. Their work seems relevant. Going one step further, their research seems relevant from the point of view of building the background discussing formative mechanisms. I understand the authors are focused on mechanisms which support perspectives based on step spacing “regularity” vs. “randomness”. In a real sense, step sequences which maximize flow resistance can be assocaited with “regularity”. I encourage the authors to consider spending a bit more time spent discussing the broader relevant literature here, and throughout the Introduction. The paper as submitted is relatively focused, so there is reasonable room to expand where it might be warranted and without distracting too much from the paper’s focus.
First answering the reviewer’s question, there are many formation mechanisms and we chose to highlight only those where the mechanism could be tied to a dataset. Tables 1 and 2 from Abrahams et al. (1995) provide only mean values of step spacings, which is insufficient to calculate the statistics needed for our diagram. We agree with the expectation that maximizing flow resistance would tend toward regularity, but we cannot evaluate this expectation due to the data limitation.
There are also other formation mechanisms we could potentially include in the overview, but because we have submitted the manuscript as a Letter format, the room to expand is actually quite limited. Rather than directly engage with mechanisms that would appear in the overview only, we now point the reader to reviews representing the full breath of possibilities.
Lines 41-43. Great sentence.
We appreciate the compliment.
Lines 44-47. It would be helpful if the authors could define their “framework” in more explicit terms. How would the authors describe their framework? Is it mathematical? Conceptual? Would they describe it as a regime space detailing how step spacing variability correlates (or co-varies since individual data points represent the same step sequence) with minimum spacing? I think one or two phrases inserted in the right locations, or one or two new sentences would be more than adequate here to address the comment.
We added the following two sentences to the introduction to clarify what the framework is and what effect it has: “The framework consists of two statistical measures of variability, which define a simple diagram. Within this space, the relative regularity and randomness of a step sequence becomes readily discernable.”
Lines 64. Use of the term bedform (here and elsewhere) for steep streams is not usual per my understanding. As I understand, Montgomery and Buffington (1997, Geological Society of America Bulletin) made it more customary to refer to river bed architectures in gravel and boulder-bed streams as “channel-reach morphology”, or “channel type”.
While we think the use of the term bedform in this particular line is appropriate, because the subject is antidunes rather than step-pools, we revised its use in line 45, which could have been a potential source of confusion.
Lines 72-73. I am unclear on the end of the sentence - “..with matching, typically random, spacing.” The word matching is throwing me off. Can the authors clarify?
We rephrased this line to explain that the matching is between the distribution of random initiation points and random steps. The revised sentence reads as “…leads to steps with typically random spacing since the distribution of initial clusters is itself usually random”
Lines 78-79. I think it would be helpful for all readers if you could simply write out the ratios you refer to in the sentences when discussing “standard deviation relative to the mean”, and “minimum spacing between steps relative to the mean”.
We added parenthetical equations.
Lines 84. I think it is a clever approach to model “random” steps as a Poisson process. Can you use any of the published data to test this probabilistic/statistical approach? For example, if a pool exclusion zone based on hydraulics is a pervasive physical mechanism which limits step spacing (I agree that it has to be important), do we see steps within an exclusion zone along step sequences which are classified as “random” in the presented comparative framework? Basically, I am asking if the authors can provide some additional justification for the Poisson modelling approach for the “random reference line” in addition to Curran and Wilcock (2005, Water Resources Research). I am not calling the approach in doubt, but my past fieldwork biases my perspective a bit because I cannot recall measuring a step-pool sequence where I thought downstream steps were not in some way influenced by the upstream step(s). Again, this represents my own personal bias.
A Poisson process requires independence between step location and an equal likelihood of formation at all locations, making it fitting as a statistical reference for randomness even without considering experimental observations. Consistent with the reviewer’s intuition, incorporating an exclusion zone deviates from true independence since a downstream step is influenced by the upstream step. We expanded the description of the Poisson process in the text and also now better explain that we modify complete randomness by adjusting the results of the simulation as a Poisson process in the Appendix.
Figure 2. I think it is interesting that the comparative framework regime space shows no clear correlation with local bed slope (or at least none that I can discern from visual interpretation only). Given that several 2 of 3 previous published papers frame step-pool geometry around slope, I think the result of Figure 2 deserves some discussion.
We have now added a figure to the supporting information showing the weak (R2 =0.03) trend between coefficient of variation and channel slope, confirming what the reviewer noticed. We also added a sentence in the results section with reference to this figure. We refrain from further discussion because the relationship shown in Fig. 2 is different from common suggestions slope-dependent geometry. Typically, step spacing directly has been connected to channel slope rather than spacing variability. Although we agree with the reviewer that the possible implication of mechanism not being selected by slope is interesting, we lack sufficient support to develop this in the discussion.
Figure 3. Nice result, made more impactful by labeling each point by the inferred mechanism from each publication.
Lines 120. I am not sure what “and match expectations” means at the end of the sentence.
We clarified what the matching is referring to by now writing: “…match the expectation that steps associated with these mechanisms should exhibit regularity”
Lines 121-123. A conclusion consistent with the implications of this statement was reached when plotting Whittaker and Jaeggi (1987) in the anti-dune stability field. Many of the reported points do not fall in the stability field – see Chartrand and Whiting (2000, Earth Surface Processes and Landforms, Figure 9a).
We are aware of the use of the antidune stability diagram in that context, as well as similar use by other others (Abrahams et al., 1985; Curran & Wilcock, 2005), but we think the existing explanation is sufficient for making the specific point that the antidune connection is questionable given that mentioning the antidune stability diagram would first require adding much more description and distract from that point.
Lines 134-136. This is a very important point – thanks for raising it. Can you report the variation in sample size for the datasets compiled and reported here? My general understanding is that it is common for step-pool sequences to contain anywhere from ~4-10 step-pool units. If this is correct, does this influence the conclusions drawn here (I suspect not since I believe the trends in the comparative framework are clear, and make physical sense)? Or is the sample size of the compiled data sets at least worthy of mention as a potential and inherent limitation? To be fair to the authors, I personally have never seen a step-pool sequence in nature with more than apprximately 15 step-pool units. And these cases define the end of the distribution from the fieldwork I have completed. My observational geography may be biased.
Sample sizes for all sequences can be found in the associated dataset (Erikson et al., 2026a). We also include an analysis of the effect of sample size with brief discussion in the supporting information. We have now added a reference to the text discussing sample size along with the reference to the relevant figure to make it clearer that it is included in the supporting information because of constraints on space. In short, the reviewer is correct that sample size seems to affect plot positioning but without changing interpretations, since the position of a sequence moves along a reference line as sample size changes (Fig. S1).
Lines 142. Why is a roughness-based mechanism “likely” in relation to other mechanisms? It would help to explicitly frame out the reasons and rationale in support of the statement.
The two sentences prior to the one on line 142 provide the rational for the statement that a roughness-based mechanism is likely. To reiterate them, first, the Whittaker & Jaeggi variability metrics are similar to steps from sequences explicitly tied to roughness-based mechanisms, as indicated by the adjacent points on the plot, and, second, Whittaker & Jaeggi themselves noted that initial formation was influenced by bed roughness.
Lines 155-165. I think this is an important paragraph – thanks to the authors for focusing on the subject points of the paragraph. I note that at least two prior publications have put forth specific analysis of how step-pool geometry has changed in time along the Rio Cordon, for example, following flood events (see Lenzi, 2001, Earth Surface Processes and Landforms; Chartrand et al., 2011, Geomorphology). Given this is a focus of the paragraph, a broader discussion folding in this work may be merited.
We added these, and other, references in additional discussion highlighting the dynamic nature of step-pools and the need for appropriate definitions of equilibrium.
Appendices: Thanks for including the three appendices. They helped me better understand some of the analysis sitting behind the results.
We now better reference the Appendix to increase its efficacy.
Citation: https://doi.org/10.5194/egusphere-2026-1994-AC2
-
AC2: 'Reply on RC2', Christian Erikson, 08 Jul 2026
Peer review completion


Interactive discussion
Status: closed
-
RC1: 'Comment on egusphere-2026-1994', James Pizzuto, 15 Jun 2026
I really enjoyed this paper, and appreciated how its approach to data analysis allows one to better understand the implications of step-pool spacing with regard to possible governing processes. As pointed out by the authors, the approach has important implications for restoration designs.
I have made a few, mostly minor, editorial comments that I believe will improve the authors’ ability to communicate their ideas, but otherwise the manuscript is pretty close to being ready for publication.
Jim Pizzuto
Professor Emeritus
University of Delaware
USA
Some detailed comments, keyed to the text:
1. Line 11. Is it possible to describe these inherent limits on minimum spacing, so the reader can understand this without going through the entire article? This would help facilitate acceptance of the authors' ideas, though it might be difficult to achieve.
2. Line 44. Is it possible to more clearly state the goal of this paper? What is a "framework"? Is it a mathematical approach to evaluating step-pool spacing that is independent of formation mechanism? Is it a hypothesis? A type of formal data analysis (i.e., a process for analyzing observations of step-pool spacing)? Something else? It would be helpful to the reader to better understand what the authors are contributing here.
3. Line 81. In the spirit of reproducibility, it might be helpful to include (likely in the supplement) a series of computational steps followed in creating the reference lines. I have some rather dim idea regarding how this is done, but if I wanted to recreate Figure 2, I would be pretty confused regarding the details. Ok, now I see this in the Appendix, so ideally the appendix can be referenced here so the reader knows where to look.
4. Line 86. I think it would be helpful to add a figure to illustrate the concept of "space between reference lines". I am not sure what this concept refers to. Is this the sequence of points within a certain scaled distance of each line, or something like this? Rather than relying on abstract terms, a graphical illustration would be much more effective in communicating the author's concept here. Or better yet (now that I have read ahead), please see comments on Figure 2.
5. Figure 2. At the risk of complicating this figure, it might be helpful to label CV_N = 0 and 1 on the figure. I guess the solid blue line is CV_N = 0 and the solid red line is CV_N = 1, right?
6. Line 113. “Closer” would be a better description than "closest". This change is appropriate because only 2 options are being compared, and also because the data do not generally plot "close" to either end member, but are actually "closest" to the gray line separating the two end members in Figure 3.
7. Line 122. Can this data point be highlighted in Figure 3, so the reader doesn't have to hunt for it by scanning the long and complex legend to the right?Citation: https://doi.org/10.5194/egusphere-2026-1994-RC1 -
AC1: 'Reply on RC1', Christian Erikson, 08 Jul 2026
We thank the reviewer for providing these comments and detail the changes we made to address them below. The original comments are copied in italics with the response beneath.
Reviewer 1
1. Line 11. Is it possible to describe these inherent limits on minimum spacing, so the reader can understand this without going through the entire article? This would help facilitate acceptance of the authors' ideas, though it might be difficult to achieve.
To provide more context within the limited space in the abstract, we replaced “inherent” with “hydraulically-set”.
2. Line 44. Is it possible to more clearly state the goal of this paper? What is a "framework"? Is it a mathematical approach to evaluating step-pool spacing that is independent of formation mechanism? Is it a hypothesis? A type of formal data analysis (i.e., a process for analyzing observations of step-pool spacing)? Something else? It would be helpful to the reader to better understand what the authors are contributing here.We added clarification by now stating: “The framework consists of two statistical measures of variability, which define a simple diagram. Within this space, the relative regularity and randomness of a step sequence becomes readily discernable.”
3. Line 81. In the spirit of reproducibility, it might be helpful to include (likely in the supplement) a series of computational steps followed in creating the reference lines. I have some rather dim idea regarding how this is done, but if I wanted to recreate Figure 2, I would be pretty confused regarding the details. Ok, now I see this in the Appendix, so ideally the appendix can be referenced here so the reader knows where to look.We added the missing appropriate references to the appendix.
4. Line 86. I think it would be helpful to add a figure to illustrate the concept of "space between reference lines". I am not sure what this concept refers to. Is this the sequence of points within a certain scaled distance of each line, or something like this? Rather than relying on abstract terms, a graphical illustration would be much more effective in communicating the author's concept here. Or better yet (now that I have read ahead), please see comments on Figure 2.Although falling short of adding a dedicated figure, we tried to make the explanation more intuitive by changing “space” to “range” here as well as noting in the caption that it is the y-axis range between lines. Following the previous comment, we also added a reference to the appendix where a mathematical definition is given. We hope that these changes together clarify what the normalization is.
5. Figure 2. At the risk of complicating this figure, it might be helpful to label CV_N = 0 and 1 on the figure. I guess the solid blue line is CV_N = 0 and the solid red line is CV_N = 1, right?We have now added to the caption to explain that the solid lines do indeed correspond to CV_N = 0 and CV_N = 1. We also changed the lines in the next figure to have the same style.
6. Line 113. “Closer” would be a better description than "closest". This change is appropriate because only 2 options are being compared, and also because the data do not generally plot "close" to either end member, but are actually "closest" to the gray line separating the two end members in Figure 3.We changed the language to use “closer” rather than “closest”.
7. Line 122. Can this data point be highlighted in Figure 3, so the reader doesn't have to hunt for it by scanning the long and complex legend to the right?This point has the “Mixed” label directly above it in the figure. We have now added a parenthetical note to make that clearer and similarly did so for the other points.
Citation: https://doi.org/10.5194/egusphere-2026-1994-AC1
-
AC1: 'Reply on RC1', Christian Erikson, 08 Jul 2026
-
RC2: 'Comment on egusphere-2026-1994', Shawn Chartrand, 17 Jun 2026
-
AC2: 'Reply on RC2', Christian Erikson, 08 Jul 2026
We thank the reviewer for providing these comments and detail the changes we made to address them below. The original comments are copied in italics with the response beneath.
Reviewer 2
Introduction: I think it would be helpful if the authors explicitly define “regular” and “random” in the context of this paper. Later on in Section 3, a set of definitions are given in relation to the coefficient of variation. But the authors also invoke a Poisson process to define the random reference line used in several figures, essentially defining random as consistent with a Poisson process. Being explicit would be helpful.
We now mention in the introduction that Poisson processes emerge from the assumption that all locations have an equal probability of a step forming. We added further detail in the Appendix as well to explain that a Poisson process is a natural expression for randomness, which we modify with the exclusion zone.
Lines 10-11. I appreciate the fact that the authors have compiled a comprehensive data set to test their proposed framework, and I applaud them for doing so. However, on face value I think it is tricky to place numerical simulations in the same category as the field-based and experimental observations. Whereas I think the numerical work that has been done has helped to advance step-pool science – to me that is clear. Nonetheless, the numerics are biased in terms of the rules/mechanisms implemented which effect step spacing. To be clear, I have no issue with use of the numerical results to test the framework presented here. At the very least, some level of background context on the numerical simulations and specifially the algorithms developed to drive the associated simulations can be discussed so readers understand these in relation to field-based and experimental observations. My fundamental difficulty is weighting field-based, experimental and numerical simulations equally when considerating the results illustrated in the authors organizing framework (an additional comment is provided below in relation to the framework, and what it represents).
We now expand the explanation for the numerical simulations as a new section in the supporting information. In it, we briefly describe the modeling assumptions and how we implemented the model in order to provide more context to aid the reader in evaluating the results. We reference the new explanation after separately noting the CV_N value of the simulations.
Lines 21. Can the authors add references documenting the > 3% slope statement. A tremendous amount of fieldwork by numerous teams over the past four decades went into identifying this approximate minimum slope.
We added four references explicitly noting 3%.
Lines 21-23. I am curious why in referencing resistance to flow the authors do not mention or discuss the work by A.D. Abrahams and colleagues (1995, Water Resources Research)? Their research focused squarely on developing what is called the “maximum resistance to flow” hypothesis through a careful set of flume experiments and field-based observations. Their work seems relevant. Going one step further, their research seems relevant from the point of view of building the background discussing formative mechanisms. I understand the authors are focused on mechanisms which support perspectives based on step spacing “regularity” vs. “randomness”. In a real sense, step sequences which maximize flow resistance can be assocaited with “regularity”. I encourage the authors to consider spending a bit more time spent discussing the broader relevant literature here, and throughout the Introduction. The paper as submitted is relatively focused, so there is reasonable room to expand where it might be warranted and without distracting too much from the paper’s focus.
First answering the reviewer’s question, there are many formation mechanisms and we chose to highlight only those where the mechanism could be tied to a dataset. Tables 1 and 2 from Abrahams et al. (1995) provide only mean values of step spacings, which is insufficient to calculate the statistics needed for our diagram. We agree with the expectation that maximizing flow resistance would tend toward regularity, but we cannot evaluate this expectation due to the data limitation.
There are also other formation mechanisms we could potentially include in the overview, but because we have submitted the manuscript as a Letter format, the room to expand is actually quite limited. Rather than directly engage with mechanisms that would appear in the overview only, we now point the reader to reviews representing the full breath of possibilities.
Lines 41-43. Great sentence.
We appreciate the compliment.
Lines 44-47. It would be helpful if the authors could define their “framework” in more explicit terms. How would the authors describe their framework? Is it mathematical? Conceptual? Would they describe it as a regime space detailing how step spacing variability correlates (or co-varies since individual data points represent the same step sequence) with minimum spacing? I think one or two phrases inserted in the right locations, or one or two new sentences would be more than adequate here to address the comment.
We added the following two sentences to the introduction to clarify what the framework is and what effect it has: “The framework consists of two statistical measures of variability, which define a simple diagram. Within this space, the relative regularity and randomness of a step sequence becomes readily discernable.”
Lines 64. Use of the term bedform (here and elsewhere) for steep streams is not usual per my understanding. As I understand, Montgomery and Buffington (1997, Geological Society of America Bulletin) made it more customary to refer to river bed architectures in gravel and boulder-bed streams as “channel-reach morphology”, or “channel type”.
While we think the use of the term bedform in this particular line is appropriate, because the subject is antidunes rather than step-pools, we revised its use in line 45, which could have been a potential source of confusion.
Lines 72-73. I am unclear on the end of the sentence - “..with matching, typically random, spacing.” The word matching is throwing me off. Can the authors clarify?
We rephrased this line to explain that the matching is between the distribution of random initiation points and random steps. The revised sentence reads as “…leads to steps with typically random spacing since the distribution of initial clusters is itself usually random”
Lines 78-79. I think it would be helpful for all readers if you could simply write out the ratios you refer to in the sentences when discussing “standard deviation relative to the mean”, and “minimum spacing between steps relative to the mean”.
We added parenthetical equations.
Lines 84. I think it is a clever approach to model “random” steps as a Poisson process. Can you use any of the published data to test this probabilistic/statistical approach? For example, if a pool exclusion zone based on hydraulics is a pervasive physical mechanism which limits step spacing (I agree that it has to be important), do we see steps within an exclusion zone along step sequences which are classified as “random” in the presented comparative framework? Basically, I am asking if the authors can provide some additional justification for the Poisson modelling approach for the “random reference line” in addition to Curran and Wilcock (2005, Water Resources Research). I am not calling the approach in doubt, but my past fieldwork biases my perspective a bit because I cannot recall measuring a step-pool sequence where I thought downstream steps were not in some way influenced by the upstream step(s). Again, this represents my own personal bias.
A Poisson process requires independence between step location and an equal likelihood of formation at all locations, making it fitting as a statistical reference for randomness even without considering experimental observations. Consistent with the reviewer’s intuition, incorporating an exclusion zone deviates from true independence since a downstream step is influenced by the upstream step. We expanded the description of the Poisson process in the text and also now better explain that we modify complete randomness by adjusting the results of the simulation as a Poisson process in the Appendix.
Figure 2. I think it is interesting that the comparative framework regime space shows no clear correlation with local bed slope (or at least none that I can discern from visual interpretation only). Given that several 2 of 3 previous published papers frame step-pool geometry around slope, I think the result of Figure 2 deserves some discussion.
We have now added a figure to the supporting information showing the weak (R2 =0.03) trend between coefficient of variation and channel slope, confirming what the reviewer noticed. We also added a sentence in the results section with reference to this figure. We refrain from further discussion because the relationship shown in Fig. 2 is different from common suggestions slope-dependent geometry. Typically, step spacing directly has been connected to channel slope rather than spacing variability. Although we agree with the reviewer that the possible implication of mechanism not being selected by slope is interesting, we lack sufficient support to develop this in the discussion.
Figure 3. Nice result, made more impactful by labeling each point by the inferred mechanism from each publication.
Lines 120. I am not sure what “and match expectations” means at the end of the sentence.
We clarified what the matching is referring to by now writing: “…match the expectation that steps associated with these mechanisms should exhibit regularity”
Lines 121-123. A conclusion consistent with the implications of this statement was reached when plotting Whittaker and Jaeggi (1987) in the anti-dune stability field. Many of the reported points do not fall in the stability field – see Chartrand and Whiting (2000, Earth Surface Processes and Landforms, Figure 9a).
We are aware of the use of the antidune stability diagram in that context, as well as similar use by other others (Abrahams et al., 1985; Curran & Wilcock, 2005), but we think the existing explanation is sufficient for making the specific point that the antidune connection is questionable given that mentioning the antidune stability diagram would first require adding much more description and distract from that point.
Lines 134-136. This is a very important point – thanks for raising it. Can you report the variation in sample size for the datasets compiled and reported here? My general understanding is that it is common for step-pool sequences to contain anywhere from ~4-10 step-pool units. If this is correct, does this influence the conclusions drawn here (I suspect not since I believe the trends in the comparative framework are clear, and make physical sense)? Or is the sample size of the compiled data sets at least worthy of mention as a potential and inherent limitation? To be fair to the authors, I personally have never seen a step-pool sequence in nature with more than apprximately 15 step-pool units. And these cases define the end of the distribution from the fieldwork I have completed. My observational geography may be biased.
Sample sizes for all sequences can be found in the associated dataset (Erikson et al., 2026a). We also include an analysis of the effect of sample size with brief discussion in the supporting information. We have now added a reference to the text discussing sample size along with the reference to the relevant figure to make it clearer that it is included in the supporting information because of constraints on space. In short, the reviewer is correct that sample size seems to affect plot positioning but without changing interpretations, since the position of a sequence moves along a reference line as sample size changes (Fig. S1).
Lines 142. Why is a roughness-based mechanism “likely” in relation to other mechanisms? It would help to explicitly frame out the reasons and rationale in support of the statement.
The two sentences prior to the one on line 142 provide the rational for the statement that a roughness-based mechanism is likely. To reiterate them, first, the Whittaker & Jaeggi variability metrics are similar to steps from sequences explicitly tied to roughness-based mechanisms, as indicated by the adjacent points on the plot, and, second, Whittaker & Jaeggi themselves noted that initial formation was influenced by bed roughness.
Lines 155-165. I think this is an important paragraph – thanks to the authors for focusing on the subject points of the paragraph. I note that at least two prior publications have put forth specific analysis of how step-pool geometry has changed in time along the Rio Cordon, for example, following flood events (see Lenzi, 2001, Earth Surface Processes and Landforms; Chartrand et al., 2011, Geomorphology). Given this is a focus of the paragraph, a broader discussion folding in this work may be merited.
We added these, and other, references in additional discussion highlighting the dynamic nature of step-pools and the need for appropriate definitions of equilibrium.
Appendices: Thanks for including the three appendices. They helped me better understand some of the analysis sitting behind the results.
We now better reference the Appendix to increase its efficacy.
Citation: https://doi.org/10.5194/egusphere-2026-1994-AC2
-
AC2: 'Reply on RC2', Christian Erikson, 08 Jul 2026
Peer review completion
Journal article(s) based on this preprint
Model code and software
Code for Step-Pool Reference Lines C. Erikson https://github.com/cmerikson/StepPool_ReferenceLines
Viewed
| HTML | XML | Total | Supplement | BibTeX | EndNote | |
|---|---|---|---|---|---|---|
| 284 | 129 | 38 | 451 | 97 | 54 | 47 |
- HTML: 284
- PDF: 129
- XML: 38
- Total: 451
- Supplement: 97
- BibTeX: 54
- EndNote: 47
Viewed (geographical distribution)
| Country | # | Views | % |
|---|
| Total: | 0 |
| HTML: | 0 |
| PDF: | 0 |
| XML: | 0 |
- 1
Christian M. Erikson

Jens M. Turowski
The requested preprint has a corresponding peer-reviewed final revised paper. You are encouraged to refer to the final revised version.
- Preprint
(745 KB) - Metadata XML
-
Supplement
(333 KB) - BibTeX
- EndNote
- Final revised paper