
the Creative Commons Attribution 4.0 License.
the Creative Commons Attribution 4.0 License.
 | 11 May 2026
The North American CORDEX-CMIP6 WRF evaluation run: comparing historical simulations from 25 km to convection-permitting scales
Abstract. Earth system models (ESMs) provide essential insight into large-scale climate variability and change but often lack the spatial resolution required to represent fine-scale processes critical for regional impacts and adaptation planning. To help address this gap, we present an updated high-resolution regional climate simulation for North America (NA) as part of the Coordinated Regional Downscaling Experiment (CORDEX). We evaluate a new reanalysis forced NA-CORDEX simulation at 12 km resolution against observational datasets, an earlier NA-CORDEX CMIP5 simulation (25 km), and the convection-permitting CONUS-404 simulation (4 km). Through these comparisons, we assess how horizontal resolution and regional model configuration influence historical biases and extremes, with a particular focus on precipitation processes given that convection is parameterized at 12 km. Relative to previous NA-CORDEX-CMIP5 simulations, the new CMIP6-based evaluation run reduces mean biases in temperature and precipitation, improves the magnitude and timing of the diurnal precipitation cycle across North America, and substantially improves the representation of tropical cyclone structure and intensity. Notably, extreme precipitation rates are well captured at 12 km when compared to the convection-permitting simulations. While long-term convection-permitting climate simulations remain a key objective for regional modeling, the current generation of CORDEX simulations provides a practical balance between computational efficiency and physical realism for continental-scale climate assessment.
Competing interests: At least one of the (co-)authors is a member of the editorial board of Geoscientific Model Development. The peer-review process was guided by an independent editor, and the authors also have no other competing interests to declare.
Publisher's note: Copernicus Publications remains neutral with regard to jurisdictional claims made in the text, published maps, institutional affiliations, or any other geographical representation in this paper. While Copernicus Publications makes every effort to include appropriate place names, the final responsibility lies with the authors. Views expressed in the text are those of the authors and do not necessarily reflect the views of the publisher.-
Notice on discussion status
The requested preprint has a corresponding peer-reviewed final revised paper. You are encouraged to refer to the final revised version.
-
Preprint
(26473 KB)
-
Supplement
(12237 KB)
-
The requested preprint has a corresponding peer-reviewed final revised paper. You are encouraged to refer to the final revised version.
- Preprint
(26473 KB) - Metadata XML
-
Supplement
(12237 KB) - BibTeX
- EndNote
- Final revised paper


Journal article(s) based on this preprint
This study presents a new 12 km CORDEX (Coordinated Regional Downscaling Experiment )-CMIP6 (Coupled Model Intercomparison Project) WRF (Weather Research and Forecasting) simulation for North America, compared against an earlier 25 km CMIP5 version and a 4 km convection-permitting simulation. The updated run reduces temperature and precipitation biases, improves precipitation timing, and better captures tropical cyclone intensity. Extreme precipitation at 12 km closely matches convection-permitting results, offering a practical resolution for regional climate assessment.
Interactive discussion
Status: closed
-
CC1: 'Comment on egusphere-2026-1638', Silvina Solman, 19 Jun 2026
Publisher’s note: this comment is a copy of RC1 and its content was therefore removed on 29 June 2026.
Citation: https://doi.org/10.5194/egusphere-2026-1638-CC1 -
CC2: 'Reply on CC1', Silvina Solman, 19 Jun 2026
Publisher’s note: this comment is a copy of RC1 and its content was therefore removed on 29 June 2026.
Citation: https://doi.org/10.5194/egusphere-2026-1638-CC2 -
AC1: 'Reply on CC1', Jacob Stuivenvolt-Allen, 06 Jul 2026
Hello Dr. Solman,
Thank you for a thorough and constructive review – we really appreciate it. In particular, we think clarifying the objectives of this work and adding more comparisons with reanalysis/observational datasets will improve the manuscript. Please see our initial thoughts at how to address your general concerns with this work. We plan to provide a response to each comment in short time.
On overall objectives (General Comment 1):
We will clarify the manuscript's objectives in the introduction and conclusions. The evaluation focuses on four areas: mean climatological biases in temperature and precipitation, diurnal precipitation processes, seasonal hydroclimate (snow and the North American monsoon), and extreme events (tropical cyclones and a mesoscale convective system case study).On restructuring case studies vs. climatology (General Comment 2):
We will retain organization by phenomenon rather than by method. Tropical cyclones will be treated in a single section covering both the Hurricane Ivan case study and the climatological analysis of Gulf TCs, and the MCS case study will remain separate. We will add clear subheadings and transition sentences marking the shift from case study to climatology within the TC section, so the distinction in approach is explicit rather than implied.On harmonizing the snow section's style (General Comment 3):
We will revise the snow discussion to match the tone and structure of the preceding sections.On reference data for case studies (General Comment 5; overlaps with Reviewer 2 point 2):
We will add ERA5 as a reference comparison for the case-study analysis, and note where ERA5's coarser resolution limits its use as ground truth for the TC case study.On Figure 10 (General Comment 4):
Confirmed as an error: the SNOTEL/HUC-8 seasonal SWE figure discussed in the text does not currently exist as a distinct labeled figure, as this figure was moved into the supplement. We will correct the figure references to relate to that figure (Figure S4).Citation: https://doi.org/10.5194/egusphere-2026-1638-AC1 -
AC3: 'Reply on CC1', Jacob Stuivenvolt-Allen, 20 Aug 2026
Thank you Dr. Solman for your constructive review of this work. In particular, the suggested inclusion of more reanalysis-based reference data is useful context for the reader, and we think the manuscript has benefitted a lot from the other suggestions you’ve made. Please see line-by-line comments below and thank you for your time! Please see our responses to each of your comments, questions and concerns in the attached pdf.
-
CC2: 'Reply on CC1', Silvina Solman, 19 Jun 2026
-
RC1: 'Comment on egusphere-2026-1638', Silvina Solman, 19 Jun 2026
The manuscript assesses the improvements in the most updated WRF evaluation simulation for the CORDEX-NA domain compared with a previous generation simulation. It also compares the simulated results against a convection-permitting simulation available for North America. The analysis is valuable and needed, as it represents the basis for identifying strengths and limitations of the most updated WRF simulation for the NA-CORDEX domain. The manuscript is very well written and conveys a clear message. However, in some passages the narrative seems to be somewhat disorganized and disconnected. This is particularly evident when analyzing snow features and extreme precipitation. I would recommend separating the case study analysis from the climatological assessment given the different approach followed.
There is a number of general and detailed comments, listed below, that should be considered to improve the overall readability and quality of the manuscript, before publication.
General comments
- The overall objectives of the manuscript are too vague. It is mentioned that the authors pursue assessing improvements from the corresponding previous-generation simulation. On what? What phenomena or climate feature are being assessed? I recommend clarifying on what features the analysis is focused.
- I recommend restructuring the analysis and differentiate the climatological analysis from the case studies analysis. The content starting in page 8 line 240 should be moved to a new section dedicated to case studies.
- The discussion on the representation of snow seems to be written in a very different style as compared with previous sections. Please harmonize the writing style if possible.
- Revise the discussion around Figure 10. There is a Figure 10 in the manuscript but it does not contain what is discussed in the paragraph referring to it. Moreover, one figure seems to be lacking (snow features).
- The analysis focused on on case studies (TC and MCS) should include some reference to compare with. ERA5 may be too coarse but at least may provide some overall idea of the features evaluated. Particularly for the MCS, since the discussion is around the synoptic environment features, the comparison against ERA5 should be presented.
Detailed comments
- Page 2 lines 35-45: Are the physical parameterizations mentioned the actual selection used for the NA-CORDEX WRF simulation being assessed? This is not clear and needs to be clarified. As it is written, it seems that the only improvements in the WRF model are related with the physics schemes mentioned in the paragraph (which is certainly not the case). I recommend to clarify that the schemes highlighted are those used in the new simulation.
- Page 2 line 44: Who are you referring to as “our contribution” to NA-CORDEX? Who are “our”? Please clarify.
- Page 3 line 57: Add CORDEX domain after North America.
- Page 3 lines 70-73: It would be recommendable to consider that the sensitivity tests for identifying the optimal physics selection may not end up in the same choice if the tests were done with different combinations of physical parameterizations, given the strong interdependencies among physical processes and how these interdependences are treated by different combinations of parameterizations.
- Page 3 lines 75-79: The simulated period should be clearly indicated in this paragraph.
- Figure 1 is not referenced in the text.
- Page 5 – lines 142-143: Should “from July 1 through August 31” be “from June 1 through Augus 31”, to be consistent with Fig. 5 legend?
- Page 6 – line 157: NAM region has not been defined. Please clarify.
- Page 6 – line 163: Are you referring to Figure 5d for IMERGE? If this is the case, replace Fig. 5d-g by Fig. 5d and refer to Fig. 5e-g when referring to the WRF simulations.
- Page 6 – lines 163-164: I don’t see IMERGE rainfall rate being systematically smaller than WRF in Figure 5d. Can you identify where this feature is apparent?
- Page 7 - lines 173-178: Revise. It seems that some parentheses are lacking.
- Figure 7: Revise figure legend and panel titles.
- Page 8 - lines 201-205: This paragraph seems to be disconnected from the narrative. I recommend inverting the order of this and the following paragraph to ease readiness.
- Page 8 – lines 209-210: The information on how Figure 9 is organized is already in the figure legend. It is not necessary to repeat it in the text. Please remove this line.
- Page 8 - lines 214-215: Why is the seasonality of the snow cycle not possible to be evaluated against the University of Arizona SWE data? Please clarify.
- Page 8: there is no analysis based on Figure 10, but what is the expected result. Figure 10 only displays the results from the simulations with no observation. Please provide an analysis of that figure, otherwise, it should be removed.
- Page 8 – line 216: Please revise the reference to the Figure. Figure ??a is indicated.
- Page 8 –lines 216-223: Revise this paragraph. No figure is displayed related with what is discussed here. There is a reference to Figure 10b/10c-e but Figure 10 only shows the histogram of monthly precipitation. Check carefully the consistency between the text and the figures before submitting the manuscript, otherwise it is impossible to provide a comment on the analysis.
- Page 8: last paragraph: Figure 10 is referenced but referring to a different content. Please revise the list of figures included in the manuscript.
- Page 8 – Page 9 - lines 225-239: The analysis of extreme precipitation lacks a more in-depth discussion. It is written in a very disorganized way. Please re write.
- Page 9 – lines 236-237: Where is the observed histogram displayed to state that the C404 dataset closely matches station-based observational estimates? The observational-based results should be included in this figure. Otherwise, make it clear that you are just referring to referenced literature.
- Page 9 – lines 247-255: To what extent reanalysis data (ERA5) can be used to compare against simulations? The discussion focus on highlighting that the C404 results are comparable with NAC6 results, but are these realistic? Consider including ERA5 reanalysis results just to have a reference to compare with.
- Figure S4 is not referenced in the text.
Citation: https://doi.org/10.5194/egusphere-2026-1638-RC1 -
AC6: 'Reply on RC1', Jacob Stuivenvolt-Allen, 20 Aug 2026
Thank you for this review. As this review is an exact duplicate of the other provided by Dr. Solman, we have attached our reviewer responses to the other discussion.
Citation: https://doi.org/10.5194/egusphere-2026-1638-AC6
-
RC2: 'Comment on egusphere-2026-1638', Anonymous Referee #2, 02 Jul 2026
In their study, Stuivenvolt-Allen et al. present an evaluation of a historical simulation with WRF (NAC6), as part of the North American CORDEX-CMIP suite simulations. The evaluation is performed comparing with several observation based data sets (GPM-IMERG, SNOTEL, among others), and with a convective-allowing simulation (C404). The authors find that the new simulation (NAC6, forced by ERA5) exhibits several improvements with respect to a previous analogous simulation (NAC5 forced by ERA-Interim), especially in the representation of the diurnal cycle of precipitation, precipitation extremes, and snow.
The manuscript is clear and well written. The analysis and findings are of interest to a broad community. However, some improvements could be made before publication, as suggested in the comments below. I suggest Major Revisions of this manuscript in its current state. I hope that the comments below would be helpful to the authors.
General comments:
-----------------A. About biases.
Regarding the comparison to ERA5-Land (Figs. 2, 3, 4), it would be interesting to also see a comparison to other observation based data sets, like those from CRU, CHIRPS, CHIRTS, or similar. The authors could also comment on why it is better to compare to ERA5-Land instead of those observation based gridded data sets. Whereas temperature in ERA5-Land benefits from direct data assimilation, precipitation is a product from the model (as the authors write in the text), with some biases.
In general, the authors make a description of the biases, with some references to other papers where specific processes/mechanisms have been identified to explain some of the biases. However, the authors can include some comments or hypothesis about part of the biases identified in their study (see specific comments below).
B. About "Extreme events" (section 3.4)
Section 3.4 about extreme events is interesting: the authors compare a set of specific weather events (Figure 11 and 13), and some statistics for TCs (Figure 12). According to the authors, these comparisons are possible since all model simulations (C404, NAC5 and NAC6) use spectral nudging by reanalyses fields. However, for some of the comparisons it is important to bear in mind that two different reanalyses are used (ERA5 and ERA-Interim), with different intrinsic resolutions (equivalent grid-spacing close to 0.25° and 0.75°, respectively). In this sense, one could say, for example, that part of the improvement in the simulation of a TC (NAC6 vs. NAC5) could be associated with a higher resolution used to produce ERA5, and not mainly to the higher resolution of NAC6.
Furthermore, the representation of features related with some "Extreme events" (e.g. the TC features in Figs. 11 and 12) could depend on the resolution of the ESMs or GCMs used for the planned NA-CORDEX-CMIP6 simulation suite (coarser than ERA5). In this case, it could happen that the simulated TCs with the NAC6 configuration could be of the same type as the NAC5 structure and statistics in Figs 11 and 12. In this context, the analysis in section 3.4 might not be representative of what would be expected in the NA-CORDEX-CMIP6 simulation suite.
I suggest the authors take these points into consideration in the analysis of section 3.4, and in the conclusions (e.g. lines 299-302).
C. About other capabilities and skills: interannual variability.
While sections 3.1-3.3 are devoted to the mean state, and mean seasonal and diurnal patterns, section 3.4 is devoted to weather systems. To complement these analyses, it would be interesting to see the mean states and/or their biases associated with interannual variations in the boundary conditions, e.g. associated with ENSO phases. The common time period 1980-2010, and the use of reanalysis data as forcing (along with spectral nudging) would allow to explore the statistics of temperature and precipitation during El Niño vs. La Niña. Or comparing composites derived from particularly cold vs. particularly warm SSTs in nearby regions. This kind of analysis could provide statistics for the mean states or the mean biases associated with different climate regimes, which could be relevant for the interpretation of the planned NA-CORDEX-CMIP6 simulation suite. To avoid going much further beyond the scope of the present study, a relatively simple analysis of composites (El Niño vs. La Niña) would suffice.
Specific Comments:
------------------L52. Please provide one or two examples of the similarity among simulations: model domain? time period?
L58. This seems like a good place to refer the reader to Figure 1.
L64. Table 1: please provide some details about the physics in Noah-MP, e.g. dynamic vegetation, groundwater scheme, depth of roots, etc.
L73-77. From the text, I assume no restart files form WRF are used, but a new simulation is started for each time slice: is this correct? Please provide a justification as to why no restart files are used, what would be the consequences for slow evolution fields (e.g. soil moisture, snow cover, and those associated with vegetation dynamics), and would be the potential differences in this sense with respecto to C404 (continuous simulation?).
L103-109 The C404 warm biases over complex terrain (e.g. western U.S.) could be more directly associated with lower valleys in the 4 km representation of topography, in comparison with the 9 km representation of ERA5-Land. The same reasoning would not directly apply to the comparison between NAC6 and ERA5-land. Could you please expand on these difference?
L109-110. Do you have any hypothesis to explain the cold biases throughout central and eastern North America?
L131. Could this be associated with too much cloudiness at night?
L159-160. Any hypothesis as to why NAC6 exhibits a better picture of nocturnal precipitation, compared to NAC5?
L171. From figures 6c and 6d it is not too obvious that NAC6 exhibits a better eastward propagation than NAC5. Perhaps a version of these figures, in terms of fractional precipitation (w.r.t. to total daily precipitation) would help to better see the eastward propagation in NAC6.
L181. Fig. 7a: I guess this refers to ERA5-Land data. Caption of the figure also needs corrections.
L216. Fix the number of the figure: "Figure ??a" --> "Figure S4a" ?
L221. Change to "He et al. (2021)"
L212-220. The authors talk about comparison with SNOTEL data, and to figures 10c-e. However, in the current version of the PDF of the main text, Figure 10 only shows one graph ("CONUS maximum precipitation histogram"), with no reference to SNOTEL data. It seems that the authors are referring to Figure S4.
L226. Instead of "all datasets use spectral nudging", I would say "all simulations use spectral nudging".
L247. Instead of "solar flux", I guess you are talking about "shortwave radiation". It would be better to visualize OLR, which is related with deeper clouds and precipitation.
L240-255. The results in figure 11 are interesting. Take into account, that forcing for NAC5 (ERA-Interim) is coarser than for C404 and NAC6 (ERA5), which probably has an effect in the resulting structures (e.g. in the gradients in the forcing fields) and features via the spectral nudging (e.g. compare the TC in ERA-Interim vs. ERA5).
L261-265. Results from figure 12 are very interesting. Are the differences between means (medians) statistically significant?
L275. Instead of "all datasets use spectral nudging", I would say "all simulations use spectral nudging".
Citation: https://doi.org/10.5194/egusphere-2026-1638-RC2 -
AC2: 'Reply on RC2', Jacob Stuivenvolt-Allen, 06 Jul 2026
Dear reviewer,
Thank you for your review and the constructive comments about this work. We think the manuscript will benefit a lot from: 1) having more comparisons of biases with different observational datasets and 2) showing some statistics on how our simulations represent interannual climate variability. Please see our initial thoughts on how to address your concerns below – we will provide a point-by-point response as soon as possible.
On additional observational datasets for bias comparison (General Comment A):
We will add supplementary comparisons against other observation based gridded datasets relevant to each variable (e.g., IMERG, CHIRPS for precipitation), and comment on why ERA5-Land was chosen as the primary reference, noting that its temperature benefits from direct assimilation while its precipitation is model derived.On reanalysis resolution differences (General Comment B):
We will clarify that NAC5 and NAC6 are driven by different reanalyses (ERA-Interim, approximately 0.75°, versus ERA5, approximately 0.25°), and that improvements from NAC5 to NAC6 partly reflect this difference in driving data resolution, not solely the WRF model resolution increase. We will note this explicitly in the TC and MCS results, and state in the conclusions that this caveats how directly these results extend to the planned NA-CORDEX-CMIP6 ensemble, which will be driven by coarser GCM output rather than ERA5.On interannual variability and ENSO composites (General Comment C):
We will add a simple composite analysis comparing El Niño and La Niña periods (or warm versus cold SST regimes) for temperature and precipitation over 1980-2010, to complement the existing mean state and case study analyses. We will keep this addition concise to stay within the scope of the current manuscript.Citation: https://doi.org/10.5194/egusphere-2026-1638-AC2 -
AC4: 'Reply on RC2', Jacob Stuivenvolt-Allen, 20 Aug 2026
We are very thankful for your thorough and constructive review. Addressing your comments about how our simulation design through time-slices may affect some of the slower-varying land-surface variables is very helpful to show for us and for the reader. We also think that including more reference datasets made this work more robust. Please see our responses to each of your comments in the attached PDF.
-
AC2: 'Reply on RC2', Jacob Stuivenvolt-Allen, 06 Jul 2026
-
RC3: 'Comment on egusphere-2026-1638', Anonymous Referee #3, 10 Jul 2026
Review of: The North American CORDEX-CMIP6 WRF evaluation run: comparing historical simulations from 25 km to convection-permitting scales.
Jacob Stuivenvolt-Allen et al., 2026. Preprint egusphere-2026-1638
General comments
The manuscript presents a comparative analysis of an ensemble of the NA-CORDEX-CMIP6 regional model, NA-CORDEX-CMIP5, and CONUS404. It provides valuable intercomparison information among the three datasets, as well as comparisons with other sources of information for the representation of precipitation, temperature, snow water equivalent, moisture flux, extratropical cyclones, and mesoscale convective systems, among other variables. The information presented is valuable for both the North American and the broader scientific community. However, several aspects should be clarified before publication, particularly the following key points:
- The overall experimental design is somewhat confusing, as methodological details are introduced progressively alongside the presentation of the results. I therefore suggest a complete restructuring of the Methods section so that all methodological aspects are presented before moving directly to the Results section, avoiding the need to explain methodological procedures while presenting the results.
- Although this is partly a matter of scientific writing style, presenting the Results together with the Discussion makes the manuscript difficult to follow. In several instances, a topic is introduced for the first time within the Results section to establish the current state of the art, followed by the presentation of the results, and then by their discussion, making the manuscript difficult to read in a linear fashion. I strongly recommend separating the Discussion (interpretation and comparison with previous literature) from the Results (quantitative findings).
- In general, the manuscript should be more quantitative in describing the results. Although the maps present numerical information, the text provides very few numerical values and instead relies heavily on qualitative adjectives to describe model performance or differences.
- Several figures are truncated over North America, particularly outside the CONUS region.
- Although the dataset is presented as having potential for ensemble applications, no analysis exploiting this capability is shown, suggesting that only the ensemble mean is presented.
- I strongly recommend performing statistical significance tests to evaluate whether the similarities and/or differences found for each analyzed variable are statistically significant.
Specific comments are provided below.
Abstract
Please note that it is not appropriate to refer to "biases" when the comparison is made against other models that are themselves subject to uncertainty.
L18. Correct the parenthesis: CORDEX)(Giorgi should be CORDEX; Giorgi et al.
At the end of the Introduction the authors state:
"Although these simulations employ different physics configurations and spatial resolutions, they are otherwise very similar, and allow us to assess the quality of the new NAC6 simulations with minimal uncertainty due to structural differences between modeling systems"
Please justify what is meant by "minimal uncertainty." It would be useful to specify what the structural differences actually are and how this uncertainty can be quantified.
Methods
L63. Please provide references for the following statement:
"Spectral nudging of temperature, winds, and geopotential height is applied above the boundary layer for scales >1000 km to maintain synoptic consistency while resolving mesoscale processes"
Since this section describes the methodology, please indicate which metrics and which components of temperature and precipitation were analyzed.
L71.
"The resulting test simulation with the smallest annual bias in temperature and precipitation was retained, and the next physics scheme was evaluated in subsequent tests".
From L65 to L70, it is not clear whether these correspond to the results of (Bukovsky and Karoly, 2009) or to results obtained in the present study. If the latter, the tested physics schemes and the resulting errors should be reported.
Please provide references for the paragraph beginning at L75.
L85. Please indicate the data sources used for the prescribed variables and clarify whether these vary over time.
L88–91. A comparison with ERA5 could also be included to evaluate performance at the continental scale.
L99–102. This material belongs in the Methods section. Also note that it is not appropriate to refer to "biases"; "differences" would be more appropriate.
L105. The authors could consider applying an elevation correction based on a standard atmosphere to evaluate this effect.
Section 3.1
P116. Please provide a more quantitative description of the results.
Section 3.2
Additional regions of North America should also be evaluated, given that the dataset is presented for a domain larger than CONUS.
IMERG should be described in the Methods section.
L180. This information should also be moved to the Methods section.
L185. Please explore the effect of an elevation correction.
Section 3.3
Although daily differences are computed, it is also important to calculate accumulated and percentage climatological differences. For example, a difference of 0.5 mm day⁻¹ does not necessarily correspond to 182 mm year⁻¹, since precipitation does not occur every day.
L195. Please cite the reference supporting the statement that C404 is closer to the observations.
L205. Please be more quantitative.
The comparison with SNOTEL and the evaluation metrics should be described in the Methods section.
L216. Please correct the citation reference error.
Please quantify expressions such as "Too short", "too early", "Notable elongation", etc.
Section 3.4
L236–239. The narrative is somewhat fragmented.
L259. Add reference to TC category as defined by the US National Hurricane Center.
I recommend separating this section into two subsections, one devoted to tropical cyclones (TC) and the other to mesoscale convective systems (MCS).
Equations 2 and 3 should be presented in the Methods section, with all variables and terms properly defined.
Conclusions
It is not clear which dataset the following sentence refers to. The paragraph begins discussing NAC6, but the phrase "no uniformly superior dataset" creates ambiguity.
"However, for precipitation, the comparison is more nuanced: NAC6 exhibits a less severe dry bias in parts of the western US, and relative skill varies by region and season with no uniformly superior dataset".
Figures
Overall, it is difficult to follow the narrative of the manuscript because the figures are located far from the corresponding text. Some of the comments below may already be addressed in the intervening paragraphs; nevertheless, I include the following observations. In general, I recommend formatting the figures to occupy the full page width, as considerable page space is currently unused.
Figures 1, 2, 3, 4, 5, and 7. The NAC6 domain is cropped at both the northern and southern boundaries.
Figure 1. The purpose of panel (c) is not clear. If it is used later in the manuscript, this should be explicitly stated in the figure caption.
Figures 2, 3, and 4. Please use "differences" instead of "biases," since ERA5-Land is also a dataset subject to uncertainty.
Figure 5. Consider using IMERG as the first column, while the remaining columns show the differences between each model and IMERG. This would facilitate interpretation of the results, while the individual model fields could be moved to a supplementary figure.
Figure 6. The analysis region should be indicated in Figure 1, and the caption of Figure 6 should explicitly refer to this spatial domain defined in Figure 1.
Figure 7. Similar comment as for the previous figure. Consider showing model differences while displaying only the ERA5 magnitude.
Figure 8. The analysis region should be indicated in Figure 1, and the caption of Figure 8 should explicitly refer to this spatial domain defined in Figure 1.
Figure 9. Consider adding a panel showing the reference SWE climatology.
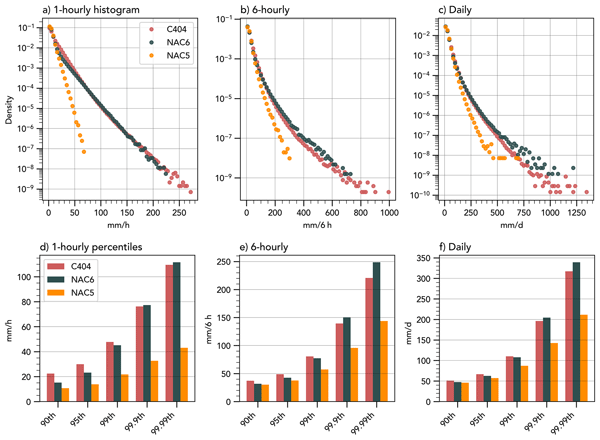
Figure 10. Does this refer to monthly maximum hourly precipitation? Given the units, it would also be interesting to repeat the analysis for 6-hour, 12-hour, and 24-hour maxima, for example by adding new rows to this figure.
Figure 11. Consider using satellite products as the reference, allowing all model differences to be calculated relative to a single external dataset instead of requiring visual comparison among the models.
Figure 12. Same comment as for Figures 6 and 8. Consider performing statistical tests between samples to assess the statistical significance of differences between the datasets.
Figure 13. This is a very interesting analysis that deserves a more in-depth discussion in the manuscript. A similar analysis could also be performed for additional pressure levels and for IVT as complementary diagnostics.
Citation: https://doi.org/10.5194/egusphere-2026-1638-RC3 -
AC5: 'Reply on RC3', Jacob Stuivenvolt-Allen, 20 Aug 2026
Thank you for your thorough and constructive review! The push for more quantitative rigor throughout the manuscript, in both figures and text, has substantially improved the paper and helped clarify the extent to which the updates from NAC5 to NAC6 actually matter. Please see our responses to each comment in the attached PDF.
Peer review completion


Interactive discussion
Status: closed
-
CC1: 'Comment on egusphere-2026-1638', Silvina Solman, 19 Jun 2026
Publisher’s note: this comment is a copy of RC1 and its content was therefore removed on 29 June 2026.
Citation: https://doi.org/10.5194/egusphere-2026-1638-CC1 -
CC2: 'Reply on CC1', Silvina Solman, 19 Jun 2026
Publisher’s note: this comment is a copy of RC1 and its content was therefore removed on 29 June 2026.
Citation: https://doi.org/10.5194/egusphere-2026-1638-CC2 -
AC1: 'Reply on CC1', Jacob Stuivenvolt-Allen, 06 Jul 2026
Hello Dr. Solman,
Thank you for a thorough and constructive review – we really appreciate it. In particular, we think clarifying the objectives of this work and adding more comparisons with reanalysis/observational datasets will improve the manuscript. Please see our initial thoughts at how to address your general concerns with this work. We plan to provide a response to each comment in short time.
On overall objectives (General Comment 1):
We will clarify the manuscript's objectives in the introduction and conclusions. The evaluation focuses on four areas: mean climatological biases in temperature and precipitation, diurnal precipitation processes, seasonal hydroclimate (snow and the North American monsoon), and extreme events (tropical cyclones and a mesoscale convective system case study).On restructuring case studies vs. climatology (General Comment 2):
We will retain organization by phenomenon rather than by method. Tropical cyclones will be treated in a single section covering both the Hurricane Ivan case study and the climatological analysis of Gulf TCs, and the MCS case study will remain separate. We will add clear subheadings and transition sentences marking the shift from case study to climatology within the TC section, so the distinction in approach is explicit rather than implied.On harmonizing the snow section's style (General Comment 3):
We will revise the snow discussion to match the tone and structure of the preceding sections.On reference data for case studies (General Comment 5; overlaps with Reviewer 2 point 2):
We will add ERA5 as a reference comparison for the case-study analysis, and note where ERA5's coarser resolution limits its use as ground truth for the TC case study.On Figure 10 (General Comment 4):
Confirmed as an error: the SNOTEL/HUC-8 seasonal SWE figure discussed in the text does not currently exist as a distinct labeled figure, as this figure was moved into the supplement. We will correct the figure references to relate to that figure (Figure S4).Citation: https://doi.org/10.5194/egusphere-2026-1638-AC1 -
AC3: 'Reply on CC1', Jacob Stuivenvolt-Allen, 20 Aug 2026
Thank you Dr. Solman for your constructive review of this work. In particular, the suggested inclusion of more reanalysis-based reference data is useful context for the reader, and we think the manuscript has benefitted a lot from the other suggestions you’ve made. Please see line-by-line comments below and thank you for your time! Please see our responses to each of your comments, questions and concerns in the attached pdf.
-
CC2: 'Reply on CC1', Silvina Solman, 19 Jun 2026
-
RC1: 'Comment on egusphere-2026-1638', Silvina Solman, 19 Jun 2026
The manuscript assesses the improvements in the most updated WRF evaluation simulation for the CORDEX-NA domain compared with a previous generation simulation. It also compares the simulated results against a convection-permitting simulation available for North America. The analysis is valuable and needed, as it represents the basis for identifying strengths and limitations of the most updated WRF simulation for the NA-CORDEX domain. The manuscript is very well written and conveys a clear message. However, in some passages the narrative seems to be somewhat disorganized and disconnected. This is particularly evident when analyzing snow features and extreme precipitation. I would recommend separating the case study analysis from the climatological assessment given the different approach followed.
There is a number of general and detailed comments, listed below, that should be considered to improve the overall readability and quality of the manuscript, before publication.
General comments
- The overall objectives of the manuscript are too vague. It is mentioned that the authors pursue assessing improvements from the corresponding previous-generation simulation. On what? What phenomena or climate feature are being assessed? I recommend clarifying on what features the analysis is focused.
- I recommend restructuring the analysis and differentiate the climatological analysis from the case studies analysis. The content starting in page 8 line 240 should be moved to a new section dedicated to case studies.
- The discussion on the representation of snow seems to be written in a very different style as compared with previous sections. Please harmonize the writing style if possible.
- Revise the discussion around Figure 10. There is a Figure 10 in the manuscript but it does not contain what is discussed in the paragraph referring to it. Moreover, one figure seems to be lacking (snow features).
- The analysis focused on on case studies (TC and MCS) should include some reference to compare with. ERA5 may be too coarse but at least may provide some overall idea of the features evaluated. Particularly for the MCS, since the discussion is around the synoptic environment features, the comparison against ERA5 should be presented.
Detailed comments
- Page 2 lines 35-45: Are the physical parameterizations mentioned the actual selection used for the NA-CORDEX WRF simulation being assessed? This is not clear and needs to be clarified. As it is written, it seems that the only improvements in the WRF model are related with the physics schemes mentioned in the paragraph (which is certainly not the case). I recommend to clarify that the schemes highlighted are those used in the new simulation.
- Page 2 line 44: Who are you referring to as “our contribution” to NA-CORDEX? Who are “our”? Please clarify.
- Page 3 line 57: Add CORDEX domain after North America.
- Page 3 lines 70-73: It would be recommendable to consider that the sensitivity tests for identifying the optimal physics selection may not end up in the same choice if the tests were done with different combinations of physical parameterizations, given the strong interdependencies among physical processes and how these interdependences are treated by different combinations of parameterizations.
- Page 3 lines 75-79: The simulated period should be clearly indicated in this paragraph.
- Figure 1 is not referenced in the text.
- Page 5 – lines 142-143: Should “from July 1 through August 31” be “from June 1 through Augus 31”, to be consistent with Fig. 5 legend?
- Page 6 – line 157: NAM region has not been defined. Please clarify.
- Page 6 – line 163: Are you referring to Figure 5d for IMERGE? If this is the case, replace Fig. 5d-g by Fig. 5d and refer to Fig. 5e-g when referring to the WRF simulations.
- Page 6 – lines 163-164: I don’t see IMERGE rainfall rate being systematically smaller than WRF in Figure 5d. Can you identify where this feature is apparent?
- Page 7 - lines 173-178: Revise. It seems that some parentheses are lacking.
- Figure 7: Revise figure legend and panel titles.
- Page 8 - lines 201-205: This paragraph seems to be disconnected from the narrative. I recommend inverting the order of this and the following paragraph to ease readiness.
- Page 8 – lines 209-210: The information on how Figure 9 is organized is already in the figure legend. It is not necessary to repeat it in the text. Please remove this line.
- Page 8 - lines 214-215: Why is the seasonality of the snow cycle not possible to be evaluated against the University of Arizona SWE data? Please clarify.
- Page 8: there is no analysis based on Figure 10, but what is the expected result. Figure 10 only displays the results from the simulations with no observation. Please provide an analysis of that figure, otherwise, it should be removed.
- Page 8 – line 216: Please revise the reference to the Figure. Figure ??a is indicated.
- Page 8 –lines 216-223: Revise this paragraph. No figure is displayed related with what is discussed here. There is a reference to Figure 10b/10c-e but Figure 10 only shows the histogram of monthly precipitation. Check carefully the consistency between the text and the figures before submitting the manuscript, otherwise it is impossible to provide a comment on the analysis.
- Page 8: last paragraph: Figure 10 is referenced but referring to a different content. Please revise the list of figures included in the manuscript.
- Page 8 – Page 9 - lines 225-239: The analysis of extreme precipitation lacks a more in-depth discussion. It is written in a very disorganized way. Please re write.
- Page 9 – lines 236-237: Where is the observed histogram displayed to state that the C404 dataset closely matches station-based observational estimates? The observational-based results should be included in this figure. Otherwise, make it clear that you are just referring to referenced literature.
- Page 9 – lines 247-255: To what extent reanalysis data (ERA5) can be used to compare against simulations? The discussion focus on highlighting that the C404 results are comparable with NAC6 results, but are these realistic? Consider including ERA5 reanalysis results just to have a reference to compare with.
- Figure S4 is not referenced in the text.
Citation: https://doi.org/10.5194/egusphere-2026-1638-RC1 -
AC6: 'Reply on RC1', Jacob Stuivenvolt-Allen, 20 Aug 2026
Thank you for this review. As this review is an exact duplicate of the other provided by Dr. Solman, we have attached our reviewer responses to the other discussion.
Citation: https://doi.org/10.5194/egusphere-2026-1638-AC6
-
RC2: 'Comment on egusphere-2026-1638', Anonymous Referee #2, 02 Jul 2026
In their study, Stuivenvolt-Allen et al. present an evaluation of a historical simulation with WRF (NAC6), as part of the North American CORDEX-CMIP suite simulations. The evaluation is performed comparing with several observation based data sets (GPM-IMERG, SNOTEL, among others), and with a convective-allowing simulation (C404). The authors find that the new simulation (NAC6, forced by ERA5) exhibits several improvements with respect to a previous analogous simulation (NAC5 forced by ERA-Interim), especially in the representation of the diurnal cycle of precipitation, precipitation extremes, and snow.
The manuscript is clear and well written. The analysis and findings are of interest to a broad community. However, some improvements could be made before publication, as suggested in the comments below. I suggest Major Revisions of this manuscript in its current state. I hope that the comments below would be helpful to the authors.
General comments:
-----------------A. About biases.
Regarding the comparison to ERA5-Land (Figs. 2, 3, 4), it would be interesting to also see a comparison to other observation based data sets, like those from CRU, CHIRPS, CHIRTS, or similar. The authors could also comment on why it is better to compare to ERA5-Land instead of those observation based gridded data sets. Whereas temperature in ERA5-Land benefits from direct data assimilation, precipitation is a product from the model (as the authors write in the text), with some biases.
In general, the authors make a description of the biases, with some references to other papers where specific processes/mechanisms have been identified to explain some of the biases. However, the authors can include some comments or hypothesis about part of the biases identified in their study (see specific comments below).
B. About "Extreme events" (section 3.4)
Section 3.4 about extreme events is interesting: the authors compare a set of specific weather events (Figure 11 and 13), and some statistics for TCs (Figure 12). According to the authors, these comparisons are possible since all model simulations (C404, NAC5 and NAC6) use spectral nudging by reanalyses fields. However, for some of the comparisons it is important to bear in mind that two different reanalyses are used (ERA5 and ERA-Interim), with different intrinsic resolutions (equivalent grid-spacing close to 0.25° and 0.75°, respectively). In this sense, one could say, for example, that part of the improvement in the simulation of a TC (NAC6 vs. NAC5) could be associated with a higher resolution used to produce ERA5, and not mainly to the higher resolution of NAC6.
Furthermore, the representation of features related with some "Extreme events" (e.g. the TC features in Figs. 11 and 12) could depend on the resolution of the ESMs or GCMs used for the planned NA-CORDEX-CMIP6 simulation suite (coarser than ERA5). In this case, it could happen that the simulated TCs with the NAC6 configuration could be of the same type as the NAC5 structure and statistics in Figs 11 and 12. In this context, the analysis in section 3.4 might not be representative of what would be expected in the NA-CORDEX-CMIP6 simulation suite.
I suggest the authors take these points into consideration in the analysis of section 3.4, and in the conclusions (e.g. lines 299-302).
C. About other capabilities and skills: interannual variability.
While sections 3.1-3.3 are devoted to the mean state, and mean seasonal and diurnal patterns, section 3.4 is devoted to weather systems. To complement these analyses, it would be interesting to see the mean states and/or their biases associated with interannual variations in the boundary conditions, e.g. associated with ENSO phases. The common time period 1980-2010, and the use of reanalysis data as forcing (along with spectral nudging) would allow to explore the statistics of temperature and precipitation during El Niño vs. La Niña. Or comparing composites derived from particularly cold vs. particularly warm SSTs in nearby regions. This kind of analysis could provide statistics for the mean states or the mean biases associated with different climate regimes, which could be relevant for the interpretation of the planned NA-CORDEX-CMIP6 simulation suite. To avoid going much further beyond the scope of the present study, a relatively simple analysis of composites (El Niño vs. La Niña) would suffice.
Specific Comments:
------------------L52. Please provide one or two examples of the similarity among simulations: model domain? time period?
L58. This seems like a good place to refer the reader to Figure 1.
L64. Table 1: please provide some details about the physics in Noah-MP, e.g. dynamic vegetation, groundwater scheme, depth of roots, etc.
L73-77. From the text, I assume no restart files form WRF are used, but a new simulation is started for each time slice: is this correct? Please provide a justification as to why no restart files are used, what would be the consequences for slow evolution fields (e.g. soil moisture, snow cover, and those associated with vegetation dynamics), and would be the potential differences in this sense with respecto to C404 (continuous simulation?).
L103-109 The C404 warm biases over complex terrain (e.g. western U.S.) could be more directly associated with lower valleys in the 4 km representation of topography, in comparison with the 9 km representation of ERA5-Land. The same reasoning would not directly apply to the comparison between NAC6 and ERA5-land. Could you please expand on these difference?
L109-110. Do you have any hypothesis to explain the cold biases throughout central and eastern North America?
L131. Could this be associated with too much cloudiness at night?
L159-160. Any hypothesis as to why NAC6 exhibits a better picture of nocturnal precipitation, compared to NAC5?
L171. From figures 6c and 6d it is not too obvious that NAC6 exhibits a better eastward propagation than NAC5. Perhaps a version of these figures, in terms of fractional precipitation (w.r.t. to total daily precipitation) would help to better see the eastward propagation in NAC6.
L181. Fig. 7a: I guess this refers to ERA5-Land data. Caption of the figure also needs corrections.
L216. Fix the number of the figure: "Figure ??a" --> "Figure S4a" ?
L221. Change to "He et al. (2021)"
L212-220. The authors talk about comparison with SNOTEL data, and to figures 10c-e. However, in the current version of the PDF of the main text, Figure 10 only shows one graph ("CONUS maximum precipitation histogram"), with no reference to SNOTEL data. It seems that the authors are referring to Figure S4.
L226. Instead of "all datasets use spectral nudging", I would say "all simulations use spectral nudging".
L247. Instead of "solar flux", I guess you are talking about "shortwave radiation". It would be better to visualize OLR, which is related with deeper clouds and precipitation.
L240-255. The results in figure 11 are interesting. Take into account, that forcing for NAC5 (ERA-Interim) is coarser than for C404 and NAC6 (ERA5), which probably has an effect in the resulting structures (e.g. in the gradients in the forcing fields) and features via the spectral nudging (e.g. compare the TC in ERA-Interim vs. ERA5).
L261-265. Results from figure 12 are very interesting. Are the differences between means (medians) statistically significant?
L275. Instead of "all datasets use spectral nudging", I would say "all simulations use spectral nudging".
Citation: https://doi.org/10.5194/egusphere-2026-1638-RC2 -
AC2: 'Reply on RC2', Jacob Stuivenvolt-Allen, 06 Jul 2026
Dear reviewer,
Thank you for your review and the constructive comments about this work. We think the manuscript will benefit a lot from: 1) having more comparisons of biases with different observational datasets and 2) showing some statistics on how our simulations represent interannual climate variability. Please see our initial thoughts on how to address your concerns below – we will provide a point-by-point response as soon as possible.
On additional observational datasets for bias comparison (General Comment A):
We will add supplementary comparisons against other observation based gridded datasets relevant to each variable (e.g., IMERG, CHIRPS for precipitation), and comment on why ERA5-Land was chosen as the primary reference, noting that its temperature benefits from direct assimilation while its precipitation is model derived.On reanalysis resolution differences (General Comment B):
We will clarify that NAC5 and NAC6 are driven by different reanalyses (ERA-Interim, approximately 0.75°, versus ERA5, approximately 0.25°), and that improvements from NAC5 to NAC6 partly reflect this difference in driving data resolution, not solely the WRF model resolution increase. We will note this explicitly in the TC and MCS results, and state in the conclusions that this caveats how directly these results extend to the planned NA-CORDEX-CMIP6 ensemble, which will be driven by coarser GCM output rather than ERA5.On interannual variability and ENSO composites (General Comment C):
We will add a simple composite analysis comparing El Niño and La Niña periods (or warm versus cold SST regimes) for temperature and precipitation over 1980-2010, to complement the existing mean state and case study analyses. We will keep this addition concise to stay within the scope of the current manuscript.Citation: https://doi.org/10.5194/egusphere-2026-1638-AC2 -
AC4: 'Reply on RC2', Jacob Stuivenvolt-Allen, 20 Aug 2026
We are very thankful for your thorough and constructive review. Addressing your comments about how our simulation design through time-slices may affect some of the slower-varying land-surface variables is very helpful to show for us and for the reader. We also think that including more reference datasets made this work more robust. Please see our responses to each of your comments in the attached PDF.
-
AC2: 'Reply on RC2', Jacob Stuivenvolt-Allen, 06 Jul 2026
-
RC3: 'Comment on egusphere-2026-1638', Anonymous Referee #3, 10 Jul 2026
Review of: The North American CORDEX-CMIP6 WRF evaluation run: comparing historical simulations from 25 km to convection-permitting scales.
Jacob Stuivenvolt-Allen et al., 2026. Preprint egusphere-2026-1638
General comments
The manuscript presents a comparative analysis of an ensemble of the NA-CORDEX-CMIP6 regional model, NA-CORDEX-CMIP5, and CONUS404. It provides valuable intercomparison information among the three datasets, as well as comparisons with other sources of information for the representation of precipitation, temperature, snow water equivalent, moisture flux, extratropical cyclones, and mesoscale convective systems, among other variables. The information presented is valuable for both the North American and the broader scientific community. However, several aspects should be clarified before publication, particularly the following key points:
- The overall experimental design is somewhat confusing, as methodological details are introduced progressively alongside the presentation of the results. I therefore suggest a complete restructuring of the Methods section so that all methodological aspects are presented before moving directly to the Results section, avoiding the need to explain methodological procedures while presenting the results.
- Although this is partly a matter of scientific writing style, presenting the Results together with the Discussion makes the manuscript difficult to follow. In several instances, a topic is introduced for the first time within the Results section to establish the current state of the art, followed by the presentation of the results, and then by their discussion, making the manuscript difficult to read in a linear fashion. I strongly recommend separating the Discussion (interpretation and comparison with previous literature) from the Results (quantitative findings).
- In general, the manuscript should be more quantitative in describing the results. Although the maps present numerical information, the text provides very few numerical values and instead relies heavily on qualitative adjectives to describe model performance or differences.
- Several figures are truncated over North America, particularly outside the CONUS region.
- Although the dataset is presented as having potential for ensemble applications, no analysis exploiting this capability is shown, suggesting that only the ensemble mean is presented.
- I strongly recommend performing statistical significance tests to evaluate whether the similarities and/or differences found for each analyzed variable are statistically significant.
Specific comments are provided below.
Abstract
Please note that it is not appropriate to refer to "biases" when the comparison is made against other models that are themselves subject to uncertainty.
L18. Correct the parenthesis: CORDEX)(Giorgi should be CORDEX; Giorgi et al.
At the end of the Introduction the authors state:
"Although these simulations employ different physics configurations and spatial resolutions, they are otherwise very similar, and allow us to assess the quality of the new NAC6 simulations with minimal uncertainty due to structural differences between modeling systems"
Please justify what is meant by "minimal uncertainty." It would be useful to specify what the structural differences actually are and how this uncertainty can be quantified.
Methods
L63. Please provide references for the following statement:
"Spectral nudging of temperature, winds, and geopotential height is applied above the boundary layer for scales >1000 km to maintain synoptic consistency while resolving mesoscale processes"
Since this section describes the methodology, please indicate which metrics and which components of temperature and precipitation were analyzed.
L71.
"The resulting test simulation with the smallest annual bias in temperature and precipitation was retained, and the next physics scheme was evaluated in subsequent tests".
From L65 to L70, it is not clear whether these correspond to the results of (Bukovsky and Karoly, 2009) or to results obtained in the present study. If the latter, the tested physics schemes and the resulting errors should be reported.
Please provide references for the paragraph beginning at L75.
L85. Please indicate the data sources used for the prescribed variables and clarify whether these vary over time.
L88–91. A comparison with ERA5 could also be included to evaluate performance at the continental scale.
L99–102. This material belongs in the Methods section. Also note that it is not appropriate to refer to "biases"; "differences" would be more appropriate.
L105. The authors could consider applying an elevation correction based on a standard atmosphere to evaluate this effect.
Section 3.1
P116. Please provide a more quantitative description of the results.
Section 3.2
Additional regions of North America should also be evaluated, given that the dataset is presented for a domain larger than CONUS.
IMERG should be described in the Methods section.
L180. This information should also be moved to the Methods section.
L185. Please explore the effect of an elevation correction.
Section 3.3
Although daily differences are computed, it is also important to calculate accumulated and percentage climatological differences. For example, a difference of 0.5 mm day⁻¹ does not necessarily correspond to 182 mm year⁻¹, since precipitation does not occur every day.
L195. Please cite the reference supporting the statement that C404 is closer to the observations.
L205. Please be more quantitative.
The comparison with SNOTEL and the evaluation metrics should be described in the Methods section.
L216. Please correct the citation reference error.
Please quantify expressions such as "Too short", "too early", "Notable elongation", etc.
Section 3.4
L236–239. The narrative is somewhat fragmented.
L259. Add reference to TC category as defined by the US National Hurricane Center.
I recommend separating this section into two subsections, one devoted to tropical cyclones (TC) and the other to mesoscale convective systems (MCS).
Equations 2 and 3 should be presented in the Methods section, with all variables and terms properly defined.
Conclusions
It is not clear which dataset the following sentence refers to. The paragraph begins discussing NAC6, but the phrase "no uniformly superior dataset" creates ambiguity.
"However, for precipitation, the comparison is more nuanced: NAC6 exhibits a less severe dry bias in parts of the western US, and relative skill varies by region and season with no uniformly superior dataset".
Figures
Overall, it is difficult to follow the narrative of the manuscript because the figures are located far from the corresponding text. Some of the comments below may already be addressed in the intervening paragraphs; nevertheless, I include the following observations. In general, I recommend formatting the figures to occupy the full page width, as considerable page space is currently unused.
Figures 1, 2, 3, 4, 5, and 7. The NAC6 domain is cropped at both the northern and southern boundaries.
Figure 1. The purpose of panel (c) is not clear. If it is used later in the manuscript, this should be explicitly stated in the figure caption.
Figures 2, 3, and 4. Please use "differences" instead of "biases," since ERA5-Land is also a dataset subject to uncertainty.
Figure 5. Consider using IMERG as the first column, while the remaining columns show the differences between each model and IMERG. This would facilitate interpretation of the results, while the individual model fields could be moved to a supplementary figure.
Figure 6. The analysis region should be indicated in Figure 1, and the caption of Figure 6 should explicitly refer to this spatial domain defined in Figure 1.
Figure 7. Similar comment as for the previous figure. Consider showing model differences while displaying only the ERA5 magnitude.
Figure 8. The analysis region should be indicated in Figure 1, and the caption of Figure 8 should explicitly refer to this spatial domain defined in Figure 1.
Figure 9. Consider adding a panel showing the reference SWE climatology.
Figure 10. Does this refer to monthly maximum hourly precipitation? Given the units, it would also be interesting to repeat the analysis for 6-hour, 12-hour, and 24-hour maxima, for example by adding new rows to this figure.
Figure 11. Consider using satellite products as the reference, allowing all model differences to be calculated relative to a single external dataset instead of requiring visual comparison among the models.
Figure 12. Same comment as for Figures 6 and 8. Consider performing statistical tests between samples to assess the statistical significance of differences between the datasets.
Figure 13. This is a very interesting analysis that deserves a more in-depth discussion in the manuscript. A similar analysis could also be performed for additional pressure levels and for IVT as complementary diagnostics.
Citation: https://doi.org/10.5194/egusphere-2026-1638-RC3 -
AC5: 'Reply on RC3', Jacob Stuivenvolt-Allen, 20 Aug 2026
Thank you for your thorough and constructive review! The push for more quantitative rigor throughout the manuscript, in both figures and text, has substantially improved the paper and helped clarify the extent to which the updates from NAC5 to NAC6 actually matter. Please see our responses to each comment in the attached PDF.
Peer review completion
Journal article(s) based on this preprint
This study presents a new 12 km CORDEX (Coordinated Regional Downscaling Experiment )-CMIP6 (Coupled Model Intercomparison Project) WRF (Weather Research and Forecasting) simulation for North America, compared against an earlier 25 km CMIP5 version and a 4 km convection-permitting simulation. The updated run reduces temperature and precipitation biases, improves precipitation timing, and better captures tropical cyclone intensity. Extreme precipitation at 12 km closely matches convection-permitting results, offering a practical resolution for regional climate assessment.
Viewed
| HTML | XML | Total | Supplement | BibTeX | EndNote | |
|---|---|---|---|---|---|---|
| 438 | 232 | 52 | 722 | 112 | 36 | 36 |
- HTML: 438
- PDF: 232
- XML: 52
- Total: 722
- Supplement: 112
- BibTeX: 36
- EndNote: 36
Viewed (geographical distribution)
| Country | # | Views | % |
|---|
| Total: | 0 |
| HTML: | 0 |
| PDF: | 0 |
| XML: | 0 |
- 1

Trude Eidhammer
Rachel McCrary
Melissa Bukovsky
Stefan Rahimi
Hsin-I. Chang
Seth McGinnis
The requested preprint has a corresponding peer-reviewed final revised paper. You are encouraged to refer to the final revised version.
- Preprint
(26473 KB) - Metadata XML
-
Supplement
(12237 KB) - BibTeX
- EndNote
- Final revised paper