
the Creative Commons Attribution 4.0 License.
the Creative Commons Attribution 4.0 License.
 | 27 Mar 2026
Subseasonal and spatial variability of biomass burning aerosol radiative properties observed over the Southeast Atlantic during ORACLES 2016–2018
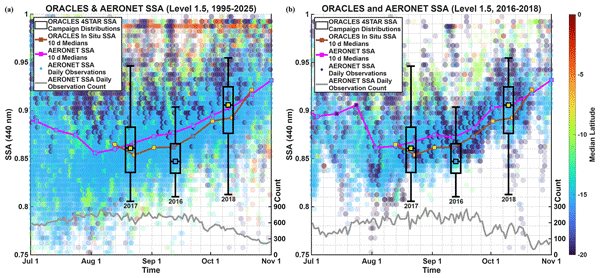
Abstract. During 2016–2018, NASA conducted the ORACLES (ObseRvations of Aerosols above CLouds and their intEractionS) airborne field campaigns to study aerosol-cloud-radiation interactions with the stratocumulus cloud deck over the Southeast Atlantic. ORACLES employed 4STAR (Spectrometer for Sky-Scanning, Sun-Tracking Atmospheric Research) to measure direct solar irradiances and diffuse sky radiances of free-tropospheric Biomass Burning Aerosols (BBA). Aerosol radiative properties, including Single Scattering Albedo (SSA), Aerosol Optical Depth (AOD), Aerosol Absorption Optical Depth (AAOD), Extinction Ångström Exponent (EAE), Absorption Ångström Exponent (AAE), and complex refractive indices are retrieved via an adapted AERONET inversion code. Changes in SSA indicate increased scattering as the biomass burning season progresses, which we attribute to an aerosol brightening from compositional changes, rather than a change in aerosol type, with an apparent lack of Brown Carbon throughout the season. A collection of 31 AERONET (AErosol RObotic NETwork) sun/sky photometer stations have operated in Southern Africa for over thirty years (1995–2025), creating a complete aerosol climatology for the first time, which can be compared with SSA and AOD from ORACLES observations. The spatial distributions of in situ SSA are also investigated by latitude, longitude, and altitude. Westward gradual increases and sharper decreases in SSA are attributed to late-transport aging processes identified by previous studies. These processes start further eastward in October, in conjunction with the southeastward shift in source fires. Collectively, ORACLES 4STAR retrievals and in situ measurements have identified subseasonal and spatial trends in SSA over the Southeast Atlantic that complement the Southern African AERONET climatology.
-
Notice on discussion status
The requested preprint has a corresponding peer-reviewed final revised paper. You are encouraged to refer to the final revised version.
-
Preprint
(2845 KB)
-
The requested preprint has a corresponding peer-reviewed final revised paper. You are encouraged to refer to the final revised version.
- Preprint
(2845 KB) - Metadata XML
- BibTeX
- EndNote
- Final revised paper


Journal article(s) based on this preprint
Interactive discussion
Status: closed
- RC1: 'Comment on egusphere-2026-1418', Anonymous Referee #1, 25 Apr 2026
-
RC2: 'Comment on egusphere-2026-1418', Anonymous Referee #2, 01 May 2026
The manuscript documents the subseasonal and spatial variability of biomass burning (BB) aerosols properties over the Southeast Atlantic (SEA) region during the NASA ORACLES campaigns (2016-2018). It combines airborne 4STAR and long-term AERONET measurements of single scattering albedo (SSA), aerosol optical depth (AOD), and absorption aerosol optical depth (AAOD). The results investigate the distinction between BC and BrC during the biomass burning season.
My recommendation is that the manuscript can be published after major revisions. The dataset and the manuscript concept are strong, but several central methodological choices are not yet documented or stress-tested enough to support some of the stronger interpretations.
Major comments
- While the manuscript effectively identifies subseasonal and spatial trends, it lacks atmospheric trajectory modeling (e.g., HYSPLIT or FLEXPART) to confirm the specific origins of the aerosols. I suggest including an analysis of back-trajectories for the study periods, this would provide vital context for the transport pathways, provide a more robust validation of the proposed source fire shifts, and strengthen the manuscript.
- The study covers three months (August–October) over a three-year period. I recommend adding a discussion on how interannual differences in meteorological conditions might have affected the finding.
- Lines 255–258: The authors attribute regional differences in SSA to a shift in source fires toward Botswana, Zimbabwe, and Mozambique, referencing trajectory analyses from Dobracki et al. (2023). However, Dobracki et al. primarily analyzed data from 2016. Given that this manuscript includes ORACLES data from 2017 and 2018, it is unclear whether this source shift is consistent across the entire study period. I recommend that the authors either demonstrate that their own data (2017–2018) exhibits similar transport patterns or explicitly discuss the interannual consistency of this source fire shift.
- To better support the claims regarding the aerosol brightening process and the distinction between BrC and BC, I suggest adding a scatter plot showing the relationship between AAE and SSA (or another identification space). This would allow the reader to see if the aerosol population shifts from a cluster associated with BrC absorption toward a less absorbing regime over time.
- Lines 427–429: The authors note that expanding the 4STAR dataset into the UV spectrum using the hyperspectral GRASP code could better isolate BrC absorption. Given that the manuscript’s primary focus is the aerosol brightening process and the distinction between BrC and BC, this would be a great addition. I recommend that the authors either incorporate these results or provide a more detailed justification for why this methodology was not applied in the conclusions.
Minor comments
- Line 19: First use of acronym “AERONET” is here so add "AErosol RObotic NETwork".
- Lines 112-113: SSA, AOD, AAAOD, EAE, AAE are already stated in the introduction so you can use freely the acronym.
- Line 146: First use of acronym “PSAP”, so you need to define the acronym.
- Line 146: You mention that both PSAP & Neph measure in the same wavelengths, consider correcting the table caption (Since in the table you mention a difference of 20 and 40 nm between two instruments).
Citation: https://doi.org/10.5194/egusphere-2026-1418-RC2 -
AC1: 'Reply to RC1 and RC2', Logan Mitchell, 19 Jun 2026
Thank you both for your reviews. We have used your comments to improve our manuscript, including the creation of a supplement (attached). Specific responses to the major and minor comments of RC1 and RC2 are below:
RC1:
Major Comments:
1. In alignment with your comment and that of RC2, we have increased discussion (Lines 62-70) regarding the interannual variability of Southern African aerosol emissions and meteorological conditions over the Southeast Atlantic, with literature suggesting that it is small enough to not significantly affect our results.
Lines 62-70: There is remarkably little interannual variability in Southern African fires due to the consistency of agricultural burning practices in the region (van der Werf et al., 2010; Redemann et al., 2021). Using the 18-year (2001-2018) European Space Agency Fire Climate Change Initiative, version 5.1 (FireCCI51) dataset derived from MODIS aboard the NASA Terra satellite, Chuvieco et al. (2021) found that Southern Africa had the smallest interannual variability in burned area in the world, with a coefficient of variation < 0.5 across the region. Ryoo et al. (2021) documented the interannual variability in meteorological conditions over the Southeast Atlantic, finding that wind velocity, relative humidity, and precipitation were near climatological averages for August 2017, September 2016, and October 2018. They also found that despite sea surface temperatures during the ORACLES campaign months being 0.2 – 0.4 K above climatological averages, it did not have a systematic effect on low-level cloud fraction.
2. We have created maps of BC and OC columnar mass densities from MERRA-2 reanalysis (Fig. S1). The BC:OC ratio remains near 1:10 throughout the ORACLES campaign months, which is consistent with our finding that the subseasonal increase in SSA is not attributable to an increase in BrC concentration. August has the greatest BC and OC densities, although the maximums are compact and located over land. By September, higher BC and OC densities are more widespread across the Southeast Atlantic, followed by decreases in October, aligning with the September peak in AOD and AAOD noted by 4STAR. The BC and OC densities also shift southeastward over the course of the BBA emission season.
3. We have created maps of Fire Radiative Power (FRP) from Terra and Aqua MODIS thermal anomalies (Fig. S2). Fire counts peak in August and decrease over the course of the BBA emission season, with far fewer fires in October. The fires shift southeastward over the season, which is also visible from the movement in the FRP-weighted mean coordinates.
4. We agree that the more southerly location of ORACLES 2016 affected our results, which was the primary focus of the latitudinal analysis in our discussion section. We have further reiterated its effects in our abstract (Lines 23-24) and conclusions (Lines 470-474).
Lines 23-24: The latitudinal analysis indicates that the September decrease in SSA noted by 4STAR is affected by the southerly sampling location of ORACLES 2016 compared to the other two campaigns.
Lines 470-474: A latitudinal analysis of in situ measurements and subsampling of 4STAR sky-scans indicates that the September decrease in SSA noted by 4STAR is affected by the more southerly sampling location of ORACLES 2016 relative to the other two campaigns, rather than from a temporal evolution, such that ORACLES 2016 would have observed greater scattering if it had similarly targeted the central smoke plume from the equator, bringing the 4STAR SSA medians more in line with the subseasonal increase observed by AERONET.
5. The altitudinal restriction requires that the 4STAR sky-scans occurred below 3 km, but it does not remove any measurements above that altitude. The 4STAR sky-scans are total columnar measurements, so all above-aircraft values are included. The altitudinal restriction was selected to best ensure that the 4STAR sky-scans have a full columnar view below the smoke plume (Mitchell et al., 2025) and is the same criterion used by Pistone et al. (2019).
6. Expansion into the UV is complicated by the presence of an instrument artifact near 420 nm and stray light scattering at 360 and 380 nm. In alignment with your comment and that of RC2, we have increased discussion of the technical limitations (Lines 450-456) and slightly softened our conclusions regarding BrC.
Lines 450-456: EAE and AAE have little subseasonal variation, indicating domination by fine BC aerosols throughout the season, suggesting that the aerosol brightening is due to a change in aerosol composition through the season, rather than a change in aerosol type, although 4STAR did not directly observe the UV wavelengths at which BrC absorption is the strongest. Improving 4STAR’s ability to identify BrC absorption via expansion into the UV spectrum is currently complicated by an instrument artifact near 420 nm and stray light scattering at 360 and 380 nm (Mitchell et al., 2025), but could be overcome with the use of hyperspectral GRASP (Generalized Retrieval of Atmosphere and Surface Properties) code (Román et al., 2018), which is the subject of ongoing work.
Minor Comments:
Previous Lines 165-166: The typical ORACLES sampling speed of the NASA P-3 Orion aircraft was ~382 km per hour, resulting in an approximate 10-second spatial resolution of 1.1 km (Lines 181-183).
Previous Lines 196-202: It is correct that we are using the reduced independent sample sizes for the statistical tests, so we have reaffirmed that in the text (Line 214).
Previous Lines 245-248: We have added discussion to our introduction (Lines 86-90) and results (Lines 265-267) regarding Zhang et al. (2022), which has found greater BrC contributions over the Southeast Atlantic.
Lines 86-90: Using TEM-EDX (Transmission Electron Microscopy - Energy Dispersive X-ray spectroscopy) and an assumed BC refractive index, Zhang et al. (2022) determined that BrC could contribute 8 – 22 % of total aerosol absorption at 470 nm. However, their BrC estimate is much lower using the AAE attribution method, at only 2 – 6 % of total aerosol absorption at 470 nm, indicating that spectroscopy could reveal a greater BrC presence over the Southeast Atlantic than suggested by optical methods.
Lines 265-267: The lack of BrC contributions from our AAE analysis also aligns with the findings of Zhang et al. (2022), although their results indicate that electron microscopy would yield greater BrC contributions than from optical methods.
RC2:
Major Comments:
We have created maps of HYSPLIT back-trajectories (Fig. S3) for ORACLES research flight dates near the beginning, middle, and end of each campaign. HYSPLIT back-trajectories suggest aerosol transport from northern Angola in August, shifting southward from southern Angola in September, and even further southeastward from Botswana, Zambia, and Zimbabwe in October.
In alignment with your comment and that of RC1, we have increased discussion (Lines 62-70) regarding the interannual variability of Southern African aerosol emissions and meteorological conditions over the Southeast Atlantic, with literature suggesting that it is small enough to not significantly affect our results.
Lines 62-70: There is remarkably little interannual variability in Southern African fires due to the consistency of agricultural burning practices in the region (van der Werf et al., 2010; Redemann et al., 2021). Using the 18-year (2001-2018) European Space Agency Fire Climate Change Initiative, version 5.1 (FireCCI51) dataset derived from MODIS aboard the NASA Terra satellite, Chuvieco et al. (2021) found that Southern Africa had the smallest interannual variability in burned area in the world, with a coefficient of variation < 0.5 across the region. Ryoo et al. (2021) documented the interannual variability in meteorological conditions over the Southeast Atlantic, finding that wind velocity, relative humidity, and precipitation were near climatological averages for August 2017, September 2016, and October 2018. They also found that despite sea surface temperatures during the ORACLES campaign months being 0.2 – 0.4 K above climatological averages, it did not have a systematic effect on low-level cloud fraction.
We have created scatterplots showing the relationships between AAE, EAE, and SSA over time (Fig. S4). We would expect an increase in AAE if the change in SSA was due to increasing BrC concentration, but instead we see a decrease in AAE over the course of the BBA emission season, displaying a population shift even further away from BrC absorption.
Expansion into the UV is complicated by the presence of an instrument artifact near 420 nm and stray light scattering at 360 and 380 nm. In alignment with your comment and that of RC1, we have increased discussion of the technical limitations (Lines 450-456).
Lines 450-456: EAE and AAE have little subseasonal variation, indicating domination by fine BC aerosols throughout the season, suggesting that the aerosol brightening is due to a change in aerosol composition through the season, rather than a change in aerosol type, although 4STAR did not directly observe the UV wavelengths at which BrC absorption is the strongest. Improving 4STAR’s ability to identify BrC absorption via expansion into the UV spectrum is currently complicated by an instrument artifact near 420 nm and stray light scattering at 360 and 380 nm (Mitchell et al., 2025), but could be overcome with the use of hyperspectral GRASP (Generalized Retrieval of Atmosphere and Surface Properties) code (Román et al., 2018), which is the subject of ongoing work.
Minor Comments:
We have corrected the acronym introduction errors.
Previous Line 146: The table is correct, as the PSAP and Neph do have slightly different RGB reporting wavelengths. We have corrected the table caption (Lines 158-159) such that the observation counts are for SSA calculated from paired PSAP absorption and Neph scattering coefficients, following the interpolation of the scattering coefficients from the Neph wavelengths (450, 550, 700 nm) to the PSAP wavelengths (470, 530, 660 nm).
Peer review completion


Interactive discussion
Status: closed
-
RC1: 'Comment on egusphere-2026-1418', Anonymous Referee #1, 25 Apr 2026
This study investigates the subseasonal and spatial variability of biomass burning aerosol (BBA) radiative properties over the Southeast Atlantic (SEA). By utilizing airborne 4STAR measurements from the NASA ORACLES campaigns (2016-2018) alongside long-term AERONET climatological data, the manuscript provides valuable insights into the evolution of Single Scattering Albedo (SSA), Aerosol Optical Depth (AOD), and Absorption Aerosol Optical Depth (AAOD). The findings regarding the "aerosol brightening" effect as the burning season progresses are particularly interesting.
Overall, the paper is well-structured, and the dataset is highly valuable for improving aerosol-radiation interactions in climate models. However, there are several areas where the analysis requires deeper attribution, particularly regarding interannual variability, aerosol composition, and the justification of certain methodological constraints. I recommend the manuscript for publication after addressing the following major revisions.
Major Comments
- The data representing the three different months in this study (August, September, and October) were collected across three completely different years (2017, 2016, and 2018, respectively). Consequently, the deduced subseasonal trends (e.g., from August to October) might be heavily influenced or obscured by the interannual characteristics of aerosol emissions and meteorological conditions. The authors need to explicitly state this limitation in the text and discuss how interannual emission variations might impact their subseasonal conclusions.
- The current discussion regarding the characteristics of SSA, AOD, and AAOD in Sections 3.1 and 3.2 is somewhat descriptive and one-sided. Could the authors provide a more in-depth attribution linking these optical properties to the proportional changes and concentrations of aerosol compositions during the biomass burning period? It is highly recommended to acquire observational data or reanalysis datasets (such as MERRA-2) on aerosol composition and concentration, and add these to the supplementary materials. This would intuitively demonstrate how variations in aerosol composition and concentration drive the observed changes in SSA, AOD, etc.
- To further support the explanations for the variations in parameters like SSA and AOD, the authors should consider adding statistical charts or maps that represent the intensity of biomass burning (e.g., Fire Radiative Power (FRP) or fire counts) to the supplementary materials. Illustrating the spatial and temporal variation characteristics of the emission sources would greatly assist in interpreting the downstream aerosol properties.
- The manuscript demonstrates that the lower SSA observed by 4STAR in 2016 (September) is largely due to the campaign base being in Namibia, meaning the sampling region was further south and did not fully capture the central smoke plume near the equator. This implies that the subseasonal trend shown in Figures 2 and 3 (the drop in September and massive rise in October) is largely driven by a spatial sampling bias rather than pure temporal evolution. This spatial caveat should be stated more explicitly in the Abstract and Conclusions to avoid misleading readers who might interpret this purely as a temporal shift.
- The study restricts the 4STAR sky scans to altitudes of < 3 km. Is the selection of this specific boundary reasonable and fully justified? Is it possible that a significant portion of the biomass burning aerosols is transported to altitudes above 3 km in this region? A brief justification or a reference regarding the vertical distribution of the aerosol plume during the campaign should be added to clarify why 3 km is an appropriate cutoff.
- In Lines 427-430, the authors mention the potential to extrapolate 4STAR data to the UV band. Given this possibility, why wasn't this step performed in the current study? Relying solely on visible and near-infrared Absorption Angstrom Exponent (AAE) to completely exclude the role of Brown Carbon (BrC) might not be rigorous enough. Combining optical parameters in the UV band with the AAE numerical characteristics would provide a much more convincing argument when explaining the statistical features and relative contributions of Black Carbon (BC) versus BrC. If there are technical limitations preventing this extrapolation currently, please explain them explicitly and slightly soften the conclusions regarding the absence of BrC.
Minor Comments
Lines 165-166:The authors mention using a 10-second rolling average for in situ data and dividing the total observations by 10 to estimate the number of independent samples. While statistically reasonable, please briefly state the typical cruising speed of the aircraft and translate this 10-second window into an approximate spatial resolution (in kilometers). This will help readers understand the spatial scale of an "independent sample."
Lines 196-202:When utilizing the two-sample Wilcoxon rank sum test, strong autocorrelation in continuous flight data can artificially lower p-values (overestimating significance). Please explicitly confirm in the text that the sample size ( ) input into these statistical tests is the reduced independent sample size (divided by 10), rather than the raw number of data points.
Lines 245-248:The authors cite several papers that similarly found a lack of BrC. Since the presence and transport of BrC in this region can be a debated topic, it would provide a more balanced literature review to briefly mention 1-2 studies that have identified BrC contributions in the SEA or its source regions (if applicable), before explaining why this study's findings differ.
Citation: https://doi.org/10.5194/egusphere-2026-1418-RC1 -
RC2: 'Comment on egusphere-2026-1418', Anonymous Referee #2, 01 May 2026
The manuscript documents the subseasonal and spatial variability of biomass burning (BB) aerosols properties over the Southeast Atlantic (SEA) region during the NASA ORACLES campaigns (2016-2018). It combines airborne 4STAR and long-term AERONET measurements of single scattering albedo (SSA), aerosol optical depth (AOD), and absorption aerosol optical depth (AAOD). The results investigate the distinction between BC and BrC during the biomass burning season.
My recommendation is that the manuscript can be published after major revisions. The dataset and the manuscript concept are strong, but several central methodological choices are not yet documented or stress-tested enough to support some of the stronger interpretations.
Major comments
- While the manuscript effectively identifies subseasonal and spatial trends, it lacks atmospheric trajectory modeling (e.g., HYSPLIT or FLEXPART) to confirm the specific origins of the aerosols. I suggest including an analysis of back-trajectories for the study periods, this would provide vital context for the transport pathways, provide a more robust validation of the proposed source fire shifts, and strengthen the manuscript.
- The study covers three months (August–October) over a three-year period. I recommend adding a discussion on how interannual differences in meteorological conditions might have affected the finding.
- Lines 255–258: The authors attribute regional differences in SSA to a shift in source fires toward Botswana, Zimbabwe, and Mozambique, referencing trajectory analyses from Dobracki et al. (2023). However, Dobracki et al. primarily analyzed data from 2016. Given that this manuscript includes ORACLES data from 2017 and 2018, it is unclear whether this source shift is consistent across the entire study period. I recommend that the authors either demonstrate that their own data (2017–2018) exhibits similar transport patterns or explicitly discuss the interannual consistency of this source fire shift.
- To better support the claims regarding the aerosol brightening process and the distinction between BrC and BC, I suggest adding a scatter plot showing the relationship between AAE and SSA (or another identification space). This would allow the reader to see if the aerosol population shifts from a cluster associated with BrC absorption toward a less absorbing regime over time.
- Lines 427–429: The authors note that expanding the 4STAR dataset into the UV spectrum using the hyperspectral GRASP code could better isolate BrC absorption. Given that the manuscript’s primary focus is the aerosol brightening process and the distinction between BrC and BC, this would be a great addition. I recommend that the authors either incorporate these results or provide a more detailed justification for why this methodology was not applied in the conclusions.
Minor comments
- Line 19: First use of acronym “AERONET” is here so add "AErosol RObotic NETwork".
- Lines 112-113: SSA, AOD, AAAOD, EAE, AAE are already stated in the introduction so you can use freely the acronym.
- Line 146: First use of acronym “PSAP”, so you need to define the acronym.
- Line 146: You mention that both PSAP & Neph measure in the same wavelengths, consider correcting the table caption (Since in the table you mention a difference of 20 and 40 nm between two instruments).
Citation: https://doi.org/10.5194/egusphere-2026-1418-RC2 -
AC1: 'Reply to RC1 and RC2', Logan Mitchell, 19 Jun 2026
Thank you both for your reviews. We have used your comments to improve our manuscript, including the creation of a supplement (attached). Specific responses to the major and minor comments of RC1 and RC2 are below:
RC1:
Major Comments:
1. In alignment with your comment and that of RC2, we have increased discussion (Lines 62-70) regarding the interannual variability of Southern African aerosol emissions and meteorological conditions over the Southeast Atlantic, with literature suggesting that it is small enough to not significantly affect our results.
Lines 62-70: There is remarkably little interannual variability in Southern African fires due to the consistency of agricultural burning practices in the region (van der Werf et al., 2010; Redemann et al., 2021). Using the 18-year (2001-2018) European Space Agency Fire Climate Change Initiative, version 5.1 (FireCCI51) dataset derived from MODIS aboard the NASA Terra satellite, Chuvieco et al. (2021) found that Southern Africa had the smallest interannual variability in burned area in the world, with a coefficient of variation < 0.5 across the region. Ryoo et al. (2021) documented the interannual variability in meteorological conditions over the Southeast Atlantic, finding that wind velocity, relative humidity, and precipitation were near climatological averages for August 2017, September 2016, and October 2018. They also found that despite sea surface temperatures during the ORACLES campaign months being 0.2 – 0.4 K above climatological averages, it did not have a systematic effect on low-level cloud fraction.
2. We have created maps of BC and OC columnar mass densities from MERRA-2 reanalysis (Fig. S1). The BC:OC ratio remains near 1:10 throughout the ORACLES campaign months, which is consistent with our finding that the subseasonal increase in SSA is not attributable to an increase in BrC concentration. August has the greatest BC and OC densities, although the maximums are compact and located over land. By September, higher BC and OC densities are more widespread across the Southeast Atlantic, followed by decreases in October, aligning with the September peak in AOD and AAOD noted by 4STAR. The BC and OC densities also shift southeastward over the course of the BBA emission season.
3. We have created maps of Fire Radiative Power (FRP) from Terra and Aqua MODIS thermal anomalies (Fig. S2). Fire counts peak in August and decrease over the course of the BBA emission season, with far fewer fires in October. The fires shift southeastward over the season, which is also visible from the movement in the FRP-weighted mean coordinates.
4. We agree that the more southerly location of ORACLES 2016 affected our results, which was the primary focus of the latitudinal analysis in our discussion section. We have further reiterated its effects in our abstract (Lines 23-24) and conclusions (Lines 470-474).
Lines 23-24: The latitudinal analysis indicates that the September decrease in SSA noted by 4STAR is affected by the southerly sampling location of ORACLES 2016 compared to the other two campaigns.
Lines 470-474: A latitudinal analysis of in situ measurements and subsampling of 4STAR sky-scans indicates that the September decrease in SSA noted by 4STAR is affected by the more southerly sampling location of ORACLES 2016 relative to the other two campaigns, rather than from a temporal evolution, such that ORACLES 2016 would have observed greater scattering if it had similarly targeted the central smoke plume from the equator, bringing the 4STAR SSA medians more in line with the subseasonal increase observed by AERONET.
5. The altitudinal restriction requires that the 4STAR sky-scans occurred below 3 km, but it does not remove any measurements above that altitude. The 4STAR sky-scans are total columnar measurements, so all above-aircraft values are included. The altitudinal restriction was selected to best ensure that the 4STAR sky-scans have a full columnar view below the smoke plume (Mitchell et al., 2025) and is the same criterion used by Pistone et al. (2019).
6. Expansion into the UV is complicated by the presence of an instrument artifact near 420 nm and stray light scattering at 360 and 380 nm. In alignment with your comment and that of RC2, we have increased discussion of the technical limitations (Lines 450-456) and slightly softened our conclusions regarding BrC.
Lines 450-456: EAE and AAE have little subseasonal variation, indicating domination by fine BC aerosols throughout the season, suggesting that the aerosol brightening is due to a change in aerosol composition through the season, rather than a change in aerosol type, although 4STAR did not directly observe the UV wavelengths at which BrC absorption is the strongest. Improving 4STAR’s ability to identify BrC absorption via expansion into the UV spectrum is currently complicated by an instrument artifact near 420 nm and stray light scattering at 360 and 380 nm (Mitchell et al., 2025), but could be overcome with the use of hyperspectral GRASP (Generalized Retrieval of Atmosphere and Surface Properties) code (Román et al., 2018), which is the subject of ongoing work.
Minor Comments:
Previous Lines 165-166: The typical ORACLES sampling speed of the NASA P-3 Orion aircraft was ~382 km per hour, resulting in an approximate 10-second spatial resolution of 1.1 km (Lines 181-183).
Previous Lines 196-202: It is correct that we are using the reduced independent sample sizes for the statistical tests, so we have reaffirmed that in the text (Line 214).
Previous Lines 245-248: We have added discussion to our introduction (Lines 86-90) and results (Lines 265-267) regarding Zhang et al. (2022), which has found greater BrC contributions over the Southeast Atlantic.
Lines 86-90: Using TEM-EDX (Transmission Electron Microscopy - Energy Dispersive X-ray spectroscopy) and an assumed BC refractive index, Zhang et al. (2022) determined that BrC could contribute 8 – 22 % of total aerosol absorption at 470 nm. However, their BrC estimate is much lower using the AAE attribution method, at only 2 – 6 % of total aerosol absorption at 470 nm, indicating that spectroscopy could reveal a greater BrC presence over the Southeast Atlantic than suggested by optical methods.
Lines 265-267: The lack of BrC contributions from our AAE analysis also aligns with the findings of Zhang et al. (2022), although their results indicate that electron microscopy would yield greater BrC contributions than from optical methods.
RC2:
Major Comments:
We have created maps of HYSPLIT back-trajectories (Fig. S3) for ORACLES research flight dates near the beginning, middle, and end of each campaign. HYSPLIT back-trajectories suggest aerosol transport from northern Angola in August, shifting southward from southern Angola in September, and even further southeastward from Botswana, Zambia, and Zimbabwe in October.
In alignment with your comment and that of RC1, we have increased discussion (Lines 62-70) regarding the interannual variability of Southern African aerosol emissions and meteorological conditions over the Southeast Atlantic, with literature suggesting that it is small enough to not significantly affect our results.
Lines 62-70: There is remarkably little interannual variability in Southern African fires due to the consistency of agricultural burning practices in the region (van der Werf et al., 2010; Redemann et al., 2021). Using the 18-year (2001-2018) European Space Agency Fire Climate Change Initiative, version 5.1 (FireCCI51) dataset derived from MODIS aboard the NASA Terra satellite, Chuvieco et al. (2021) found that Southern Africa had the smallest interannual variability in burned area in the world, with a coefficient of variation < 0.5 across the region. Ryoo et al. (2021) documented the interannual variability in meteorological conditions over the Southeast Atlantic, finding that wind velocity, relative humidity, and precipitation were near climatological averages for August 2017, September 2016, and October 2018. They also found that despite sea surface temperatures during the ORACLES campaign months being 0.2 – 0.4 K above climatological averages, it did not have a systematic effect on low-level cloud fraction.
We have created scatterplots showing the relationships between AAE, EAE, and SSA over time (Fig. S4). We would expect an increase in AAE if the change in SSA was due to increasing BrC concentration, but instead we see a decrease in AAE over the course of the BBA emission season, displaying a population shift even further away from BrC absorption.
Expansion into the UV is complicated by the presence of an instrument artifact near 420 nm and stray light scattering at 360 and 380 nm. In alignment with your comment and that of RC1, we have increased discussion of the technical limitations (Lines 450-456).
Lines 450-456: EAE and AAE have little subseasonal variation, indicating domination by fine BC aerosols throughout the season, suggesting that the aerosol brightening is due to a change in aerosol composition through the season, rather than a change in aerosol type, although 4STAR did not directly observe the UV wavelengths at which BrC absorption is the strongest. Improving 4STAR’s ability to identify BrC absorption via expansion into the UV spectrum is currently complicated by an instrument artifact near 420 nm and stray light scattering at 360 and 380 nm (Mitchell et al., 2025), but could be overcome with the use of hyperspectral GRASP (Generalized Retrieval of Atmosphere and Surface Properties) code (Román et al., 2018), which is the subject of ongoing work.
Minor Comments:
We have corrected the acronym introduction errors.
Previous Line 146: The table is correct, as the PSAP and Neph do have slightly different RGB reporting wavelengths. We have corrected the table caption (Lines 158-159) such that the observation counts are for SSA calculated from paired PSAP absorption and Neph scattering coefficients, following the interpolation of the scattering coefficients from the Neph wavelengths (450, 550, 700 nm) to the PSAP wavelengths (470, 530, 660 nm).
Peer review completion
Journal article(s) based on this preprint
Data sets
ORACLES Aerosol Aircraft In Situ Data NASA/LARC/SD/ASDC https://doi.org/10.5067/ASDC_DAAC/ORACLES_Aerosol_AircraftInSitu_Data_1
AERONET NASA GSFC https://aeronet.gsfc.nasa.gov/
Viewed
| HTML | XML | Total | BibTeX | EndNote | |
|---|---|---|---|---|---|
| 647 | 241 | 75 | 963 | 66 | 80 |
- HTML: 647
- PDF: 241
- XML: 75
- Total: 963
- BibTeX: 66
- EndNote: 80
Viewed (geographical distribution)
| Country | # | Views | % |
|---|
| Total: | 0 |
| HTML: | 0 |
| PDF: | 0 |
| XML: | 0 |
- 1

Connor J. Flynn
Kristina Pistone
Samuel E. LeBlanc
K. Sebastian Schmidt
Hong Chen
Paquita Zuidema
Robert Wood
Jens Redemann
The requested preprint has a corresponding peer-reviewed final revised paper. You are encouraged to refer to the final revised version.
- Preprint
(2845 KB) - Metadata XML
This study investigates the subseasonal and spatial variability of biomass burning aerosol (BBA) radiative properties over the Southeast Atlantic (SEA). By utilizing airborne 4STAR measurements from the NASA ORACLES campaigns (2016-2018) alongside long-term AERONET climatological data, the manuscript provides valuable insights into the evolution of Single Scattering Albedo (SSA), Aerosol Optical Depth (AOD), and Absorption Aerosol Optical Depth (AAOD). The findings regarding the "aerosol brightening" effect as the burning season progresses are particularly interesting.
Overall, the paper is well-structured, and the dataset is highly valuable for improving aerosol-radiation interactions in climate models. However, there are several areas where the analysis requires deeper attribution, particularly regarding interannual variability, aerosol composition, and the justification of certain methodological constraints. I recommend the manuscript for publication after addressing the following major revisions.
Major Comments
Minor Comments
Lines 165-166:The authors mention using a 10-second rolling average for in situ data and dividing the total observations by 10 to estimate the number of independent samples. While statistically reasonable, please briefly state the typical cruising speed of the aircraft and translate this 10-second window into an approximate spatial resolution (in kilometers). This will help readers understand the spatial scale of an "independent sample."
Lines 196-202:When utilizing the two-sample Wilcoxon rank sum test, strong autocorrelation in continuous flight data can artificially lower p-values (overestimating significance). Please explicitly confirm in the text that the sample size ( ) input into these statistical tests is the reduced independent sample size (divided by 10), rather than the raw number of data points.
Lines 245-248:The authors cite several papers that similarly found a lack of BrC. Since the presence and transport of BrC in this region can be a debated topic, it would provide a more balanced literature review to briefly mention 1-2 studies that have identified BrC contributions in the SEA or its source regions (if applicable), before explaining why this study's findings differ.