
the Creative Commons Attribution 4.0 License.
the Creative Commons Attribution 4.0 License.
 | 21 Apr 2026
Machine learning significantly improves the simulation of hourly-to-yearly scale cloud nuclei concentration and radiative forcing in polluted atmosphere
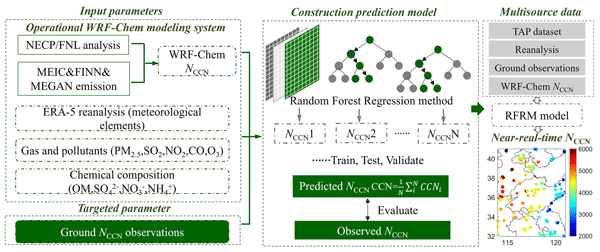
Abstract. The accurate prediction of cloud condensation nuclei (CCN) number concentration (NCCN) on a large spatiotemporal scale is challenging but critical to evaluate the aerosol cloud interaction effect. Combining multi-source dataset and the NCCN simulated by the Weather Research and Forecasting coupled with Chemistry (WRF-Chem) model, we have developed a Random Forest Regression method (RFRM) model which achieves well prediction of hourly-to-yearly scale NCCN at typical supersaturations in polluted North China Plain (NCP). We show that the prediction bias of NCCN compared to observations is reduced from -59 % with the WRF-Chem model to approximately -31 % with the RFRM model (the prediction precision is improved by 1.6 times accordingly) during the campaigns. The greatest improvement is seen in both very polluted and clean cases. The RFRM model captures well the spatial variation and better describes long-term trends of NCCN. More importantly, the prediction reveals a significant long-term decreasing trend of NCCN in NCP due to a rapid reduction in aerosol concentrations from 2014 to 2018, during which a series of strict emission reduction measures were implemented by the Chinese government. This reflects the climate benefit of pollution control. Our study further illustrates that the RFRM model reduces the uncertainty in simulating cloud radiative forcing from an overestimation of 1.89 ± 0.78 W m-2 to 0.81 ± 0.63 W m-2, illustrating the high sensitivity of climate forcing to changes in NCCN. This work offers a new modeling framework that guides the way to simulate CCN in other regions around the world and has the potential to effectively filling the observation gap of CCN concentrations.
-
Notice on discussion status
The requested preprint has a corresponding peer-reviewed final revised paper. You are encouraged to refer to the final revised version.
-
Preprint
(2107 KB)
-
Supplement
(1516 KB)
-
The requested preprint has a corresponding peer-reviewed final revised paper. You are encouraged to refer to the final revised version.
- Preprint
(2107 KB) - Metadata XML
-
Supplement
(1516 KB) - BibTeX
- EndNote
- Final revised paper


Journal article(s) based on this preprint
Interactive discussion
Status: closed
-
RC1: 'Comment on egusphere-2026-1347', Anonymous Referee #1, 04 May 2026
The comment was uploaded in the form of a supplement: https://egusphere.copernicus.org/preprints/2026/egusphere-2026-1347/egusphere-2026-1347-RC1-supplement.pdfCitation: https://doi.org/
10.5194/egusphere-2026-1347-RC1 -
AC1: 'Reply on RC1', Fang Zhang, 01 Jul 2026
Response to the reviewers
Referee #1
This study applies machine learning (random forest) to the spatiotemporal prediction of cloud condensation nuclei (CCN) concentrations in the heavily polluted North China Plain. It significantly reduces the CCN simulation bias from −59% to approximately −31%, and consequently lowers the simulation uncertainty of cloud radiative forcing from 1.89 ± 0.78 W m⁻² to 0.81 ± 0.63 W m⁻². This provides a new method for accurately assessing aerosol–cloud interactions and the climate benefits of pollution control. Moreover, by incorporating observational data such as PM2.5, NO2, and SO2, the model captured the long-term decreasing trend in aerosol concentration from 2014 to 2018 and quantified the reduction in cloud radiative forcing uncertainty achieved by mitigating NCCN simulation biases. This topic is highly relevant to the journal of Geoscientific Model Development. The model incorporates the CCN concentrations simulated by WRF-Chem as an input, with the observed CCN as the target. This represents a reasonable bias-correction approach. The methodology and results are interesting. Thus, I suggest several minor modifications to be made before publication.
Re: We sincerely appreciate the time and effort the reviewers have dedicated to evaluating our manuscript. Based on the reviewers' comments and suggestions, we have addressed each point accordingly, and we believe the revised version has been significantly improved.
Minor Concerns:
Line 160: "TAP" is used without definition; please provide the full name (Tracking Air Pollution in China) at first use.
Re: Revised.
Line 162: The OM and sulfate in the TAP dataset are "underestimated by approximately 50%" and therefore apply a "twofold correction factor." However, it is unclear whether this correction is applied during the training phase, the prediction phase, or both. If the correction is applied only during the prediction phase while the training phase uses uncorrected data, this would lead to a distribution mismatch between training and inference.
Re: Thanks for the comments. During model construction, the TAP dataset was not adopted. Instead, the model was developed solely based on observational data from several monitoring sites. In this study, the TAP dataset was only utilized to derive region-scale CCN number concentrations using the established model.
As described in the Methods section (Section 2.2), all chemical composition data used for model training and testing were derived from ground-based observations. See Lines 125-130:
“…The main dataset that are used to construct the ML-based NCCN prediction model were from six field campaigns at three sites in the NCP (more details see section 2.3.1). The observed CCN number concentration (at supersaturations of 0.2% and 0.4%) is as targeted parameter, and the simultaneously measured atmospheric gaseous precursors, fine particles chemical compositions, and meteorological parameters are as model input parameters…”
The TAP dataset was used exclusively for the regional-scale and interannual predictions. Prior to using the TAP data, we first compared its chemical components with collocated ground-based observations. This comparison revealed a systematic underestimation of OM and sulfate in the TAP dataset (approximately 50%). To ensure consistency between the model input during prediction and the observed data used for training, we therefore applied a twofold correction factor only to the OM and sulfate concentrations from the TAP dataset during the prediction phase.
See Lines 163-166: “…Compared with the observations at the BJ site, mass concentrations for the OM and sulfate from TAP dataset were largely underestimated by approximately 50% (Fig. S1). Therefore, a twofold correction factor was applied to these components when estimating the regional scale and interannual CCN concentrations in NCP…”
Line 199-201 and 276-277: The sentence "the campaign mean mass concentration of PM2.5 ranges from 35.6 to 160 μg m-3, indicating that the observations can represent various atmospheric conditions" is repetitive with the introduction in Section 2.3.1.
Re: The sentence in Lines 201-203 has been revised as: “The observed NCCN varies from a few hundred to tens of thousands at these sites, indicating that the observations can represent various atmospheric conditions.”
Line 236: The authors interpret the SHAP values as evidence that OM has strong hygroscopicity driving CCN activation. However, SHAP values reflect association rather than causation. It is recommended to add a qualifying statement: “While SHAP indicates a strong association, the causal interpretation should be supported by the known hygroscopicity of OM in the NCP (Liu et al., 2021).”
Re: Thank you for your insightful comment. Yes, the SHAP value explains the potential influence of model predictors on the predicted CCN concentration. The wide range of SHAP values for OM reflects the diversity of its physicochemical properties—OM can act either as an inhibitor of CCN activation or as a strong promoter. Low SHAP values may arise from freshly emitted hydrophobic OM, which suppresses CCN activation and contributes little or even negatively. In contrast, high SHAP values correspond to aged/oxidized OM with enhanced hygroscopicity, which significantly promotes CCN activation. We have added some explanation as follows or see Lines 236-254:
“…Organic matter emerges as the most crucial indicator with the highest SHAP value. The wide range of SHAP values for OM reflects the diversity of its physicochemical properties. Specifically, low-concentration or freshly emitted hydrophobic OM contributes negatively to NCCN (suppressing activation), whereas high-concentration or aged/oxidized OM contributes positively (promoting activation). From an overall perspective, SHAP values increase monotonically with OM concentration, and the absolute values of positive SHAP values exceed those of negative ones, demonstrating a synergistic positive effect of OM concentration on the variation of CCN number concentration. This finding differs from the conventional view that inorganic salts contribute more to CCN due to their strong hygroscopicity (Petters and Kreidenweis, 2007). However, in fact, we also note that under conditions of high OM, the concentrations of CN and CCN indeed show an increasing trend (Fig. S5). In addition, previous studies have shown that in the North China region where the proportion and concentration of OM are both high, organic particles affected by strong anthropogenic emission sources was found exhibit strong hygroscopicity, enabling them to serve as more effective CCN (Liu et al., 2021); in addition, the surface tension lowering effect of OM particles in this region can also enhance particle CCN activity (Fan et al., 2024). Therefore, the SHAP analysis results further confirm the conclusions of previous studies…”
Line 289: "During the GC2018_WIN campaign, the observed NCCN is underestimated by as much as 71% by WRF-Chem (Fig. S6). Here, it might be referring to Fig. S5?"
Re: In the revised text, it referred to Fig. S6.
Lin 289-296: It notes that the model's performance improves much more during severely polluted winter conditions than during cleaner summer conditions. It is recommended to emphasize more explicitly in the Conclusions that the improvement is particularly pronounced under highly polluted (cold-season) conditions, which has practical implications for CCN prediction in heavily polluted regions.
Re: Thank you for this suggestion. In response, we have revised the Conclusions section to explicitly state that the model's improvement is particularly pronounced under severely polluted (cold-season) conditions. The sentence has been added as follows or see Lines 476-481: “…The results show that the prediction bias of NCCN compared to observations is approximately -31% from the RFRM model. Good accuracy has also been achieved during heavy pollution periods or cold seasons. This improvement is much more pronounced under severely polluted winter conditions, demonstrating the model's particular value for CCN prediction in heavily polluted environments…”
Line 297: “The improvements in RFRM model also demonstrate the effectiveness of the model trained on atmospheric variables to revise the simulation in model”. The phrase “in model” at the end of the sentence is unclear in meaning.
Re: Revised. See follows: “The improvements in RFRM model also demonstrate the effectiveness of the model trained on atmospheric variables to revise the simulation in WRF-Chem model.”
Line 298: The article has already used another observation at GC site to provide independent spatiotemporal validation. This should be discussed in detail to demonstrate that the model's generalizability has been effectively verified.
Re: Revised. The sentences have been added as follows or see Lines 311-316:
“… In addition, we also evaluated the model performance based on another observation at GC site in January (Zhang et al., 2020) (Fig. S7). Compared to WRF-Chem simulations, the RFRM model could more accurately captures the peak and valley CCN concentrations. The mode showed the greatest improvement and the underestimation is largely improved with the predicted bias of only 4% in the RFRM model (Fig. S7) …”
Line 307: “the underestimation of NCCN by the WRF-Chem model is likely due to the overestimation of the organics and BC mass fraction induced by WRF-Chem (Fig. S8), but the underestimation of the hygroscopic parameter of organics, and the simplified prescriptions in particle size distribution”. “But the clauses before and after 'but' do not indicate a contrast.”
Re: The sentences have been revised as follows or see Lines 322-325: “…the underestimation of NCCN by the WRF-Chem model is likely due to the overestimation of the organics and BC mass fraction induced by WRF-Chem (Fig. S9), along with the underestimation of the hygroscopic parameter of organics, and the simplified prescriptions in particle size distribution...”
Line 329: Here they used long-term PNSD measurements and κ-Köhler theory to calculate the "observed" annual mean NCCN (NCCN_obs). However, the κ values themselves are derived from the TAP dataset (which is biased even after correction). Moreover, the authors note that "κ values are much less sensitive to changes in NCCN compared to the PNSD" (Lines 345–347). A sensitivity analysis is needed to quantify the impact of κ uncertainty on the final NCCN _obs.
Re: Thanks for the comments. The sensitivity analysis was shown in Fig. R1. Revised see follows or Lines 360-371:Fig. R1 Average annual value of the κchem calculated from chemical composition (a), the critical diameter at S=0.2% (b), NCCN at S=0.2% (c), the mass fraction (d) between the observed and TAP dataset in the winter of 2014, 2016, 2018.
“…A comparison of the values of κ and NCCN between that derived using field observations and the TAP dataset shows little differences (Fig. S10); actually, the long-term change of NCCN is much less sensitive to changes in κ values compared to the PNSD (Fig. S10c). Sensitivity analysis showed that a ±20% change in κ leads to a change in NCCN of approximately ±8%. Comparing the κchem derived from the TAP method and the OBS method, the difference is approximately ±6%, the estimated deviation in the critical activation diameter ranges from -2% to 3%. Although absolute concentrations of components in the TAP dataset deviate from observations, their mass fractions are consistent (Fig. S10d), rendering the impact on the calculated κ negligible. In addition, the method to calculate NCCN at S=0.2% based on κ-Köhler theory would cause an upper-limit uncertainty of 7% (Ren et al., 2018) …”
Line 476: In the “Limitations and outlook” section, the authors honestly acknowledge that the observational data come from only six campaigns at three sites. It is recommended to add a discussion on the spatiotemporal representativeness of these observations.
Re: Thank you for your suggestion. We have added the following discussion in the “Limitations and outlook" section, see Lines 501-511:
“…Second, this study analyzes observational data from six campaigns conducted at three sites. Although the number of sites is limited, these sites represent urban, suburban, and regional background conditions, respectively, and the observation periods cover different seasons and years. Therefore, the current dataset can reasonably characterize the overall aerosol and CCN conditions in North China, and may also provide useful implications for other polluted regions with similar emission characteristics. Validating the simulated NCCN through comparisons with observations at more ground sites is warranted in future. Also, it is crucial to obtain comprehensive monitoring data of CCN and other key aerosol properties (e.g., particle size distribution, chemical compositions) in different environments…”
Line 732: Figure 2 shows an R² of 0.86–0.95 for the test set, but Figure 3c shows an R² of only 0.86 (RFRM vs. observations). These two R² values are calculated for different targets (the former may be RFRM vs. WRF-Chem? The latter is RFRM vs. observations). This should be clearly stated in the figure captions.
Re: Figure 2 presents the results on the test set, while Figure 3 presents the results on the validation set for the selected independent cases of the six campaigns. The caption of Figure 3 has already been revised see follows: “Fig. 3 Performance of the RFRM model in predicting NCCN at field sites in NCP. (a) Time series of the observed and predicted NCCN at S=0.2% for the six periods (BJ2015_AUT, BJ2017_SUM, XT2016_SUM, BJ2014_WIN, BJ2016_WIN, GC2018_WIN) in the North China Plain for the validation set.”
Line 732: In Figure 2b, the SHAP plot lacks units or dimensions. Please clarify in the caption: “SHAP values represent the contribution to NCCN (in cm⁻³).”
Re: Revised.
Line 737: Use NCCN consistently throughout the manuscript. For example, in the title of Fig. 3 on page 34, it reads “Time series of the observed and predicted CCN number concentrations”, while the axis label reads “NCCN (cm⁻³)”
Re: The caption has been revised.
The manuscript uses both "RFRM" (Random Forest Regression Method) and "RF model" (line 138). It is recommended to use "RFRM model" consistently throughout.
Re: Revised.
-
AC1: 'Reply on RC1', Fang Zhang, 01 Jul 2026
-
RC2: 'Comment on egusphere-2026-1347', Anonymous Referee #2, 05 Jun 2026
The authors present a framework combining multi-source data with Random Forest Regression to predict CCN concentrations. The significant improvement in prediction accuracy over the traditional WRF-Chem model, particularly in capturing long-term trends in the North China Plain. This study bridges the observation gap and highlights the climate benefits of emission controls. The methodology is sound, and the results are compelling. I recommend publication after minor revisions.
- Organic matter was found to be the most crucial indicator for the CCN concentration prediction. The results are interesting; the inorganic salts are always thought to have high potential for the CCN. More explanation is needed here, if the number concentrations would increase under the high OM conditions?
- The influence of temperature showed the bidirectional influence, whether the temperature would influence the emission sources or the chemical reaction in the atmosphere.
- The ratio between POA and SOA is important for the number of CCN. Can the model separate these two components? How about the performance of the simulation?
- A few sites near the coast with positive values in recent years, why accumulation-mode particles increase, more discussion would be helpful.
Citation: https://doi.org/10.5194/egusphere-2026-1347-RC2 -
AC2: 'Reply on RC2', Fang Zhang, 01 Jul 2026
Response to the reviewers
Referee #2
The authors present a framework combining multi-source data with Random Forest Regression to predict CCN concentrations. The significant improvement in prediction accuracy over the traditional WRF-Chem model, particularly in capturing long-term trends in the North China Plain. This study bridges the observation gap and highlights the climate benefits of emission controls. The methodology is sound, and the results are compelling. I recommend publication after minor revisions.
Re: We deeply appreciate the time and effort that the reviewers have dedicated to evaluating our manuscript. We believe that the revised version has been greatly improved in terms of the rationality of the model development methodology and the reliability of the results.
- Organic matter was found to be the most crucial indicator for the CCN concentration prediction. The results are interesting; the inorganic salts are always thought to have high potential for the CCN. More explanation is needed here, if the number concentrations would increase under the high OM conditions?
Re: Thank you for your insightful comment. In this study, organic matter constitutes 20–90% of the aerosol mass in the North China Plain. Although OM is generally less hygroscopic than inorganic salts, its large mass fraction can compensate for its lower hygroscopicity, leading to a significant overall impact on CCN activation. In addition, recent studies have shown that OM can be partially hygroscopic or even surface-active, especially after aging and oxidation. Oxygenated organic aerosols can exhibit κ values comparable to those of some inorganic species. Moreover, OM can internally mix with inorganic salts, thereby altering the overall hygroscopicity of the particles. And we also noted that the CN number concentration would increase under the high OM conditions as shown in Fig. R1, further suggesting the OM can serve as the potential seed for CCN.
We have added some explanation as follows or see Lines 236-254:
“…Organic matter emerges as the most crucial indicator with the highest SHAP value. The wide range of SHAP values for OM reflects the diversity of its physicochemical properties. Specifically, low-concentration or freshly emitted hydrophobic OM contributes negatively to NCCN (suppressing activation), whereas high-concentration or aged/oxidized OM contributes positively (promoting activation). From an overall perspective, SHAP values increase monotonically with OM concentration, and the absolute values of positive SHAP values exceed those of negative ones, demonstrating a synergistic positive effect of OM concentration on the variation of CCN number concentration. This finding differs from the conventional view that inorganic salts contribute more to CCN due to their strong hygroscopicity (Petters and Kreidenweis, 2007). However, in fact, we also note that under conditions of high OM, the concentrations of CN and CCN indeed show an increasing trend (Fig. S5). In addition, previous studies have shown that in the North China region where the proportion and concentration of OM are both high, organic particles affected by strong anthropogenic emission sources was found exhibit strong hygroscopicity, enabling them to serve as more effective CCN (Liu et al., 2021); in addition, the surface tension lowering effect of OM particles in this region can also enhance particle CCN activity (Fan et al., 2024). Therefore, the SHAP analysis results further confirm the conclusions of previous studies…”
- The influence of temperature showed the bidirectional influence, whether the temperature would influence the emission sources or the chemical reaction in the atmosphere.
Re: Thanks for the comments. The SHAP analysis reveals a bidirectional nonlinear influence of temperature on CCN prediction, reflecting the dual regulatory role of temperature on emission sources and atmospheric chemical reactions. On the one hand, elevated temperatures promote VOC emissions and photochemical reactions, enhance the formation and aging of secondary organic aerosol (SOA), and increase particle hygroscopicity. On the other hand, low temperatures facilitate gas-particle partitioning, while high temperatures may accelerate new particle formation but suppress nucleation rates. These competing mechanisms collectively contribute to the observed bidirectional influence of temperature, which is consistent with the findings of Song et al. (2022) regarding the nonlinear modulation of CCN activity by temperature. We have added some explanation as follows or see Lines 267-275:
“…Temperature demonstrated a bidirectional influence, suggesting nonlinear modulation of CCN activity potentially associated with the temperature dependence of nucleation growth and secondary generation of particles (Song et al., 2022). Specifically, temperature-driven enhancements in emissions exacerbate the formation of secondary organic aerosols, thereby affecting CCN concentrations (Lian et al., 2025). In addition, temperature significantly influences aerosol formation, aging, and transformation processes by regulating photochemical reaction rates, particle aging processes, and gas-particle partitioning, which in turn affect nucleation processes and exert important impacts on CCN concentrations…”
- The ratio between POA and SOA is important for the number of CCN. Can the model separate these two components? How about the performance of the simulation?
Re: Thank you for your suggestion. The RFRM model used in this study takes OM mass concentration as input and does not distinguish between primary organic aerosol (POA) and secondary organic aerosol (SOA). This is because we used the TAP dataset for spatiotemporal prediction, which does not provide detailed POA and SOA information. The high SHAP importance of OM indirectly suggests that incorporating POA and SOA information could have a significant impact on CCN prediction. In the future, introducing the POA/SOA ratio as a feature may further improve the model's interpretability.
- A few sites near the coast with positive values in recent years, why accumulation-mode particles increase, more discussion would be helpful.
Re: The positive trends in accumulation-mode particles at coastal sites can be explained as: first, enhanced primary combustion emissions from sources other than on-road vehicles (e.g., industrial and residential coal burning) (Zhu et al., 2021); sea salt contributions a substantial source of accumulation-mode particles under marine air influence (Zou et al., 2024). And previous studies have demonstrated that baseline sea spray fluxes contribute approximately 50% of the submicron particle number flux in the accumulation mode even under clean marine conditions (Geever et al., 2005). Some explanations have been added as follows or see Lines 400-408:
“…Interestingly, note a few sites with positive values (upward trends in NCCN) are mainly located along the coast. An increase in the fraction of accumulation-mode particles in coastal areas has been reported contributing more CCN (Zhu et al., 2021). In fact, previous studies have revealed that in Qingdao, enhanced primary combustion emissions from sources other than on-road vehicles (e.g., industrial and residential coal burning) serve as the main driver of increased accumulation-mode number concentrations (Zhu et al., 2021). Furthermore, coastal observations have identified sea salt aerosols as an important source of accumulation-mode particles (Zou et al., 2024) …”
References:
Fan, T., Ren, J., Liu, C., Li, Z., Liu, J., Sun, Y., et al.: Evidence of surface‐tension lowering of atmospheric aerosols by organics from field observations in an urban atmosphere: Relation to particle size and chemical composition, Environmental Science & Technology, 58(26), 11363–11375. https://doi.org/10.1021/acs.est.4c03141, 2024.
Liu, J., Zhang, F., Xu, W. et al.: Hygroscopicity of organic aerosols linked to formation mechanisms, Geophysical Research Letters, 48, https://doi.org/10.1029/2020GL091683, 2021.
Petters, M. D., Kreidenweis, S. M.: A single parameter representation of hygroscopic growth and cloud condensation nucleus activity, Atmos. Chem. Phys., 7(8), 1961–1971, https://doi.org/10.5194/acp-7-1961-2007, 2007.
Song, C., Becagli, S., Beddows, D. C. S. et al.: Understanding Sources and Drivers of Size-Resolved Aerosol in the High Arctic Islands of Svalbard Using a Receptor Model Coupled with Machine Learning, Environmental Science & Technology, 56(16), 11189–11198, https://doi.org/10.1021/acs.est.1c07796, 2022.
Lian, J., Wang, Y., Li, K., Zhang, R., and Smith, D. M.: Nature of temperature-induced phase transitions in secondary organic aerosol particles, Environmental Science & Technology, 59(45), 24359–24367, https://doi.org/10.1021/acs.est.5c08582, 2025.
Zhu, Y., Shen, Y., Li, K. et al.: Investigation of particle number concentrations and new particle formation with largely reduced air pollutant emissions at a coastal semi-urban site in northern China, Journal of Geophysical Research: Atmospheres, 126, e2021JD035419, https://doi.org/10.1029/2021JD035419, 2021.
Geever, M., O'Dowd, C. D., van Ekeren, S., Flanagan, R., Nilsson, E. D., de Leeuw, G., & Kulmala, M.: Submicron sea spray fluxes. Geophysical Research Letters, 32(15), L15810, https://doi.org/10.1029/2005GL023081, 2005.
Zou, S., Chen, L., Xu, H., Zhang, R., Liu, M., Liu, G., Ye, J., Yang, H., Wu, H., Yang, Y., & Zhang, F.: Observed size-dependent effect of the marine air on aerosols hygroscopicity at a coastal site of Shenzhen, China, Atmospheric Research, 315, 107835. https://doi.org/10.1016/j.atmosres.2024.107830, 2024.
Peer review completion


Interactive discussion
Status: closed
-
RC1: 'Comment on egusphere-2026-1347', Anonymous Referee #1, 04 May 2026
The comment was uploaded in the form of a supplement: https://egusphere.copernicus.org/preprints/2026/egusphere-2026-1347/egusphere-2026-1347-RC1-supplement.pdf
-
AC1: 'Reply on RC1', Fang Zhang, 01 Jul 2026
Response to the reviewers
Referee #1
This study applies machine learning (random forest) to the spatiotemporal prediction of cloud condensation nuclei (CCN) concentrations in the heavily polluted North China Plain. It significantly reduces the CCN simulation bias from −59% to approximately −31%, and consequently lowers the simulation uncertainty of cloud radiative forcing from 1.89 ± 0.78 W m⁻² to 0.81 ± 0.63 W m⁻². This provides a new method for accurately assessing aerosol–cloud interactions and the climate benefits of pollution control. Moreover, by incorporating observational data such as PM2.5, NO2, and SO2, the model captured the long-term decreasing trend in aerosol concentration from 2014 to 2018 and quantified the reduction in cloud radiative forcing uncertainty achieved by mitigating NCCN simulation biases. This topic is highly relevant to the journal of Geoscientific Model Development. The model incorporates the CCN concentrations simulated by WRF-Chem as an input, with the observed CCN as the target. This represents a reasonable bias-correction approach. The methodology and results are interesting. Thus, I suggest several minor modifications to be made before publication.
Re: We sincerely appreciate the time and effort the reviewers have dedicated to evaluating our manuscript. Based on the reviewers' comments and suggestions, we have addressed each point accordingly, and we believe the revised version has been significantly improved.
Minor Concerns:
Line 160: "TAP" is used without definition; please provide the full name (Tracking Air Pollution in China) at first use.
Re: Revised.
Line 162: The OM and sulfate in the TAP dataset are "underestimated by approximately 50%" and therefore apply a "twofold correction factor." However, it is unclear whether this correction is applied during the training phase, the prediction phase, or both. If the correction is applied only during the prediction phase while the training phase uses uncorrected data, this would lead to a distribution mismatch between training and inference.
Re: Thanks for the comments. During model construction, the TAP dataset was not adopted. Instead, the model was developed solely based on observational data from several monitoring sites. In this study, the TAP dataset was only utilized to derive region-scale CCN number concentrations using the established model.
As described in the Methods section (Section 2.2), all chemical composition data used for model training and testing were derived from ground-based observations. See Lines 125-130:
“…The main dataset that are used to construct the ML-based NCCN prediction model were from six field campaigns at three sites in the NCP (more details see section 2.3.1). The observed CCN number concentration (at supersaturations of 0.2% and 0.4%) is as targeted parameter, and the simultaneously measured atmospheric gaseous precursors, fine particles chemical compositions, and meteorological parameters are as model input parameters…”
The TAP dataset was used exclusively for the regional-scale and interannual predictions. Prior to using the TAP data, we first compared its chemical components with collocated ground-based observations. This comparison revealed a systematic underestimation of OM and sulfate in the TAP dataset (approximately 50%). To ensure consistency between the model input during prediction and the observed data used for training, we therefore applied a twofold correction factor only to the OM and sulfate concentrations from the TAP dataset during the prediction phase.
See Lines 163-166: “…Compared with the observations at the BJ site, mass concentrations for the OM and sulfate from TAP dataset were largely underestimated by approximately 50% (Fig. S1). Therefore, a twofold correction factor was applied to these components when estimating the regional scale and interannual CCN concentrations in NCP…”
Line 199-201 and 276-277: The sentence "the campaign mean mass concentration of PM2.5 ranges from 35.6 to 160 μg m-3, indicating that the observations can represent various atmospheric conditions" is repetitive with the introduction in Section 2.3.1.
Re: The sentence in Lines 201-203 has been revised as: “The observed NCCN varies from a few hundred to tens of thousands at these sites, indicating that the observations can represent various atmospheric conditions.”
Line 236: The authors interpret the SHAP values as evidence that OM has strong hygroscopicity driving CCN activation. However, SHAP values reflect association rather than causation. It is recommended to add a qualifying statement: “While SHAP indicates a strong association, the causal interpretation should be supported by the known hygroscopicity of OM in the NCP (Liu et al., 2021).”
Re: Thank you for your insightful comment. Yes, the SHAP value explains the potential influence of model predictors on the predicted CCN concentration. The wide range of SHAP values for OM reflects the diversity of its physicochemical properties—OM can act either as an inhibitor of CCN activation or as a strong promoter. Low SHAP values may arise from freshly emitted hydrophobic OM, which suppresses CCN activation and contributes little or even negatively. In contrast, high SHAP values correspond to aged/oxidized OM with enhanced hygroscopicity, which significantly promotes CCN activation. We have added some explanation as follows or see Lines 236-254:
“…Organic matter emerges as the most crucial indicator with the highest SHAP value. The wide range of SHAP values for OM reflects the diversity of its physicochemical properties. Specifically, low-concentration or freshly emitted hydrophobic OM contributes negatively to NCCN (suppressing activation), whereas high-concentration or aged/oxidized OM contributes positively (promoting activation). From an overall perspective, SHAP values increase monotonically with OM concentration, and the absolute values of positive SHAP values exceed those of negative ones, demonstrating a synergistic positive effect of OM concentration on the variation of CCN number concentration. This finding differs from the conventional view that inorganic salts contribute more to CCN due to their strong hygroscopicity (Petters and Kreidenweis, 2007). However, in fact, we also note that under conditions of high OM, the concentrations of CN and CCN indeed show an increasing trend (Fig. S5). In addition, previous studies have shown that in the North China region where the proportion and concentration of OM are both high, organic particles affected by strong anthropogenic emission sources was found exhibit strong hygroscopicity, enabling them to serve as more effective CCN (Liu et al., 2021); in addition, the surface tension lowering effect of OM particles in this region can also enhance particle CCN activity (Fan et al., 2024). Therefore, the SHAP analysis results further confirm the conclusions of previous studies…”
Line 289: "During the GC2018_WIN campaign, the observed NCCN is underestimated by as much as 71% by WRF-Chem (Fig. S6). Here, it might be referring to Fig. S5?"
Re: In the revised text, it referred to Fig. S6.
Lin 289-296: It notes that the model's performance improves much more during severely polluted winter conditions than during cleaner summer conditions. It is recommended to emphasize more explicitly in the Conclusions that the improvement is particularly pronounced under highly polluted (cold-season) conditions, which has practical implications for CCN prediction in heavily polluted regions.
Re: Thank you for this suggestion. In response, we have revised the Conclusions section to explicitly state that the model's improvement is particularly pronounced under severely polluted (cold-season) conditions. The sentence has been added as follows or see Lines 476-481: “…The results show that the prediction bias of NCCN compared to observations is approximately -31% from the RFRM model. Good accuracy has also been achieved during heavy pollution periods or cold seasons. This improvement is much more pronounced under severely polluted winter conditions, demonstrating the model's particular value for CCN prediction in heavily polluted environments…”
Line 297: “The improvements in RFRM model also demonstrate the effectiveness of the model trained on atmospheric variables to revise the simulation in model”. The phrase “in model” at the end of the sentence is unclear in meaning.
Re: Revised. See follows: “The improvements in RFRM model also demonstrate the effectiveness of the model trained on atmospheric variables to revise the simulation in WRF-Chem model.”
Line 298: The article has already used another observation at GC site to provide independent spatiotemporal validation. This should be discussed in detail to demonstrate that the model's generalizability has been effectively verified.
Re: Revised. The sentences have been added as follows or see Lines 311-316:
“… In addition, we also evaluated the model performance based on another observation at GC site in January (Zhang et al., 2020) (Fig. S7). Compared to WRF-Chem simulations, the RFRM model could more accurately captures the peak and valley CCN concentrations. The mode showed the greatest improvement and the underestimation is largely improved with the predicted bias of only 4% in the RFRM model (Fig. S7) …”
Line 307: “the underestimation of NCCN by the WRF-Chem model is likely due to the overestimation of the organics and BC mass fraction induced by WRF-Chem (Fig. S8), but the underestimation of the hygroscopic parameter of organics, and the simplified prescriptions in particle size distribution”. “But the clauses before and after 'but' do not indicate a contrast.”
Re: The sentences have been revised as follows or see Lines 322-325: “…the underestimation of NCCN by the WRF-Chem model is likely due to the overestimation of the organics and BC mass fraction induced by WRF-Chem (Fig. S9), along with the underestimation of the hygroscopic parameter of organics, and the simplified prescriptions in particle size distribution...”
Line 329: Here they used long-term PNSD measurements and κ-Köhler theory to calculate the "observed" annual mean NCCN (NCCN_obs). However, the κ values themselves are derived from the TAP dataset (which is biased even after correction). Moreover, the authors note that "κ values are much less sensitive to changes in NCCN compared to the PNSD" (Lines 345–347). A sensitivity analysis is needed to quantify the impact of κ uncertainty on the final NCCN _obs.
Re: Thanks for the comments. The sensitivity analysis was shown in Fig. R1. Revised see follows or Lines 360-371:Fig. R1 Average annual value of the κchem calculated from chemical composition (a), the critical diameter at S=0.2% (b), NCCN at S=0.2% (c), the mass fraction (d) between the observed and TAP dataset in the winter of 2014, 2016, 2018.
“…A comparison of the values of κ and NCCN between that derived using field observations and the TAP dataset shows little differences (Fig. S10); actually, the long-term change of NCCN is much less sensitive to changes in κ values compared to the PNSD (Fig. S10c). Sensitivity analysis showed that a ±20% change in κ leads to a change in NCCN of approximately ±8%. Comparing the κchem derived from the TAP method and the OBS method, the difference is approximately ±6%, the estimated deviation in the critical activation diameter ranges from -2% to 3%. Although absolute concentrations of components in the TAP dataset deviate from observations, their mass fractions are consistent (Fig. S10d), rendering the impact on the calculated κ negligible. In addition, the method to calculate NCCN at S=0.2% based on κ-Köhler theory would cause an upper-limit uncertainty of 7% (Ren et al., 2018) …”
Line 476: In the “Limitations and outlook” section, the authors honestly acknowledge that the observational data come from only six campaigns at three sites. It is recommended to add a discussion on the spatiotemporal representativeness of these observations.
Re: Thank you for your suggestion. We have added the following discussion in the “Limitations and outlook" section, see Lines 501-511:
“…Second, this study analyzes observational data from six campaigns conducted at three sites. Although the number of sites is limited, these sites represent urban, suburban, and regional background conditions, respectively, and the observation periods cover different seasons and years. Therefore, the current dataset can reasonably characterize the overall aerosol and CCN conditions in North China, and may also provide useful implications for other polluted regions with similar emission characteristics. Validating the simulated NCCN through comparisons with observations at more ground sites is warranted in future. Also, it is crucial to obtain comprehensive monitoring data of CCN and other key aerosol properties (e.g., particle size distribution, chemical compositions) in different environments…”
Line 732: Figure 2 shows an R² of 0.86–0.95 for the test set, but Figure 3c shows an R² of only 0.86 (RFRM vs. observations). These two R² values are calculated for different targets (the former may be RFRM vs. WRF-Chem? The latter is RFRM vs. observations). This should be clearly stated in the figure captions.
Re: Figure 2 presents the results on the test set, while Figure 3 presents the results on the validation set for the selected independent cases of the six campaigns. The caption of Figure 3 has already been revised see follows: “Fig. 3 Performance of the RFRM model in predicting NCCN at field sites in NCP. (a) Time series of the observed and predicted NCCN at S=0.2% for the six periods (BJ2015_AUT, BJ2017_SUM, XT2016_SUM, BJ2014_WIN, BJ2016_WIN, GC2018_WIN) in the North China Plain for the validation set.”
Line 732: In Figure 2b, the SHAP plot lacks units or dimensions. Please clarify in the caption: “SHAP values represent the contribution to NCCN (in cm⁻³).”
Re: Revised.
Line 737: Use NCCN consistently throughout the manuscript. For example, in the title of Fig. 3 on page 34, it reads “Time series of the observed and predicted CCN number concentrations”, while the axis label reads “NCCN (cm⁻³)”
Re: The caption has been revised.
The manuscript uses both "RFRM" (Random Forest Regression Method) and "RF model" (line 138). It is recommended to use "RFRM model" consistently throughout.
Re: Revised.
-
AC1: 'Reply on RC1', Fang Zhang, 01 Jul 2026
-
RC2: 'Comment on egusphere-2026-1347', Anonymous Referee #2, 05 Jun 2026
The authors present a framework combining multi-source data with Random Forest Regression to predict CCN concentrations. The significant improvement in prediction accuracy over the traditional WRF-Chem model, particularly in capturing long-term trends in the North China Plain. This study bridges the observation gap and highlights the climate benefits of emission controls. The methodology is sound, and the results are compelling. I recommend publication after minor revisions.
- Organic matter was found to be the most crucial indicator for the CCN concentration prediction. The results are interesting; the inorganic salts are always thought to have high potential for the CCN. More explanation is needed here, if the number concentrations would increase under the high OM conditions?
- The influence of temperature showed the bidirectional influence, whether the temperature would influence the emission sources or the chemical reaction in the atmosphere.
- The ratio between POA and SOA is important for the number of CCN. Can the model separate these two components? How about the performance of the simulation?
- A few sites near the coast with positive values in recent years, why accumulation-mode particles increase, more discussion would be helpful.
Citation: https://doi.org/10.5194/egusphere-2026-1347-RC2 -
AC2: 'Reply on RC2', Fang Zhang, 01 Jul 2026
Response to the reviewers
Referee #2
The authors present a framework combining multi-source data with Random Forest Regression to predict CCN concentrations. The significant improvement in prediction accuracy over the traditional WRF-Chem model, particularly in capturing long-term trends in the North China Plain. This study bridges the observation gap and highlights the climate benefits of emission controls. The methodology is sound, and the results are compelling. I recommend publication after minor revisions.
Re: We deeply appreciate the time and effort that the reviewers have dedicated to evaluating our manuscript. We believe that the revised version has been greatly improved in terms of the rationality of the model development methodology and the reliability of the results.
- Organic matter was found to be the most crucial indicator for the CCN concentration prediction. The results are interesting; the inorganic salts are always thought to have high potential for the CCN. More explanation is needed here, if the number concentrations would increase under the high OM conditions?
Re: Thank you for your insightful comment. In this study, organic matter constitutes 20–90% of the aerosol mass in the North China Plain. Although OM is generally less hygroscopic than inorganic salts, its large mass fraction can compensate for its lower hygroscopicity, leading to a significant overall impact on CCN activation. In addition, recent studies have shown that OM can be partially hygroscopic or even surface-active, especially after aging and oxidation. Oxygenated organic aerosols can exhibit κ values comparable to those of some inorganic species. Moreover, OM can internally mix with inorganic salts, thereby altering the overall hygroscopicity of the particles. And we also noted that the CN number concentration would increase under the high OM conditions as shown in Fig. R1, further suggesting the OM can serve as the potential seed for CCN.
We have added some explanation as follows or see Lines 236-254:
“…Organic matter emerges as the most crucial indicator with the highest SHAP value. The wide range of SHAP values for OM reflects the diversity of its physicochemical properties. Specifically, low-concentration or freshly emitted hydrophobic OM contributes negatively to NCCN (suppressing activation), whereas high-concentration or aged/oxidized OM contributes positively (promoting activation). From an overall perspective, SHAP values increase monotonically with OM concentration, and the absolute values of positive SHAP values exceed those of negative ones, demonstrating a synergistic positive effect of OM concentration on the variation of CCN number concentration. This finding differs from the conventional view that inorganic salts contribute more to CCN due to their strong hygroscopicity (Petters and Kreidenweis, 2007). However, in fact, we also note that under conditions of high OM, the concentrations of CN and CCN indeed show an increasing trend (Fig. S5). In addition, previous studies have shown that in the North China region where the proportion and concentration of OM are both high, organic particles affected by strong anthropogenic emission sources was found exhibit strong hygroscopicity, enabling them to serve as more effective CCN (Liu et al., 2021); in addition, the surface tension lowering effect of OM particles in this region can also enhance particle CCN activity (Fan et al., 2024). Therefore, the SHAP analysis results further confirm the conclusions of previous studies…”
- The influence of temperature showed the bidirectional influence, whether the temperature would influence the emission sources or the chemical reaction in the atmosphere.
Re: Thanks for the comments. The SHAP analysis reveals a bidirectional nonlinear influence of temperature on CCN prediction, reflecting the dual regulatory role of temperature on emission sources and atmospheric chemical reactions. On the one hand, elevated temperatures promote VOC emissions and photochemical reactions, enhance the formation and aging of secondary organic aerosol (SOA), and increase particle hygroscopicity. On the other hand, low temperatures facilitate gas-particle partitioning, while high temperatures may accelerate new particle formation but suppress nucleation rates. These competing mechanisms collectively contribute to the observed bidirectional influence of temperature, which is consistent with the findings of Song et al. (2022) regarding the nonlinear modulation of CCN activity by temperature. We have added some explanation as follows or see Lines 267-275:
“…Temperature demonstrated a bidirectional influence, suggesting nonlinear modulation of CCN activity potentially associated with the temperature dependence of nucleation growth and secondary generation of particles (Song et al., 2022). Specifically, temperature-driven enhancements in emissions exacerbate the formation of secondary organic aerosols, thereby affecting CCN concentrations (Lian et al., 2025). In addition, temperature significantly influences aerosol formation, aging, and transformation processes by regulating photochemical reaction rates, particle aging processes, and gas-particle partitioning, which in turn affect nucleation processes and exert important impacts on CCN concentrations…”
- The ratio between POA and SOA is important for the number of CCN. Can the model separate these two components? How about the performance of the simulation?
Re: Thank you for your suggestion. The RFRM model used in this study takes OM mass concentration as input and does not distinguish between primary organic aerosol (POA) and secondary organic aerosol (SOA). This is because we used the TAP dataset for spatiotemporal prediction, which does not provide detailed POA and SOA information. The high SHAP importance of OM indirectly suggests that incorporating POA and SOA information could have a significant impact on CCN prediction. In the future, introducing the POA/SOA ratio as a feature may further improve the model's interpretability.
- A few sites near the coast with positive values in recent years, why accumulation-mode particles increase, more discussion would be helpful.
Re: The positive trends in accumulation-mode particles at coastal sites can be explained as: first, enhanced primary combustion emissions from sources other than on-road vehicles (e.g., industrial and residential coal burning) (Zhu et al., 2021); sea salt contributions a substantial source of accumulation-mode particles under marine air influence (Zou et al., 2024). And previous studies have demonstrated that baseline sea spray fluxes contribute approximately 50% of the submicron particle number flux in the accumulation mode even under clean marine conditions (Geever et al., 2005). Some explanations have been added as follows or see Lines 400-408:
“…Interestingly, note a few sites with positive values (upward trends in NCCN) are mainly located along the coast. An increase in the fraction of accumulation-mode particles in coastal areas has been reported contributing more CCN (Zhu et al., 2021). In fact, previous studies have revealed that in Qingdao, enhanced primary combustion emissions from sources other than on-road vehicles (e.g., industrial and residential coal burning) serve as the main driver of increased accumulation-mode number concentrations (Zhu et al., 2021). Furthermore, coastal observations have identified sea salt aerosols as an important source of accumulation-mode particles (Zou et al., 2024) …”
References:
Fan, T., Ren, J., Liu, C., Li, Z., Liu, J., Sun, Y., et al.: Evidence of surface‐tension lowering of atmospheric aerosols by organics from field observations in an urban atmosphere: Relation to particle size and chemical composition, Environmental Science & Technology, 58(26), 11363–11375. https://doi.org/10.1021/acs.est.4c03141, 2024.
Liu, J., Zhang, F., Xu, W. et al.: Hygroscopicity of organic aerosols linked to formation mechanisms, Geophysical Research Letters, 48, https://doi.org/10.1029/2020GL091683, 2021.
Petters, M. D., Kreidenweis, S. M.: A single parameter representation of hygroscopic growth and cloud condensation nucleus activity, Atmos. Chem. Phys., 7(8), 1961–1971, https://doi.org/10.5194/acp-7-1961-2007, 2007.
Song, C., Becagli, S., Beddows, D. C. S. et al.: Understanding Sources and Drivers of Size-Resolved Aerosol in the High Arctic Islands of Svalbard Using a Receptor Model Coupled with Machine Learning, Environmental Science & Technology, 56(16), 11189–11198, https://doi.org/10.1021/acs.est.1c07796, 2022.
Lian, J., Wang, Y., Li, K., Zhang, R., and Smith, D. M.: Nature of temperature-induced phase transitions in secondary organic aerosol particles, Environmental Science & Technology, 59(45), 24359–24367, https://doi.org/10.1021/acs.est.5c08582, 2025.
Zhu, Y., Shen, Y., Li, K. et al.: Investigation of particle number concentrations and new particle formation with largely reduced air pollutant emissions at a coastal semi-urban site in northern China, Journal of Geophysical Research: Atmospheres, 126, e2021JD035419, https://doi.org/10.1029/2021JD035419, 2021.
Geever, M., O'Dowd, C. D., van Ekeren, S., Flanagan, R., Nilsson, E. D., de Leeuw, G., & Kulmala, M.: Submicron sea spray fluxes. Geophysical Research Letters, 32(15), L15810, https://doi.org/10.1029/2005GL023081, 2005.
Zou, S., Chen, L., Xu, H., Zhang, R., Liu, M., Liu, G., Ye, J., Yang, H., Wu, H., Yang, Y., & Zhang, F.: Observed size-dependent effect of the marine air on aerosols hygroscopicity at a coastal site of Shenzhen, China, Atmospheric Research, 315, 107835. https://doi.org/10.1016/j.atmosres.2024.107830, 2024.
Peer review completion
Journal article(s) based on this preprint
Viewed
| HTML | XML | Total | Supplement | BibTeX | EndNote | |
|---|---|---|---|---|---|---|
| 310 | 92 | 49 | 451 | 66 | 46 | 39 |
- HTML: 310
- PDF: 92
- XML: 49
- Total: 451
- Supplement: 66
- BibTeX: 46
- EndNote: 39
Viewed (geographical distribution)
| Country | # | Views | % |
|---|
| Total: | 0 |
| HTML: | 0 |
| PDF: | 0 |
| XML: | 0 |
- 1
Jingye Ren
Songjian Zou
Honghao Xu
Guiquan Liu
Zhe Wang
Anran Zhang
Chuanfeng Zhao
Dongjie Shang
Lizi Tang
Ru-Jin Huang

The requested preprint has a corresponding peer-reviewed final revised paper. You are encouraged to refer to the final revised version.
- Preprint
(2107 KB) - Metadata XML
-
Supplement
(1516 KB) - BibTeX
- EndNote
- Final revised paper