
the Creative Commons Attribution 4.0 License.
the Creative Commons Attribution 4.0 License.
 | 06 Mar 2026
Automated Detection of Low-altitude Isolated Mesospheric Radar Echoes Using YOLOv8: Evidence for a C-Layer Phenomenon near 60 km Altitude?
Abstract. The Earth's ionosphere is created by the incident solar radiation and extends from approximately 60 km to 800 km altitude. Within the ionosphere distinct regions are formed based on the number density of the dominant chemical species and their ionization by the incident solar ultraviolet radiation and X rays. The lowermost ionospheric region is called D region and expands during daytime downwards to approximately 60km. In the recent years, rather faint echoes from below the typically continuous D region have been observed during the sunlit period using a 3.17 MHz ground based radar system at polar latitudes. To our knowledge, this study might be the first evidence of such a phenomenon through consistent radar observations. Following an initial manual inspection of the raw data and the corresponding radar image spectra, an automated deep learning approach was employed to detect these isolated low-altitude echoes. We used the pattern recognition tool YOLO (You Only Look Once) to gain statistical information on the occurrence of these radar echoes over four years of radar measurements, which covered conditions ranging from minimum to maximum solar activity. The preferred altitude of these radar echoes is found to be near 58 km with typically little variability, and where the majority of detections show a rather narrow radar spectrum. Substantial annual variability was found for these parameters and the occurrence rate, essentially separating them into summer and winter. The reduced occurrence rates during the solar maximum year 2024 suggest the role of galactic cosmic rays as an ionisation source.
-
Notice on discussion status
The requested preprint has a corresponding peer-reviewed final revised paper. You are encouraged to refer to the final revised version.
-
Preprint
(3142 KB)
-
The requested preprint has a corresponding peer-reviewed final revised paper. You are encouraged to refer to the final revised version.
- Preprint
(3142 KB) - Metadata XML
- BibTeX
- EndNote
- Final revised paper


Journal article(s) based on this preprint
Interactive discussion
Status: closed
-
RC1: 'Comment on egusphere-2026-1030', David Holdsworth, 18 Mar 2026
-
CC1: 'Reply on RC1', Toralf Renkwitz, 10 Apr 2026
We like to thank the reviewer for the thorough reading of the manuscript and also suggesting many possible improvements. This is certainly much appreciated.
Our answers are attached in the PDF, marked in red. Remaining points that were addressed will be answered separately.
-
RC4: 'Reply on CC1', David Holdsworth, 17 Apr 2026
Thank you Toralf for your response to my comments. Some further comments and clarification follow:
- Regarding the comment in the Hocking & Vincent paper "The peak at 62 km for 2 MHz is a ground echo effect“, apologies for missing this. I thought this was stated in the paper but in my quick scan through the paper when reviewing your paper I missed this! Based on my experience with Buckland Park data I don't agree with that comment, but this has not been refuted in publication so You are right to make this point.
- Regarding my comment on line 252, I meant that I could not make sense of this sentence. It seemed to me that there may be missing words.
I am happy with your responses to my other points.
Citation: https://doi.org/10.5194/egusphere-2026-1030-RC4
-
RC4: 'Reply on CC1', David Holdsworth, 17 Apr 2026
-
AC1: 'Reply on RC1', Yadu Krishnan Krishnakumar, 10 Apr 2026
We appreciate the reviewer's careful reading and constructive suggestions. Our replies (marked in blue) to the remaining comments are provided in the attachment.
-
RC5: 'Reply on AC1', David Holdsworth, 17 Apr 2026
Thanks Yadu for your response to my comments. Including the information you provided in your response in the paper will definitely help the reader who has no ML background understand the technique.
Citation: https://doi.org/10.5194/egusphere-2026-1030-RC5
-
RC5: 'Reply on AC1', David Holdsworth, 17 Apr 2026
-
CC1: 'Reply on RC1', Toralf Renkwitz, 10 Apr 2026
-
RC2: 'Comment on egusphere-2026-1030', Anonymous Referee #2, 26 Mar 2026
The authors present a statistical study of Saura radar echoes from ~58km altitude, classified using the YOLO pattern recognition tool. They argue that these echoes may be caused by ionization from galactic cosmic rays and describe the phenomenon as a potential ‘C-layer’.
I found the preparation of the manuscript to be somewhat sloppy and many of its claims to be exaggerated or speculative. However, the radar detections themselves are interesting and, to my knowledge at least, novel and worthy of publication. Therefore I recommend major revisions for the paper.
The authors should remove any claim of a “C-layer phenomenon” from the title and body of the manuscript. The presentation of the work should be reoriented towards the important central findings (occurrence rates, characteristics etc.) and away from process issues (choice of computer tool etc.) and speculative conclusions.
Major comments:
- Novelty claim is overstated
Previous studies cited by the authors have reported similar low-altitude reflecting layers (e.g., Rasmussen et al., 1980; Bain & Kossey, 1987). The authors should reframe the novelty as systematic detection and characterization rather than first discovery – in particular the term “first evidence” should not be used.
- Physical interpretation is speculative
The proposed link to galactic cosmic rays is not sufficiently supported. Correlations with solar flux are weak and no quantitative ionization modeling is presented.
- Limited training dataset
The YOLO model is trained on only 200 images, which may introduce selection bias and limit generalization.
- Subjective ground truth
Manual labeling introduces subjectivity. Clearer quantitative criteria for LIME identification are needed.
- Single-instrument limitation
All results rely on one radar system, limiting generalizability. How do these results compare to VLF/LF data, or to data from optical/other instruments? A 3 MHz plasma layer (equivalent to 10^5 el. m-3) should be easily visible using ionosonde data, with suitable processing. Particle or FUV data (see e.g. DMSP) could be used to test for energetic precipitation.
- Alternative explanations
Other mechanisms (e.g., turbulence, gravity waves) are not sufficiently explored. How do we know this scattering is really caused by ionization, and that the ionization is unrelated to energetic particle precipitation? Could it be mono-energetic precipitation?
Minor comments:
- Improve figure labeling (units, descriptions etc)
- Clarify uncertainties
- Check spelling and grammar
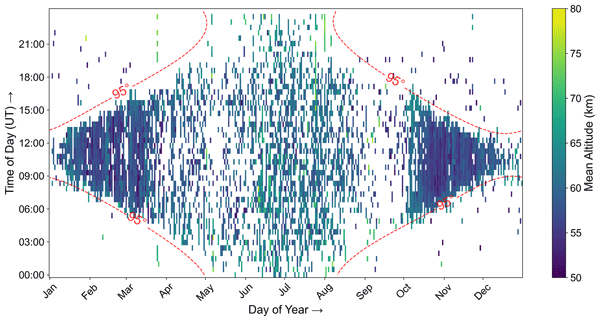
- why was a ~63-km layer chosen for Fig 1a when the abstract claims most of these are ~58 km? The claim in the abstract should be rephrased in terms of mean and standard deviation of the LIME detection altitude – Fig 9 makes it clear that a relatively broad range of altitudes is present.
- What do the authors make of the apparent October-March (and then June-August) concentration of detections, in terms of physical mechanisms? Doesn’t it look like two separate phenomena, considering also the spectral width variation? If so, maybe two terms are needed rather than just “LIME” for both?
Citation: https://doi.org/10.5194/egusphere-2026-1030-RC2 -
CC2: 'Reply on RC2', Toralf Renkwitz, 10 Apr 2026
We thank the reviewer for the valuable points addressed based on our submitted manuscript. The comments are certainly helpful in improving it for the next revision.
Our answers are attached in the PDF, marked in red. Remaining points that were addressed will be answered separately.
-
AC2: 'Reply on RC2', Yadu Krishnan Krishnakumar, 10 Apr 2026
We thank the reviewer for the thorough and constructive comments on our manuscript. The suggestions have been carefully considered and are certainly helpful in improving the revised version. Please find our answers (marked in blue) to the remaining points in the attached PDF.
-
RC3: 'Comment on egusphere-2026-1030', Anonymous Referee #3, 16 Apr 2026
“Automated Detection of Low-altitude Isolated Mesospheric Radar Echoes Using YOLOv8: Evidence for a C-Layer Phenomenon near 60 km Altitude?” by Yadu Krishnan Krishnakumar, Toralf Renkwitz, and Andreas Ahrens deals with isolated MF radar echoes in the lower mesosphere in the Arctic. Different from echoes often observed under disturbed conditions by MF radars also in polar lower mesosphere, these echoes are detected under rather quiet conditions. The nature of these echoes and discussion on their possible sources are very interesting and can be worthy of publication in EGUsphere. The description in the manuscript is, however, largely imbalanced, with too much emphasis on the machine learning technique and at the same time lacking sufficient citations to the existing references, technical background of the radar system and also quantitative science discussion. I therefore recommend a major revision before the manuscript becomes suitable for publication.
MAJOR COMMENTS:
A significant part of the manuscript is for the explanation on how to use YOLO and its usefulness in the ‘LIME’ detection. Because EGUsphere is a journal of Earth, Space, and Planetary sciences, the description for the machine learning technique should be more compact and efficiently summarized, and more science discussion should be made instead. That said, I understand that such machine learning techniques are very useful in geoscience studies. If the description of technical details of the machine learning approach is a major point of this work, the paper should be separated into two, one for a technical report and the other one for a science paper.
In the YOLO detection the definition and the threshold of the following values are quite vague probably due to the nature of machine learning approach.
- definition and threshold of LIME, VOID and D region echoes
- height width
- frequency width
- height separation between LIME and D region echoes
Once the detection is made, I would re-evaluate these widths and separation by a fitting technique with a clear threshold setting to avoid vagueness. What the authors claim ‘frequency width’ is the apparent region where the frequency enhancement is seen, not the same with the width related to turbulence activity. It is also not known if the spectral width of MF echoes is a simple measure of turbulence activity. The frequency widening due to turbulence is usually evaluated by a Gaussian fitting to the MST radar spectrum, values evaluated through which are independent of echo intensity. The description around Line 276 is therefore inappropriate although turbulence can affect MF spectra.
In Introduction the authors need to explain more about the history of low altitude mesosphere echo studies in the polar region, especially in winter, adequately referencing previous studies both in the Arctic and Antarctic such as Hall et al. , ACP (2006), Morris et al., GRL (2011), Renkwitz and Latteck (2017), Nishiyama et al. , JGR (2018) and other PMWE related papers before they declare at around the line 38 that they deal with non-EPP type echoes. The authors need to make the differences even clearer between the existing works and the current work if there are such differences. Because the study of low altitude mesosphere echoes in the polar region has a rather long history, readers will be confused and may not be able to understand the most important point the authors claim.
The term LIME introduced in the present study is awfully confusing and inappropriate. Hall et al. (2006) introduced ILME (Isolated Lower Mesosphere Echoes) for MF radar echoes observed under disturbed conditions over Tromsoe (69N), which were thought to be strongly related to VHF radar echoes widely known as PMWEs. LIME and ILME are composed of the initials of exactly the same 4 words with only a different order. The term ILME has been used in the radar studies since Hall et al. and appeared at least in several papers to my knowledge, including Renkwitz and Latteck (2017). According to what the authors claim, these two abbreviations correspond to different background conditions, that is, disturbed and quiet. If so, this confusing naming should be avoided. I also feel that introducing LIME without mentioning Hall et al. (2006) is hugely disrespectful to the late Prof Hall.
The technical details of the Saura MF system are missing, which are only briefly mentioned in Conclusions. It is one of the largest MF radars together with the Adelaide radar, and only large one in the polar region. The sensitivity is thought to be significantly higher than the other existing conventional broad beam systems, making much easier the detection of lower altitude echoes even under non-EPP conditions. The sharp beam operation is also advantageous in suppressing unwanted off-vertical echoes resulting in a better height resolution with much less range smearing. Such technical differences from the conventional systems should be emphasized quantitatively in Introduction to claim the uniqueness of the current study.
The conditions for MF echoes to be detected should be mentioned and discussed more clearly by citing appropriate manuscripts: enough electron density to increase the refractive index, something such as atmospheric turbulences to fluctuate the index, and possibly something to reduce the mobility of ions such as NOx for coherent detection. The difference of O and X modes also needs to be explained together with the reason of selecting X mode in this study (e.g., Renkwitz and Latteck, 2017; Vierinen et al., 2013). While such background information is only very briefly scattered in the present manuscript and mentioned some in Lines 316-321, it should be more collectively summarized, perhaps in Introduction. Additional information on how O mode echoes look like will also be helpful for a better understanding.
Regarding the refractive index fluctuations, turbulence activity is a key as the authors briefly mention. Atmospheric waves are believed to be largely responsible for the turbulence generation. Because of the nature of atmospheric stability, turbulences are generated more preferably at unstable phases of atmospheric waves, not necessarily all through the existing height region of those waves. MST radar observations, usually with better height resolutions than MF radars, often show layered structures as seen in Figure 3 (d) of Nishiyama et al. (2018) (see the two layered structure on May 28, 2013). Keeping this in mind, are there any possibilities that the isolated structure of ‘LIME’ is, at least partly, related to this layered turbulence structure? I presume that under moderately disturbed conditions (weak EPP) an MF radar, especially the sensitive Saura radar, could measure echoes from a wide height region (50-90km) with stronger echoes at unstable heights, resulting in an apparent structure seen as ‘LIME’. The isolated echoes around 55 km of MF radar on May 29, 2013 seen in Figure 3 (c )of Nishiyama et al. (2018) might be such an example, where the MST radar echoes are only weakly detected in Figure 3 (d).
In the VOID areas seen in Figures 1, 4 and 7 of the manuscript, I see weak echoing region between LIME and D region echoes. As I mentioned, this kind of patchy structures are quite common in sharp beam MST radar measurements. So it would also be a case for a powerful high resolution MF radar such as Saura system.
GCRs can be a steady source of the low altitude echoes. References about ionization will be necessary around Line 323. However, the discussion about GCRs is still only speculative. If the same kind of echoes are not detected at other sites, especially at Juliusruh, necessary conditions for MF radar detection may be more quantitatively estimated considering the technical (power/gain) and latitudinal (GCR) differences.
MINOR COMMENTS
For grammatical errors or suggestion, see comments by other reviewers.
Figure 4
Is the grey hatch necessary?
Figure 8
Height width distribution is also wanted together with the separation distribution (VOID width).
Figures 9 and 10
Is the 95 degree measured on the ground? If so, the value will be significantly different in the mesosphere. A clear definition will be wanted to avoid confusion.
Figure 11
What is the maximum value? Detection rates may be more understandable rather than actual number. Does the median mean one of the 4 values corresponding to the 4 years? Why not average?
Citation: https://doi.org/10.5194/egusphere-2026-1030-RC3
Peer review completion


Interactive discussion
Status: closed
-
RC1: 'Comment on egusphere-2026-1030', David Holdsworth, 18 Mar 2026
Review of Automated Detection of Low-altitude Isolated Mesospheric Radar Echoes Using YOLOv8: Evidence for a C-Layer Phenomenon near 60 km Altitude?
This paper describes an automated deep learning approach for the detection of faint echoes at altitudes below the D-region as observed by the Saura HF radar. The authors used the pattern recognition tool YOLO (You Only Look Once) to derive statistical information on the occurrence of these radar echoes over four years of radar measurements. The preferred altitude of these radar echoes is found to be near 58 km, with substantial annual variability in the detection rate and altitude and spectral width parameters.
The paper is of significant interest to the ionospheric physics community but requires substantial revision to be acceptable for publication. The main issues are:
- There is no reference to any previous MF/HF radar measurements of similar low altitude layers.
- The explanation of the deep learning approach contains a lot of jargon which will not mean much to readers unfamiliar with the field. More explanations of the terms used are required.
- The English needs improving in some sections.
It is also peculiar that the authors reference the hypothetical “C-layer” in the title but do mention this layer at all in the article.
My review is divided into two sections. The first section includes issues that the authors need to address before the article is acceptable for publication. The second section includes suggested changes that will improve the readability of the article.
Issues to address
- In the abstract the authors state “this study might be the first evidence of such a phenomenon through consistent radar observations.” While it is true that these results represent the first long-term measurements of layered phenomena around 60 km, layers around this altitude have been reported previously by other authors. For instance, Hocking, W.K. and Vincent, R.A., 1982. Comparative observations of D region HF partial reflections at 2 and 6 MHz. Journal of Geophysical Research: Space Physics, 87(A9), pp.7615-7624, shows persistent layers at 62 km at 2 MHz (Figure 2). Furthermore, Holdsworth, D.A. and Reid, I.M., 1997. An investigation of biases in the full correlation analysis technique. Advances in Space Research, 20(6), pp.1269-1272, show a five-hour averaged SNR profile with a peak at around 57 km (Figure 4). There may well be other such example from early MF radar observations made in Saskatoon, Canada and Christchurch, New Zealand. I suggest the authors conduct a thorough search and acknowledge such observations in their article.
- Lines 328 and 358, The authors need to provide more evidence regarding their claim that “GCR represent a significant ionisation source for altitudes just below 60 km during solar minimum years”. This conclusion seems to be made solely on the results of Figure 14. While there appears to be an inverse correlation between sunspot number (i.e. solar cycle) and the detection of LIME, and there is a well-established inverse correlation sunspot number and the detection of GCRs, this does not imply GCRs are responsible for LIME. Correlation is not the same as causation. Having said that, I suspect the authors are likely correct, but the evidence presented is somewhat circumstantial. I strongly suggest the authors introduce the word “may” into the sentences on lines 328 and 358 – e.g. “which suggests GCR may represent a significant…”
- The authors frequently use the term “bottomside of the ionosphere” to describe the altitude region of interest. This is a misuse of the term, which is typically used to describe the entire ionosphere below the peak of the F-region electron density (hmF2). I strongly recommend the authors replace “bottomside of the ionosphere” with something like "lower ionosphere" or maybe "lower D-region".
- Line 69, “4-bit-complementary codes are frequently used to increase the average power”. This is incorrect. Complementary codes increase signal-to-noise (SNR) ratio and hence detectability, but they do not increase signal power.
- Line 100. What is the mean average precision index, and what do the numbers following mAP mean?
- Line 101. What is an “anchor”? Why is it used?
- Line 107. Define InSAR.
- Line 109. “detection accuracy of 96.76% mAP50”. What does this mean?
- Line 113. What are “convolutional layers”?
- Line 154, “The model was trained for 50 epochs”. What is meant by an epoch?
- Table 1, what do “optimizer” and “learning rate” mean?
- Line 158, define “confusion matrix”
- Line 209: “Training stabilised after approximately 30 epochs.” What metric is used to determine this stabilisation. The slope does not appear to change from epoch 10 onwards so I’m not sure how stabilisation can be deduced?
- Line 227, “The detections above 70 km appear to be outliers possibly caused
- by interference.” Is this the same kind of narrow-band interference that is seen at a Doppler shift of -0.35 in Figure 7. If so, it may be worth pointing this out so the reader can see what the interfering signals look like.
- Line 230: “representing the approximate boundary of daylight conditions”. I suggest you add “at the altitudes of interest” to this line.
- Line 230, “The vast majority of detections”. You later quote the number of detections occurring doe SZAs above 95 deg as 99%, so I suggest you add “(99%)” after “detections” so the reader does not have to get further into the paper to find out this number.
- Line 255, “While the quasi-simultaneous precipitation of similar energies occurs, and thus corresponding altitudes”. I don’t understand what the authors mean by this. I strongly suggest this sentence is re-written to make it clearer.
- Line 336, “prioritisation of detection reliability over completeness”. What do the authors mean by “completeness”. Do they mean visually checking all the spectra for LIME?
Suggestions for improved readability
- Some paragraphs do not start with an indentation, which affects readability. This includes all paragraphs in the introduction, section 2 and the start of section 3, and paragraphs starting on lines 132, 146, 157, 171, 201, 218, 225, 242, 262, 270, 275, 289, 296, 300, 305, 311, 342
- On the flip side to this, lines 187 and 194 start with an indent although they are do not appear to be new paragraphs.
- Line 1, created by incident solar radiation
- Line 4, In recent years
- Line 17, With the ionization of mostly nitrogen and oxygen, free electrons
- Line 21, very low frequencies of a few tens of kHz
- Line 23, probing the ionosphere for many
- Line 26, because its density is lower
- Line 27, rocket payloads have contributed significantly
- Line 28, very low frequency (VLF) transmissions have gained popularity
- Line 29, Another option is medium or
- Lines 59 and 255, “extend” should be “extent”
- Line 61, The observational data originates from
- Line 61, is capable of detecting echoes
- Line 64, and has since been employed
- Line 66, directions to, for example, measure
- Line 66, measure radial wind velocity
- Line 67, vertical wind velocities
- Line 67, by an antenna array of 31 antennas
- Line 70, the radar has 9 receiver channels, one of which is
- Line 72, interferometric purposes
- Line 75, The data originates from one
- Line 78, next section is based
- Line 79, calculated and processed
- Line 120, one focused solely
- Line 124, collected using the Saura radar
- Line 140, To ensure such spatial separation, the area
- Line 157, we used the standard object detection evaluation metrics: precision, recall, mAP50, and F1, as defined by equations (1) to (3).
- Line 177, suggest say “sufficient range separation” or “sufficient altitude separation.”
- Line 177, 3 hours to process each year of spectra.
- Line 194, km
- Line 220, delete “Similarly”
- Line 231, ”necessity of solar illumination for the generation of LIME.
- Line 232, “summer months”. Suggest you indicate which months are summer. Don’t assume all readers live in the Northern Hemisphere.
- Line 244, but the overall occurrence
- Figure 13 caption: Monthly mean occurrence rate of EPP in the mesosphere, detected by the Saura radar
- Line 257, the radar wave’s energy is strongly absorbed above that altitude
- Line 258, in the upper D region and above.
- Line 259, nor is it clearly
- Line 261, 60 km, which, however, still did not
- Lines 267 and 268, sunrise, sunset
- Line 270, possible relation between the appearance of LIME and solar activity
- Line 273, However, there is little correlation
- Line 283, more frequently occurring
- Line 285, associated with enhanced
- Line 298, also much smaller electron densities were required, and
- Line 308, in the examples shown, no clear separation between the ordinary D region echoes and the 60 km echoes is visible
- I suggest the paragraph starting line 311 is appended to the previous paragraph.
- Line 317, whereas they remain static most
- Line 322, one possible ionisation source, galactic cosmic rays (GCR), may easily reach lower atmospheric altitudes, and are measured on or above the ground, e.g. by stratospheric balloons.
- Line 328, GCR represent a significant ionisation source for altitudes just below 60 km during solar minimum years.
- Line 341, altitudes near 60 km which are clearly separated in altitude from
- Line 344, manual inspection
- Line 345, Therefore,
- Line 346, power spectra for four years
- Line 350, these rarely described
- Line 353, during which the echoes show enhanced spectral
- Line 354, with smaller spectral width
- Line 355, the echoes are seen near 62 km.
- Line 359, statistics, and may strengthen or clarify the speculated
- Line 367, responsibility for the radar
- Line 373, The authors would like to. Also, expand the acronyms UIT and IAP.
- Line 392, in the D- and E-region based
Citation: https://doi.org/10.5194/egusphere-2026-1030-RC1 -
CC1: 'Reply on RC1', Toralf Renkwitz, 10 Apr 2026
We like to thank the reviewer for the thorough reading of the manuscript and also suggesting many possible improvements. This is certainly much appreciated.
Our answers are attached in the PDF, marked in red. Remaining points that were addressed will be answered separately.
-
RC4: 'Reply on CC1', David Holdsworth, 17 Apr 2026
Thank you Toralf for your response to my comments. Some further comments and clarification follow:
- Regarding the comment in the Hocking & Vincent paper "The peak at 62 km for 2 MHz is a ground echo effect“, apologies for missing this. I thought this was stated in the paper but in my quick scan through the paper when reviewing your paper I missed this! Based on my experience with Buckland Park data I don't agree with that comment, but this has not been refuted in publication so You are right to make this point.
- Regarding my comment on line 252, I meant that I could not make sense of this sentence. It seemed to me that there may be missing words.
I am happy with your responses to my other points.
Citation: https://doi.org/10.5194/egusphere-2026-1030-RC4
-
RC4: 'Reply on CC1', David Holdsworth, 17 Apr 2026
-
AC1: 'Reply on RC1', Yadu Krishnan Krishnakumar, 10 Apr 2026
We appreciate the reviewer's careful reading and constructive suggestions. Our replies (marked in blue) to the remaining comments are provided in the attachment.
-
RC5: 'Reply on AC1', David Holdsworth, 17 Apr 2026
Thanks Yadu for your response to my comments. Including the information you provided in your response in the paper will definitely help the reader who has no ML background understand the technique.
Citation: https://doi.org/10.5194/egusphere-2026-1030-RC5
-
RC5: 'Reply on AC1', David Holdsworth, 17 Apr 2026
-
RC2: 'Comment on egusphere-2026-1030', Anonymous Referee #2, 26 Mar 2026
The authors present a statistical study of Saura radar echoes from ~58km altitude, classified using the YOLO pattern recognition tool. They argue that these echoes may be caused by ionization from galactic cosmic rays and describe the phenomenon as a potential ‘C-layer’.
I found the preparation of the manuscript to be somewhat sloppy and many of its claims to be exaggerated or speculative. However, the radar detections themselves are interesting and, to my knowledge at least, novel and worthy of publication. Therefore I recommend major revisions for the paper.
The authors should remove any claim of a “C-layer phenomenon” from the title and body of the manuscript. The presentation of the work should be reoriented towards the important central findings (occurrence rates, characteristics etc.) and away from process issues (choice of computer tool etc.) and speculative conclusions.
Major comments:
- Novelty claim is overstated
Previous studies cited by the authors have reported similar low-altitude reflecting layers (e.g., Rasmussen et al., 1980; Bain & Kossey, 1987). The authors should reframe the novelty as systematic detection and characterization rather than first discovery – in particular the term “first evidence” should not be used.
- Physical interpretation is speculative
The proposed link to galactic cosmic rays is not sufficiently supported. Correlations with solar flux are weak and no quantitative ionization modeling is presented.
- Limited training dataset
The YOLO model is trained on only 200 images, which may introduce selection bias and limit generalization.
- Subjective ground truth
Manual labeling introduces subjectivity. Clearer quantitative criteria for LIME identification are needed.
- Single-instrument limitation
All results rely on one radar system, limiting generalizability. How do these results compare to VLF/LF data, or to data from optical/other instruments? A 3 MHz plasma layer (equivalent to 10^5 el. m-3) should be easily visible using ionosonde data, with suitable processing. Particle or FUV data (see e.g. DMSP) could be used to test for energetic precipitation.
- Alternative explanations
Other mechanisms (e.g., turbulence, gravity waves) are not sufficiently explored. How do we know this scattering is really caused by ionization, and that the ionization is unrelated to energetic particle precipitation? Could it be mono-energetic precipitation?
Minor comments:
- Improve figure labeling (units, descriptions etc)
- Clarify uncertainties
- Check spelling and grammar
- why was a ~63-km layer chosen for Fig 1a when the abstract claims most of these are ~58 km? The claim in the abstract should be rephrased in terms of mean and standard deviation of the LIME detection altitude – Fig 9 makes it clear that a relatively broad range of altitudes is present.
- What do the authors make of the apparent October-March (and then June-August) concentration of detections, in terms of physical mechanisms? Doesn’t it look like two separate phenomena, considering also the spectral width variation? If so, maybe two terms are needed rather than just “LIME” for both?
Citation: https://doi.org/10.5194/egusphere-2026-1030-RC2 -
CC2: 'Reply on RC2', Toralf Renkwitz, 10 Apr 2026
We thank the reviewer for the valuable points addressed based on our submitted manuscript. The comments are certainly helpful in improving it for the next revision.
Our answers are attached in the PDF, marked in red. Remaining points that were addressed will be answered separately.
-
AC2: 'Reply on RC2', Yadu Krishnan Krishnakumar, 10 Apr 2026
We thank the reviewer for the thorough and constructive comments on our manuscript. The suggestions have been carefully considered and are certainly helpful in improving the revised version. Please find our answers (marked in blue) to the remaining points in the attached PDF.
-
RC3: 'Comment on egusphere-2026-1030', Anonymous Referee #3, 16 Apr 2026
“Automated Detection of Low-altitude Isolated Mesospheric Radar Echoes Using YOLOv8: Evidence for a C-Layer Phenomenon near 60 km Altitude?” by Yadu Krishnan Krishnakumar, Toralf Renkwitz, and Andreas Ahrens deals with isolated MF radar echoes in the lower mesosphere in the Arctic. Different from echoes often observed under disturbed conditions by MF radars also in polar lower mesosphere, these echoes are detected under rather quiet conditions. The nature of these echoes and discussion on their possible sources are very interesting and can be worthy of publication in EGUsphere. The description in the manuscript is, however, largely imbalanced, with too much emphasis on the machine learning technique and at the same time lacking sufficient citations to the existing references, technical background of the radar system and also quantitative science discussion. I therefore recommend a major revision before the manuscript becomes suitable for publication.
MAJOR COMMENTS:
A significant part of the manuscript is for the explanation on how to use YOLO and its usefulness in the ‘LIME’ detection. Because EGUsphere is a journal of Earth, Space, and Planetary sciences, the description for the machine learning technique should be more compact and efficiently summarized, and more science discussion should be made instead. That said, I understand that such machine learning techniques are very useful in geoscience studies. If the description of technical details of the machine learning approach is a major point of this work, the paper should be separated into two, one for a technical report and the other one for a science paper.
In the YOLO detection the definition and the threshold of the following values are quite vague probably due to the nature of machine learning approach.
- definition and threshold of LIME, VOID and D region echoes
- height width
- frequency width
- height separation between LIME and D region echoes
Once the detection is made, I would re-evaluate these widths and separation by a fitting technique with a clear threshold setting to avoid vagueness. What the authors claim ‘frequency width’ is the apparent region where the frequency enhancement is seen, not the same with the width related to turbulence activity. It is also not known if the spectral width of MF echoes is a simple measure of turbulence activity. The frequency widening due to turbulence is usually evaluated by a Gaussian fitting to the MST radar spectrum, values evaluated through which are independent of echo intensity. The description around Line 276 is therefore inappropriate although turbulence can affect MF spectra.
In Introduction the authors need to explain more about the history of low altitude mesosphere echo studies in the polar region, especially in winter, adequately referencing previous studies both in the Arctic and Antarctic such as Hall et al. , ACP (2006), Morris et al., GRL (2011), Renkwitz and Latteck (2017), Nishiyama et al. , JGR (2018) and other PMWE related papers before they declare at around the line 38 that they deal with non-EPP type echoes. The authors need to make the differences even clearer between the existing works and the current work if there are such differences. Because the study of low altitude mesosphere echoes in the polar region has a rather long history, readers will be confused and may not be able to understand the most important point the authors claim.
The term LIME introduced in the present study is awfully confusing and inappropriate. Hall et al. (2006) introduced ILME (Isolated Lower Mesosphere Echoes) for MF radar echoes observed under disturbed conditions over Tromsoe (69N), which were thought to be strongly related to VHF radar echoes widely known as PMWEs. LIME and ILME are composed of the initials of exactly the same 4 words with only a different order. The term ILME has been used in the radar studies since Hall et al. and appeared at least in several papers to my knowledge, including Renkwitz and Latteck (2017). According to what the authors claim, these two abbreviations correspond to different background conditions, that is, disturbed and quiet. If so, this confusing naming should be avoided. I also feel that introducing LIME without mentioning Hall et al. (2006) is hugely disrespectful to the late Prof Hall.
The technical details of the Saura MF system are missing, which are only briefly mentioned in Conclusions. It is one of the largest MF radars together with the Adelaide radar, and only large one in the polar region. The sensitivity is thought to be significantly higher than the other existing conventional broad beam systems, making much easier the detection of lower altitude echoes even under non-EPP conditions. The sharp beam operation is also advantageous in suppressing unwanted off-vertical echoes resulting in a better height resolution with much less range smearing. Such technical differences from the conventional systems should be emphasized quantitatively in Introduction to claim the uniqueness of the current study.
The conditions for MF echoes to be detected should be mentioned and discussed more clearly by citing appropriate manuscripts: enough electron density to increase the refractive index, something such as atmospheric turbulences to fluctuate the index, and possibly something to reduce the mobility of ions such as NOx for coherent detection. The difference of O and X modes also needs to be explained together with the reason of selecting X mode in this study (e.g., Renkwitz and Latteck, 2017; Vierinen et al., 2013). While such background information is only very briefly scattered in the present manuscript and mentioned some in Lines 316-321, it should be more collectively summarized, perhaps in Introduction. Additional information on how O mode echoes look like will also be helpful for a better understanding.
Regarding the refractive index fluctuations, turbulence activity is a key as the authors briefly mention. Atmospheric waves are believed to be largely responsible for the turbulence generation. Because of the nature of atmospheric stability, turbulences are generated more preferably at unstable phases of atmospheric waves, not necessarily all through the existing height region of those waves. MST radar observations, usually with better height resolutions than MF radars, often show layered structures as seen in Figure 3 (d) of Nishiyama et al. (2018) (see the two layered structure on May 28, 2013). Keeping this in mind, are there any possibilities that the isolated structure of ‘LIME’ is, at least partly, related to this layered turbulence structure? I presume that under moderately disturbed conditions (weak EPP) an MF radar, especially the sensitive Saura radar, could measure echoes from a wide height region (50-90km) with stronger echoes at unstable heights, resulting in an apparent structure seen as ‘LIME’. The isolated echoes around 55 km of MF radar on May 29, 2013 seen in Figure 3 (c )of Nishiyama et al. (2018) might be such an example, where the MST radar echoes are only weakly detected in Figure 3 (d).
In the VOID areas seen in Figures 1, 4 and 7 of the manuscript, I see weak echoing region between LIME and D region echoes. As I mentioned, this kind of patchy structures are quite common in sharp beam MST radar measurements. So it would also be a case for a powerful high resolution MF radar such as Saura system.
GCRs can be a steady source of the low altitude echoes. References about ionization will be necessary around Line 323. However, the discussion about GCRs is still only speculative. If the same kind of echoes are not detected at other sites, especially at Juliusruh, necessary conditions for MF radar detection may be more quantitatively estimated considering the technical (power/gain) and latitudinal (GCR) differences.
MINOR COMMENTS
For grammatical errors or suggestion, see comments by other reviewers.
Figure 4
Is the grey hatch necessary?
Figure 8
Height width distribution is also wanted together with the separation distribution (VOID width).
Figures 9 and 10
Is the 95 degree measured on the ground? If so, the value will be significantly different in the mesosphere. A clear definition will be wanted to avoid confusion.
Figure 11
What is the maximum value? Detection rates may be more understandable rather than actual number. Does the median mean one of the 4 values corresponding to the 4 years? Why not average?
Citation: https://doi.org/10.5194/egusphere-2026-1030-RC3
Peer review completion
Journal article(s) based on this preprint
Viewed
| HTML | XML | Total | BibTeX | EndNote | |
|---|---|---|---|---|---|
| 879 | 357 | 105 | 1,341 | 60 | 106 |
- HTML: 879
- PDF: 357
- XML: 105
- Total: 1,341
- BibTeX: 60
- EndNote: 106
Viewed (geographical distribution)
| Country | # | Views | % |
|---|
| Total: | 0 |
| HTML: | 0 |
| PDF: | 0 |
| XML: | 0 |
- 1
Yadu Krishnan Krishnakumar
Toralf Renkwitz
Andreas Ahrens
The requested preprint has a corresponding peer-reviewed final revised paper. You are encouraged to refer to the final revised version.
- Preprint
(3142 KB) - Metadata XML
Review of Automated Detection of Low-altitude Isolated Mesospheric Radar Echoes Using YOLOv8: Evidence for a C-Layer Phenomenon near 60 km Altitude?
This paper describes an automated deep learning approach for the detection of faint echoes at altitudes below the D-region as observed by the Saura HF radar. The authors used the pattern recognition tool YOLO (You Only Look Once) to derive statistical information on the occurrence of these radar echoes over four years of radar measurements. The preferred altitude of these radar echoes is found to be near 58 km, with substantial annual variability in the detection rate and altitude and spectral width parameters.
The paper is of significant interest to the ionospheric physics community but requires substantial revision to be acceptable for publication. The main issues are:
It is also peculiar that the authors reference the hypothetical “C-layer” in the title but do mention this layer at all in the article.
My review is divided into two sections. The first section includes issues that the authors need to address before the article is acceptable for publication. The second section includes suggested changes that will improve the readability of the article.
Issues to address
Suggestions for improved readability