
the Creative Commons Attribution 4.0 License.
the Creative Commons Attribution 4.0 License.
 | 12 Jan 2026
Ballistic projectile hazard of major explosions and paroxysms at Stromboli (Italy) with uncertainty quantification: 2. Conditional and temporal probability maps
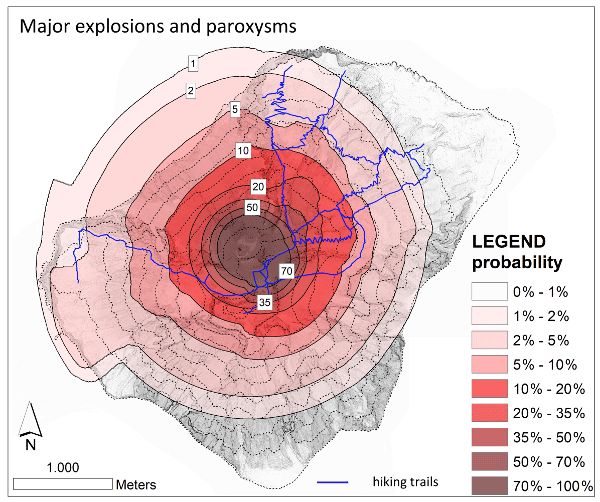
Abstract. This study presents the first probability hazard maps of the areas potentially affected by ballistic fallout from major explosions and paroxysms at Stromboli, based on mathematical analyses of the extensive historical and recent records of its explosive activity. This novel approach develops and integrates three statistical models that describe ballistic fallout patterns under different assumptions and considering the associated uncertainty. Model 1 mirrors the areas observed to be affected in the past, whereas Models 2 and 3 address data under-sampling and morphological/dynamics changes assuming independency between ballistic distance and dispersal direction. By combining these models, robust and conservative ballistic fallout hazard maps are produced for major explosions and paroxysms, and for the two categories combined together by assuming a relative proportion. The new combined maps highlight the most exposed areas of the island and quantify the probability of being affected in the case of a major explosion or paroxysm. For instance, the NE trails at 600 m would have ≈ 25 % probability of ballistic fallout, while the Labronzo trail ≈ 8 % and 5 % probability at 400 and 290 m, respectively; the entire village of Ginostra would be affected with ≈ 3 % probability. Combining such maps with a temporal model of occurrence of the events, first probability maps of ballistic fallout in the next 10 and 50 years are presented. Results are moderately influenced by mapping uncertainties and by the assumed proportion between major explosions and paroxysms. These findings open the way to individual and societal risk assessments for this phenomenon at Stromboli.
-
Notice on discussion status
The requested preprint has a corresponding peer-reviewed final revised paper. You are encouraged to refer to the final revised version.
-
Preprint
(11100 KB)
-
Supplement
(5424 KB)
-
The requested preprint has a corresponding peer-reviewed final revised paper. You are encouraged to refer to the final revised version.
- Preprint
(11100 KB) - Metadata XML
-
Supplement
(5424 KB) - BibTeX
- EndNote
- Final revised paper


Journal article(s) based on this preprint
Interactive discussion
Status: closed
-
RC1: 'Comment on egusphere-2025-6540', Gianfilippo De Astis, 18 Mar 2026
Finally, we have a paper with probability maps on this specific hazard (ballistic projectile) that is of considerable importance on Stromboli Island. And it's especially important for Stromboli citizens and tourists. After the reading, I think that the English used seems solid and structurally rigorous to me (but I'm not a native speaker). The paper has some limits intrinsecally related to the collected data and the methodological approach. However, the Authors of the article themselves clearly highlight their presence or some weaknesses. This is indicative of transparency and reliability. Very commendable and not really common among scientists. Anyway, these limits need to be re-considered and possibly reduced. In my opinion, they are the following:
a) Ineffectiveness in providing the areal density of projectiles, since the study simply calculates the probability that a given area will be hit by ballistic fallout in the event of a Major Explosion (ME) or paroxysm, but does not analyze the number of projectiles per unit area (areal density). Therefore, the results do not provide a direct measure of the probability that a person or a structure can be actually targeted or hit. This shortcoming is justified through the fact that the exact number of projectiles on the ground is rarely documented in historical accounts. The fact that another "companion paper" is cited as the main source from which these data are extracted doesn't allow me to fully understand the consistency of these assumptions and the breadth of sources consulted. In other words, may be, this point can be better clarified or more field-data could be considered. In addition, I ask if Andronico et al. (2021), Giordano and De Astis (2021), Bisson et al. (2023), Voloschina et Al. (2023) have deeply and very carefully considered? They are the most recent field-works done on major explosions and paroxysms, so… If not, please improve this topic. Also Pioli et Al. (2014) Geology 42(10), which is not present in the References, should be considered.
b) Limited observations and incomplete data (i.e., under-sampling), which means in other words that since the approach relies on the reconstruction of past events, the data suffers from a bias related to areas where it is easier to carry on surveys (such as beaten paths or inhabited areas). In less accessible areas of the island - such as the edges of the Sciara del Fuoco and the Sciara itself or Serro Capre and Vigna Vecchia or Serro Monaco etc. - there is a significant data gap. Although the authors introduced corrective statistical models (Models 2 and 3) to mitigate this problem, the original undersampling remains a flaw. c) Lack of physical and dynamic modeling, which therefore highlights as the study relies entirely on a statistical analysis of field observations, with no attention and reflection on the conditions of the explosive mixture at the source. We know that the two-types magmas involved in paroxysms (and rarely in ME) and their interaction before the events can play a great role in the eruptive dynamics. Also, no numerical models are used to describe the flight dynamics, impact angle or complex projectile trajectories. I believe that is an insurmountable point and where no improvements can be made, but it must be written very clearly. d) The parameter p, which represents the fraction of the number of paroxysms compared to the total number of explosive events (i.e. the sum of major explosions and paroxysms, right?), presents those strong doubts largely deriving from the complexity of the volcano eruptions during time and from the hard limits represented by lacking news/observations in the historical catalogues, over long periods. So, there is uncertainty in estimating this "p" ratio. The Authors assume a rate of 12% (based on data from 2003 to 2023), In this case, my question is: why not up to 2024, when another paroxysm occurred? Moreover, during the 2024 at least other 3 MEs occurred: have they been considered?. If the Authors acknowledge, as they write, that this value can vary dramatically due to the volcano's natural variability and the clustering effect of events over time, it should be considered the largest possible period, with available data until our days, not stopping at 2023. As far as, based on my knowledge, there were no MEs during 2025 but the most reliable number of MEs and paroxysms occurred until the pubblication of this paper is a point that cannot be circumvented in any way. e) Although the Authors acknowledged that this represents a potential uncertainty factor, addressed through statistics, they chose a single spatial reference point, i.e. the approximate center of the "Crater Terrace" (at about 750 m a.s.l.), as "origin". From here, all distances and fallout directions are measured, despite being clear that there are two dominant craters in the Stromboli eruptions: the NE and the SW. In my opinion, this approximation weakens the robustness of the hazard maps, although necessary. Furthermore, there are the morphology of Stromboli's two or three craters changing with time along with the geometry of the vents in the final 1-2 km. These two variables further influence volcanic hazard (and risk) because they strongly affect the structure of explosive jets and the direction of dispersion of ballistic projectiles. The problem is mitigated (in the paper) by the choice of the 3 Models and by the final focus on more cautious and conservative hazard maps, covering potentially threatened areas... However, despite: i) we can read in the Discussion this “enhances the robustness of the hazard maps against possible under-recording issues and unstationary behaviour of the volcanic system” and this is true; ii) we learn that the Model 3 approach does not privilege any specific direction and provides an "average" probability to include even areas totally under-recorded by documents, I think that the Conclusions do not give enough space to the concrete impact that the phenomenon studied may have.Given that, is it possible in the Conclusions to explain in some point and/or show through a new Figure, one case or solution where, changing the quantification of at least one important sources of uncertainty (e.g. the crater position or another...), the hazard maps show a considerable variation? The goal should and would be to make more understandable and clearer to the reader how the scenario might change for one certain sector of the Island if we consider the variation of (just) one of the above mentioned parameter. The Authors may want to show in the Conclusions.
Another couple of things that I would like to see better written in the Conclusions are: at point one, the high vulnerability of Ginostra side (and village). Infact, the map shows that almost the entire village of Ginostra is hit with a probability greater than 20% for each single paroxysm; at point 2, according to Figure 4f the contour indicating a probability of 2% comes to cover almost the entire extension of the island, in case of paroxysms and that means that basically no area of the Island is free or shows 0 hazards with respect to being hit by ballistic bombs and blocks. Another final thing that could be highlighted in the Conclusions, if I understood correctly, is that in the probabilistic distribution of the next 50 years (MEs plus Paroxysms) the study expects 16 paroxysms to occur (with an increase, if the uncertain MEs were excluded).
-
AC1: 'Reply on RC1', Augusto Neri, 29 Jul 2026
Dear Editor,
we have carefully addresses all the comments and suggestions of the two reviewers. Please find here attached as supplement zip file:
- a detailed rebuttal letter to both reviewers;
- the revised manuscript with track-changes which is a necessary supplement to the rebuttal letter.
We remain at disposal for any further information or revisions.
Thanks again for your handling of our two companion manuscripts.
Best wishes,
Augusto Neri
-
AC1: 'Reply on RC1', Augusto Neri, 29 Jul 2026
-
RC2: 'Comment on egusphere-2025-6540', Anonymous Referee #2, 26 Jun 2026
This contribution represents significant work, firmly rooted in the geologic record, on the probability of ballistic impact in areas surrounding Stromboli volcano. The base data on which this paper relies is reported in a companion paper making it difficult to determine the robustness of the overall modeling. The modeling represents a statistical analysis of past data and does not utilize physical models of eruptions in any way. The approach represents a valuable contribution to ballistic hazard assessment at Stromboli, as well as, potentially, other volcanoes.
While an incorporation of uncertainty is highlighted as a strength of this paper, I couldn’t find any discussion of sources of uncertainty or of how uncertainty was determined. I believe this may be laid out in the companion paper and suggest including /more strongly highlighting this information in the present work as well.
The potential bias in the historical dataset is troubling. It would benefit this work to perform some additional statistical checks to specifically investigate this potential bias. For example, is it possible to create an accessibility mask for the entire area, and to run a Monte Carlo simulation restricting data to these locations, and then to compare this to the original dataset to determine the extent of the sampling bias? This information could then potentially be used to determine which of the three models best fits the actual hazard and to validate (or not) the resulting analysis. If this or another statistical check could be performed, it would go a long way towards boosting confidence in the model.
Technical / Typographic comments:
- The introduction states (~ line 71): “In this work, we aim at developing probabilistic hazard maps of this phenomenon at Stromboli based on the large amount of information describing the past explosive activity of the volcano and also considering the effect of some main sources of uncertainty.” However, the ‘large amount of information’ refers to the location(s) of ballistics following eruptions. As no physical or other parameters relating to actual explosions are utilized, and given that this sentence comes directly after an explanation that much ballistic hazard modeling is done via physical models, I suggest rephrasing.
- The Figure 1 caption states that Fa includes the axis symmetrical part and Fb does not: this appears to be backwards.
- ~ Line 240 states that model 3 dominates towards the West. However model 3 is axis symmetric; the greater concentration towards the west is only in comparison to the other models. Could this be re-worded for clarity?
- Figure 5: The color scheme changes for each model without an explanation. I am unclear why the colors appear to map to the models when a difference measurement by definition includes two models. It would be easier to compare differences if all utilized the same color scheme instead of blue sometimes being negative and sometimes being positive, for example.
- Line 407 refers to the ‘uncertain major explosions’. How are these defined?
- Figure 11a: Contour 0.001 is mislabeled as 0.002.
Citation: https://doi.org/10.5194/egusphere-2025-6540-RC2 -
AC2: 'Reply on RC2', Augusto Neri, 29 Jul 2026
Dear Editor,
we have carefully addressed all the comments and suggestions of the two reviewers. Please find here attached as supplement zip file:
- a detailed rebuttal letter to both reviewers;
- the revised manuscript with track-changes which is a necessary supplement to the rebuttal letter.
We remain at disposal for any further information or revisions.
Thanks again for your handling of our two companion manuscripts.
Best wishes,
Augusto Neri
Peer review completion


Interactive discussion
Status: closed
-
RC1: 'Comment on egusphere-2025-6540', Gianfilippo De Astis, 18 Mar 2026
Finally, we have a paper with probability maps on this specific hazard (ballistic projectile) that is of considerable importance on Stromboli Island. And it's especially important for Stromboli citizens and tourists. After the reading, I think that the English used seems solid and structurally rigorous to me (but I'm not a native speaker). The paper has some limits intrinsecally related to the collected data and the methodological approach. However, the Authors of the article themselves clearly highlight their presence or some weaknesses. This is indicative of transparency and reliability. Very commendable and not really common among scientists. Anyway, these limits need to be re-considered and possibly reduced. In my opinion, they are the following:
a) Ineffectiveness in providing the areal density of projectiles, since the study simply calculates the probability that a given area will be hit by ballistic fallout in the event of a Major Explosion (ME) or paroxysm, but does not analyze the number of projectiles per unit area (areal density). Therefore, the results do not provide a direct measure of the probability that a person or a structure can be actually targeted or hit. This shortcoming is justified through the fact that the exact number of projectiles on the ground is rarely documented in historical accounts. The fact that another "companion paper" is cited as the main source from which these data are extracted doesn't allow me to fully understand the consistency of these assumptions and the breadth of sources consulted. In other words, may be, this point can be better clarified or more field-data could be considered. In addition, I ask if Andronico et al. (2021), Giordano and De Astis (2021), Bisson et al. (2023), Voloschina et Al. (2023) have deeply and very carefully considered? They are the most recent field-works done on major explosions and paroxysms, so… If not, please improve this topic. Also Pioli et Al. (2014) Geology 42(10), which is not present in the References, should be considered.
b) Limited observations and incomplete data (i.e., under-sampling), which means in other words that since the approach relies on the reconstruction of past events, the data suffers from a bias related to areas where it is easier to carry on surveys (such as beaten paths or inhabited areas). In less accessible areas of the island - such as the edges of the Sciara del Fuoco and the Sciara itself or Serro Capre and Vigna Vecchia or Serro Monaco etc. - there is a significant data gap. Although the authors introduced corrective statistical models (Models 2 and 3) to mitigate this problem, the original undersampling remains a flaw. c) Lack of physical and dynamic modeling, which therefore highlights as the study relies entirely on a statistical analysis of field observations, with no attention and reflection on the conditions of the explosive mixture at the source. We know that the two-types magmas involved in paroxysms (and rarely in ME) and their interaction before the events can play a great role in the eruptive dynamics. Also, no numerical models are used to describe the flight dynamics, impact angle or complex projectile trajectories. I believe that is an insurmountable point and where no improvements can be made, but it must be written very clearly. d) The parameter p, which represents the fraction of the number of paroxysms compared to the total number of explosive events (i.e. the sum of major explosions and paroxysms, right?), presents those strong doubts largely deriving from the complexity of the volcano eruptions during time and from the hard limits represented by lacking news/observations in the historical catalogues, over long periods. So, there is uncertainty in estimating this "p" ratio. The Authors assume a rate of 12% (based on data from 2003 to 2023), In this case, my question is: why not up to 2024, when another paroxysm occurred? Moreover, during the 2024 at least other 3 MEs occurred: have they been considered?. If the Authors acknowledge, as they write, that this value can vary dramatically due to the volcano's natural variability and the clustering effect of events over time, it should be considered the largest possible period, with available data until our days, not stopping at 2023. As far as, based on my knowledge, there were no MEs during 2025 but the most reliable number of MEs and paroxysms occurred until the pubblication of this paper is a point that cannot be circumvented in any way. e) Although the Authors acknowledged that this represents a potential uncertainty factor, addressed through statistics, they chose a single spatial reference point, i.e. the approximate center of the "Crater Terrace" (at about 750 m a.s.l.), as "origin". From here, all distances and fallout directions are measured, despite being clear that there are two dominant craters in the Stromboli eruptions: the NE and the SW. In my opinion, this approximation weakens the robustness of the hazard maps, although necessary. Furthermore, there are the morphology of Stromboli's two or three craters changing with time along with the geometry of the vents in the final 1-2 km. These two variables further influence volcanic hazard (and risk) because they strongly affect the structure of explosive jets and the direction of dispersion of ballistic projectiles. The problem is mitigated (in the paper) by the choice of the 3 Models and by the final focus on more cautious and conservative hazard maps, covering potentially threatened areas... However, despite: i) we can read in the Discussion this “enhances the robustness of the hazard maps against possible under-recording issues and unstationary behaviour of the volcanic system” and this is true; ii) we learn that the Model 3 approach does not privilege any specific direction and provides an "average" probability to include even areas totally under-recorded by documents, I think that the Conclusions do not give enough space to the concrete impact that the phenomenon studied may have.Given that, is it possible in the Conclusions to explain in some point and/or show through a new Figure, one case or solution where, changing the quantification of at least one important sources of uncertainty (e.g. the crater position or another...), the hazard maps show a considerable variation? The goal should and would be to make more understandable and clearer to the reader how the scenario might change for one certain sector of the Island if we consider the variation of (just) one of the above mentioned parameter. The Authors may want to show in the Conclusions.
Another couple of things that I would like to see better written in the Conclusions are: at point one, the high vulnerability of Ginostra side (and village). Infact, the map shows that almost the entire village of Ginostra is hit with a probability greater than 20% for each single paroxysm; at point 2, according to Figure 4f the contour indicating a probability of 2% comes to cover almost the entire extension of the island, in case of paroxysms and that means that basically no area of the Island is free or shows 0 hazards with respect to being hit by ballistic bombs and blocks. Another final thing that could be highlighted in the Conclusions, if I understood correctly, is that in the probabilistic distribution of the next 50 years (MEs plus Paroxysms) the study expects 16 paroxysms to occur (with an increase, if the uncertain MEs were excluded).
-
AC1: 'Reply on RC1', Augusto Neri, 29 Jul 2026
Dear Editor,
we have carefully addresses all the comments and suggestions of the two reviewers. Please find here attached as supplement zip file:
- a detailed rebuttal letter to both reviewers;
- the revised manuscript with track-changes which is a necessary supplement to the rebuttal letter.
We remain at disposal for any further information or revisions.
Thanks again for your handling of our two companion manuscripts.
Best wishes,
Augusto Neri
-
AC1: 'Reply on RC1', Augusto Neri, 29 Jul 2026
-
RC2: 'Comment on egusphere-2025-6540', Anonymous Referee #2, 26 Jun 2026
This contribution represents significant work, firmly rooted in the geologic record, on the probability of ballistic impact in areas surrounding Stromboli volcano. The base data on which this paper relies is reported in a companion paper making it difficult to determine the robustness of the overall modeling. The modeling represents a statistical analysis of past data and does not utilize physical models of eruptions in any way. The approach represents a valuable contribution to ballistic hazard assessment at Stromboli, as well as, potentially, other volcanoes.
While an incorporation of uncertainty is highlighted as a strength of this paper, I couldn’t find any discussion of sources of uncertainty or of how uncertainty was determined. I believe this may be laid out in the companion paper and suggest including /more strongly highlighting this information in the present work as well.
The potential bias in the historical dataset is troubling. It would benefit this work to perform some additional statistical checks to specifically investigate this potential bias. For example, is it possible to create an accessibility mask for the entire area, and to run a Monte Carlo simulation restricting data to these locations, and then to compare this to the original dataset to determine the extent of the sampling bias? This information could then potentially be used to determine which of the three models best fits the actual hazard and to validate (or not) the resulting analysis. If this or another statistical check could be performed, it would go a long way towards boosting confidence in the model.
Technical / Typographic comments:
- The introduction states (~ line 71): “In this work, we aim at developing probabilistic hazard maps of this phenomenon at Stromboli based on the large amount of information describing the past explosive activity of the volcano and also considering the effect of some main sources of uncertainty.” However, the ‘large amount of information’ refers to the location(s) of ballistics following eruptions. As no physical or other parameters relating to actual explosions are utilized, and given that this sentence comes directly after an explanation that much ballistic hazard modeling is done via physical models, I suggest rephrasing.
- The Figure 1 caption states that Fa includes the axis symmetrical part and Fb does not: this appears to be backwards.
- ~ Line 240 states that model 3 dominates towards the West. However model 3 is axis symmetric; the greater concentration towards the west is only in comparison to the other models. Could this be re-worded for clarity?
- Figure 5: The color scheme changes for each model without an explanation. I am unclear why the colors appear to map to the models when a difference measurement by definition includes two models. It would be easier to compare differences if all utilized the same color scheme instead of blue sometimes being negative and sometimes being positive, for example.
- Line 407 refers to the ‘uncertain major explosions’. How are these defined?
- Figure 11a: Contour 0.001 is mislabeled as 0.002.
Citation: https://doi.org/10.5194/egusphere-2025-6540-RC2 -
AC2: 'Reply on RC2', Augusto Neri, 29 Jul 2026
Dear Editor,
we have carefully addressed all the comments and suggestions of the two reviewers. Please find here attached as supplement zip file:
- a detailed rebuttal letter to both reviewers;
- the revised manuscript with track-changes which is a necessary supplement to the rebuttal letter.
We remain at disposal for any further information or revisions.
Thanks again for your handling of our two companion manuscripts.
Best wishes,
Augusto Neri
Peer review completion
Journal article(s) based on this preprint
Viewed
| HTML | XML | Total | Supplement | BibTeX | EndNote | |
|---|---|---|---|---|---|---|
| 1,046 | 1,258 | 122 | 2,426 | 141 | 96 | 200 |
- HTML: 1,046
- PDF: 1,258
- XML: 122
- Total: 2,426
- Supplement: 141
- BibTeX: 96
- EndNote: 200
Viewed (geographical distribution)
| Country | # | Views | % |
|---|
| Total: | 0 |
| HTML: | 0 |
| PDF: | 0 |
| XML: | 0 |
- 1
Andrea Bevilacqua

Patrizia Landi
Paola Del Carlo
Massimo Pompilio
Peter Baxter
The requested preprint has a corresponding peer-reviewed final revised paper. You are encouraged to refer to the final revised version.
- Preprint
(11100 KB) - Metadata XML
-
Supplement
(5424 KB) - BibTeX
- EndNote
- Final revised paper