
the Creative Commons Attribution 4.0 License.
the Creative Commons Attribution 4.0 License.
 | 27 Apr 2026
Numerical modeling on the mechanisms of chlorine chemistry in snowpack and their impact on secondary atmospheric pollution
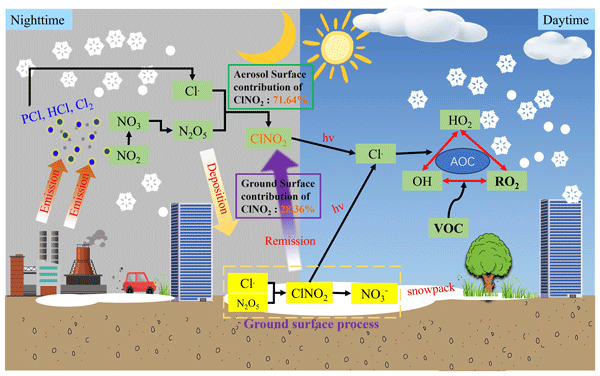
Abstract. Snow with high albedo enhances atmospheric photochemical reactions, influencing key oxidative processes. Nitryl chloride (ClNO2), as a strong oxidizing species, is generated by the heterogeneous reaction between dinitrogen pentoxide (N2O5) and chloride adsorbed on aerosol and the ground surfaces. After sunrise, the photolysis of ClNO2 rapidly releases highly reactive chlorine radicals (Cl·), which contributes to the formation of secondary pollutants. However, the pollution mechanisms in high-latitude, snow-covered regions associated with increased chlorine emissions remain unclear. In this study, we employed the WRF-CAMx model (Weather Research and Forecasting Model-Comprehensive Air Quality Model with extensions) with a modified chemical mechanism (CB6r2h_lts, Carbon Bond 6 revision 2 with heterogeneous chemistry for low-temperature and snow-covered conditions) that incorporated heterogeneous N2O5 reactions and ClNO2 photolysis on ground surfaces to assess their impact on regional atmosphere under snow-covered conditions in Northeast China. Our findings reveal that under snow-covered conditions, the YU20 aerosol scheme (from study by YU et al., 2020) outperforms the BT09 scheme (from study by Bertram et al., 2009) in simulating N2O5 and ClNO2 concentrations within the CAMx model. Incorporating anthropogenic chlorine emissions and ground surface chemistry significantly improved model performance for ClNO2, reducing the mean bias (MB) from -105.78 pptv to 2.66 pptv and increasing the index of agreement (IOA) from 0.39 to 0.86. These processes resulted in a maximum hourly increase of 3.65 µg/m³ in PM2.5 (relative contribution: 15.34 %) and 3.41 ppbv in MDA8 O3 (5.68 %). Notably, ground surface chemical processes were identified as the dominant source of nocturnal ClNO2, contributing approximately 28.36 % to nighttime accumulation across Northeast China. These findings not only highlight the pivotal role of chlorine chemistry in atmospheric processes under snow-covered conditions, but also provide crucial support for the refinement of the mechanisms governing the flux exchange of chemical substances between the atmosphere and the cryosphere.
-
Notice on discussion status
The requested preprint has a corresponding peer-reviewed final revised paper. You are encouraged to refer to the final revised version.
-
Preprint
(3123 KB)
-
Supplement
(1752 KB)
-
The requested preprint has a corresponding peer-reviewed final revised paper. You are encouraged to refer to the final revised version.
- Preprint
(3123 KB) - Metadata XML
-
Supplement
(1752 KB) - BibTeX
- EndNote
- Final revised paper


Journal article(s) based on this preprint
Interactive discussion
Status: closed
-
RC1: 'Comment on egusphere-2025-5338', Anonymous Referee #1, 13 Jun 2026
-
AC1: 'Reply on RC1', Zhang xuelei, 13 Aug 2026
The comment was uploaded in the form of a supplement: https://egusphere.copernicus.org/preprints/2026/egusphere-2025-5338/egusphere-2025-5338-AC1-supplement.pdf
-
AC1: 'Reply on RC1', Zhang xuelei, 13 Aug 2026
-
RC2: 'Comment on egusphere-2025-5338', Anonymous Referee #2, 27 Jul 2026
Xie et al. develop and evaluate an enhanced WRF-CAMx model that incorporates additional heterogeneous chlorine chemistry to investigate winter atmospheric chemistry over snow-covered regions of Northeast China, with a particular focus on N2O5 uptake and ClNO2 production on both aerosol and snow surfaces. The authors incorporate updated parameterizations for heterogeneous N2O5 reactions, anthropogenic chlorine emissions, and a newly developed ground-surface chemistry module that accounts for snowpack processes and ClNO2 photolysis. They report that the YU20 aerosol parameterization reproduces field observations at the DLS site in China better compared to the traditional BT09 scheme. Additionally, they show that inclusion of ground-surface chlorine chemistry improves the simulation of ClNO2 concentrations. Scenario analyses indicate that snowpack chemistry is an important nocturnal source of ClNO2, contributing approximately 28% of nighttime accumulation, while chlorine chemistry enhances atmospheric oxidizing capacity and increases PM2.5 (up to 3.65 µg m-3) and MDA8 O3 (up to 3.41 ppbv). Overall, the study highlights the importance of explicitly representing snowpack-mediated chlorine chemistry in regional air quality models to better characterize winter atmospheric oxidation and secondary pollutant formation under snow-covered conditions.
General comments
- Cite and discuss Sun et al. (2026). This paper investigates winter ClNO2 sources and its impact on atmospheric oxidizing capacity at a coastal North China site (Qingdao) using field observations plus a 0-D photochemical box model (F0AM/MCM), and seems like a relevant discussion reference.
- Readability. Many sentences are too long (for example, lines 84-87, lines 68-71), and word choice is frequently more elevated than needed (for example, "protracted"). I recommend splitting sentences and simplifying vocabulary throughout for readability.
- Scenario naming is inconsistent and hard to follow. Table 2 cleanly defines the scenario set (B1, Y0-Y4), but the text then also refers to scenarios by case name (YU20_A_chl, YU20_A_G_chl) and later switches to process-based labels (Chl_het_N2O5_a+g, Het_N2O5_a, Het_N2O5_g) for the same underlying comparisons (Y3−Y0, Y2−Y1, Y3−Y2). Help the reader by picking one naming convention and using it consistently.
- Comparison to measurements. All quantitative validation (N2O5, ClNO2) comes from one station (DLS) over nine days, yet conclusions are drawn for the whole Northeast China domain. The spatial maps (Figs. 4, 5, 6, 8, 9) do not include a mark for the DLS location, please add it for reference on each spatial panel. In addition, PM2.5 and O3 are never validated against any observation or published estimates. There should be some published observations or prior studies that measured PM2.5, O3, or the other components (PNH4, PSO4, PNO3), no?
- BT09 results are referenced but never shown. The BT09 vs. YU20 comparison (section 3.2.1) is supported only by summary statistics (MB/NMB/RMSE/IOA) attributed to Table S3, no time series or spatial output for the BT09 (B1) scenario appears anywhere in the manuscript. Since this is discussed thoroughly, please show the actual BT09 output (at least in the SI) so the reader can understand your claim that the YU20 is better.
- YU20 and snowpack chemistry across the entire modeling domain. The manuscript argues that YU20 reproduces the observations better than BT09 under snow-covered, high-latitude conditions at the study site, while citing previous work (Xie et al., 2025; Dai et al., 2020) showing that BT09 performs better under snow-free or marine conditions. However, YU20 together with the ground snow-chemistry module is applied uniformly across the entire modeling domain, including regions discussed in the results that are not predominantly snow-covered (e.g., the Bohai Sea and the Beijing-Tianjin-Hebei coastal region; lines 452-454). The ground-surface reactions (Table 1) appear to be parameterized based on surface-temperature categories rather than an explicit snow-cover mask, even though the underlying N2O5 uptake coefficients and ClNO2 yields were derived from snowpack-specific studies (Wang et al., 2020; Jeong et al., 2023). Additionally, although the Supplement presents ERA5 snow-cover, snow-depth, snow-density, and albedo datasets, it is unclear whether these products are actually used to determine where snowpack chemistry is active, or are only used to verify the representativeness of the assumed snow properties. Please clarify whether snowpack reactions are restricted (or weighted) according to snow-cover fraction, or whether temperature alone serves as the proxy for snow presence. If the latter, please justify this assumption, particularly for regions with little or no snow cover where the manuscript still discusses the impacts of snowpack chlorine chemistry.
- Readability of multi-panel figures. Figures 4, 5, 6, 7, and 8 pack many panels with only caption text to distinguish rows/columns. Since N2O5 changes very little across scenarios in several of these, consider moving those panels to the SI, and add explicit column/row headers directly above the panels (e.g., "Y0," "Y3," "Diff," "%Diff").
Specific comments
- Section 2.2 (model configuration, ~line 146): 29 vertical layers are specified, please state the model top height.
- Section 2.3 (~line 160): Define pNO3 at first use.
- Lines 228-230: "the resulting nitric acid further stabilizes the reaction system" is unclear, please rephrase, and add a reference or show the relevant reaction pathway.
- Lines 237-239: After the statement that photolysis is "accompanied by the release of chlorine atoms", please provide an appropriate reference.
- Figure 2 caption: The gray shaded (T1, T2, T3, T5, T6) and cyan shaded (T4) regions are explained only in the body text, not in the caption, please add this. Please also note in the caption what happened around 2/26 (for example, "no measurements available"), since there is an apparent data gap.
- Figure 2, panel (b): The ClNO2 axis unnecessarily extends to 800 pptv, please rescale to the actual data range for better visibility.
- Line 268: "winter chlorine emissions" is used without definition, please specify what this refers to.
- Section 3.2.1, ~page 10 (first use of MB, NMB, RMSE, IOA): These acronyms are used starting here but only formally defined at page 12, please define at first use.
- Section 3.2.2 / Figure 3: The model appears to overestimate N2O5 relative to observations, but this is not discussed. Please comment and, if possible, suggest an explanation.
- Line 342: pCl and HCl values are discussed but it’s not stated where they are shown (in Figure 5), please cite the figure explicitly here.
- Section 3.3.2 (ClNO2 flux discussion, ~lines 409-421): The comparison to McNamara et al. (2021) and Jeong et al. (2023) never states the flux produced by the authors' own simulation (this study), please add it for direct comparison.
- Section 3.3.2, "unknown ClNO2 sources" framing (~lines 369-373): Suggest citing Wang, H., Peng, C., Wang, X., Lou, S., Lu, K., Gan, G., Jia, X., Chen, X., Chen, J., Wang, H., Fan, S., Wang, X., and Tang, M., "N2O5 uptake onto saline mineral dust: a potential missing source of tropospheric ClNO2 in inland China," Atmos. Chem. Phys., 22, 1845-1859, 2022 (https://doi.org/10.5194/acp-22-1845-2022).
- Table 4: This literature summary of ClNO2 yields omits the values derived from the authors' own study (this study), please add a row for direct comparison.
- Line 401: Consider showing the N2O5 ↔ NO3 + NO2 thermal reaction (temperature-dependent, k_T) explicitly here, since the text refers to low winter temperatures favoring the equilibrium shift toward N2O5.
- Section 3.4.1 / Figure 7 (lines 441-442): The text does not clearly state that the figure's panels show OH, RO2, and HO2, please clarify in the caption or text.
- Section 3.4.1: Are there any direct gas-phase Cl + VOC reactions in the mechanism, or is Cl's entire effect on AOC indirect (via changes to OH/RO2/HO2, which then affect VOC oxidation)? Please state this explicitly.
- Section 3.4.1 (OH/RO2/HO2 differences, Fig. 7): The reported concentration changes are numerically small, please put these into relative context against some known process or baseline magnitude so their significance can be judged; if still negligible, consider moving this analysis to the SI.
- Line 550: It is unclear whether the referenced "observed" MDA8 O3 value is a real observation or model output, please clarify. More broadly, is there any O3 measurement available to compare to in this section?
- Section 2.2 (model description, ~lines 149-153): Please briefly characterize the anthropogenic chlorine emission schemes. What are the major emission sources, and how do the two schemes differ?
- Supplementary Information, Table S2: The k’2f term is given as a fully numeric expression for Yu (2020) ("3.0×10⁴ x [H2O]"), but for Bertram (2009) it is left as the symbolic formula with no numeric values for beta and delta provided anywhere in the manuscript or SI.
- Supplementary Information, Figure S3: The panel titles shown in the figure do not match the titles given in the corresponding figure caption, please correct these.
Citation: https://doi.org/10.5194/egusphere-2025-5338-RC2 -
AC2: 'Reply on RC2', Zhang xuelei, 13 Aug 2026
The comment was uploaded in the form of a supplement: https://egusphere.copernicus.org/preprints/2026/egusphere-2025-5338/egusphere-2025-5338-AC2-supplement.pdf
Peer review completion


Interactive discussion
Status: closed
-
RC1: 'Comment on egusphere-2025-5338', Anonymous Referee #1, 13 Jun 2026
Xie et al. applied the WRF and CAMx models over Northeast China to investigate how chlorine chemistry in the atmosphere and on the snow-covered ground influenced atmospheric concentrations of N₂O₅, ClNO₂, PM₂.₅ and O₃. They modeled February and March of 2024 when atmospheric measurements are available for N₂O₅ and ClNO₂ at a suburban location in Changchun City, Northeast China. They modified CAMx to compare two heterogeneous chemistry schemes (YU20 and BT09) that parameterize reactive uptake of N₂O₅ and HCl (from coal burning emissions) to aerosol surfaces. They also utilize the CAMx surface chemistry model to investigate how reactive uptake of N₂O₅ and HCl by snowpack may influence atmospheric N₂O₅ and ClNO₂. Xie et al. find that the YU20 scheme performed better than BT09 at describing the observed concentrations of N₂O₅ and ClNO₂. They find that reactive uptake of N₂O₅ by aerosol (YU20 scheme) is more influential than reactive uptake to snowpack and adding chlorine/chloride emissions (ACEIC inventory) in combination. They note that ClNO₂ formation from N₂O₅ uptake is influential on model results for PM2.5, ozone and other oxidants. They suggest that future modeling studies (for similar winter conditions) should include these emissions and processes. This study expands on previous 1D modeling studies by presenting a 3D picture of model sensitivity to algorithms and input data. The results can provide useful guidance for modeling similar conditions and planning future field campaigns.
In section 2.5 (and elsewhere) I understood “anthropogenic chlorine emissions” to mean specifically the ACEIC inventory, especially gaseous HCl from coal combustion. Does the MEIC emission inventory include emissions of particulate chloride (PCl)? The ISORROPIA scheme in CAMx equilibrates HCl and PCl depending on aerosol pH and consequently emissions of both PCL and HCl contribute to available reactive chloride. Most likely, simulation Y1 includes some anthropogenic chloride emissions (i.e., PCl from MEIC) and the other simulations have more chloride/chlorine emissions (i.e., from ACEIC). The manuscript should clarify whether MEIC includes chloride emissions. Add a table summarizing mass of chloride/chlorine emissions from MEIC and ACEIC. Provide a citation for ACEIC when first mentioned.
The CAMx surface model can store pollutant mass within the snowpack, and this mass can be lost to the ground, e.g., via meltwater. Was loss of chloride from the snowpack in meltwater modeled, and was it influential?
The OH concentration differences mentioned at line 460 seem large (OH concentration difference ranged from -(1.73 × 10⁶) cm-3 to 52.22 ×106 cm-3) and I suggest double checking.
A suitable reference for the CAMx surface model is Karamchandani et al. (2015). A suitable reference for the CAMx model is Emery et al., (2024). The CAMx v7.1 User’s Guide could be cited (Ramboll, 2021).
Is Bo Sea the same as the Bohai Sea? I think Bohai Sea is more commonly seen in English.
In several places numeric values are given with more precision than needed, for example line 47 “contributing approximately 28.36% to nighttime accumulation” could be “approximately 28%”. Consider whether less precision would make numbers more readable.
I found Figure S1 difficult to read, can the resolution be improved?
References
Emery, C., Baker, K., Wilson, G. and Yarwood, G., 2024. Comprehensive air quality model with extensions: formulation and evaluation for ozone and particulate matter over the US. Atmosphere, 15(10), p.1158.
Karamchandani, P., Emery, C., Yarwood, G., Lefer, B., Stutz, J., Couzo, E. and Vizuete, W., 2015. Implementation and refinement of a surface model for heterogeneous HONO formation in a 3-D chemical transport model. Atmospheric Environment, 112, pp.356-368.
Ramboll, 2020. User’s guide, comprehensive air quality model with extensions, version 7.10. Available at: https://www.camx.com/Files/CAMxUsersGuide_v7.10.pdf
Citation: https://doi.org/10.5194/egusphere-2025-5338-RC1 -
AC1: 'Reply on RC1', Zhang xuelei, 13 Aug 2026
The comment was uploaded in the form of a supplement: https://egusphere.copernicus.org/preprints/2026/egusphere-2025-5338/egusphere-2025-5338-AC1-supplement.pdf
-
AC1: 'Reply on RC1', Zhang xuelei, 13 Aug 2026
-
RC2: 'Comment on egusphere-2025-5338', Anonymous Referee #2, 27 Jul 2026
Xie et al. develop and evaluate an enhanced WRF-CAMx model that incorporates additional heterogeneous chlorine chemistry to investigate winter atmospheric chemistry over snow-covered regions of Northeast China, with a particular focus on N2O5 uptake and ClNO2 production on both aerosol and snow surfaces. The authors incorporate updated parameterizations for heterogeneous N2O5 reactions, anthropogenic chlorine emissions, and a newly developed ground-surface chemistry module that accounts for snowpack processes and ClNO2 photolysis. They report that the YU20 aerosol parameterization reproduces field observations at the DLS site in China better compared to the traditional BT09 scheme. Additionally, they show that inclusion of ground-surface chlorine chemistry improves the simulation of ClNO2 concentrations. Scenario analyses indicate that snowpack chemistry is an important nocturnal source of ClNO2, contributing approximately 28% of nighttime accumulation, while chlorine chemistry enhances atmospheric oxidizing capacity and increases PM2.5 (up to 3.65 µg m-3) and MDA8 O3 (up to 3.41 ppbv). Overall, the study highlights the importance of explicitly representing snowpack-mediated chlorine chemistry in regional air quality models to better characterize winter atmospheric oxidation and secondary pollutant formation under snow-covered conditions.
General comments
- Cite and discuss Sun et al. (2026). This paper investigates winter ClNO2 sources and its impact on atmospheric oxidizing capacity at a coastal North China site (Qingdao) using field observations plus a 0-D photochemical box model (F0AM/MCM), and seems like a relevant discussion reference.
- Readability. Many sentences are too long (for example, lines 84-87, lines 68-71), and word choice is frequently more elevated than needed (for example, "protracted"). I recommend splitting sentences and simplifying vocabulary throughout for readability.
- Scenario naming is inconsistent and hard to follow. Table 2 cleanly defines the scenario set (B1, Y0-Y4), but the text then also refers to scenarios by case name (YU20_A_chl, YU20_A_G_chl) and later switches to process-based labels (Chl_het_N2O5_a+g, Het_N2O5_a, Het_N2O5_g) for the same underlying comparisons (Y3−Y0, Y2−Y1, Y3−Y2). Help the reader by picking one naming convention and using it consistently.
- Comparison to measurements. All quantitative validation (N2O5, ClNO2) comes from one station (DLS) over nine days, yet conclusions are drawn for the whole Northeast China domain. The spatial maps (Figs. 4, 5, 6, 8, 9) do not include a mark for the DLS location, please add it for reference on each spatial panel. In addition, PM2.5 and O3 are never validated against any observation or published estimates. There should be some published observations or prior studies that measured PM2.5, O3, or the other components (PNH4, PSO4, PNO3), no?
- BT09 results are referenced but never shown. The BT09 vs. YU20 comparison (section 3.2.1) is supported only by summary statistics (MB/NMB/RMSE/IOA) attributed to Table S3, no time series or spatial output for the BT09 (B1) scenario appears anywhere in the manuscript. Since this is discussed thoroughly, please show the actual BT09 output (at least in the SI) so the reader can understand your claim that the YU20 is better.
- YU20 and snowpack chemistry across the entire modeling domain. The manuscript argues that YU20 reproduces the observations better than BT09 under snow-covered, high-latitude conditions at the study site, while citing previous work (Xie et al., 2025; Dai et al., 2020) showing that BT09 performs better under snow-free or marine conditions. However, YU20 together with the ground snow-chemistry module is applied uniformly across the entire modeling domain, including regions discussed in the results that are not predominantly snow-covered (e.g., the Bohai Sea and the Beijing-Tianjin-Hebei coastal region; lines 452-454). The ground-surface reactions (Table 1) appear to be parameterized based on surface-temperature categories rather than an explicit snow-cover mask, even though the underlying N2O5 uptake coefficients and ClNO2 yields were derived from snowpack-specific studies (Wang et al., 2020; Jeong et al., 2023). Additionally, although the Supplement presents ERA5 snow-cover, snow-depth, snow-density, and albedo datasets, it is unclear whether these products are actually used to determine where snowpack chemistry is active, or are only used to verify the representativeness of the assumed snow properties. Please clarify whether snowpack reactions are restricted (or weighted) according to snow-cover fraction, or whether temperature alone serves as the proxy for snow presence. If the latter, please justify this assumption, particularly for regions with little or no snow cover where the manuscript still discusses the impacts of snowpack chlorine chemistry.
- Readability of multi-panel figures. Figures 4, 5, 6, 7, and 8 pack many panels with only caption text to distinguish rows/columns. Since N2O5 changes very little across scenarios in several of these, consider moving those panels to the SI, and add explicit column/row headers directly above the panels (e.g., "Y0," "Y3," "Diff," "%Diff").
Specific comments
- Section 2.2 (model configuration, ~line 146): 29 vertical layers are specified, please state the model top height.
- Section 2.3 (~line 160): Define pNO3 at first use.
- Lines 228-230: "the resulting nitric acid further stabilizes the reaction system" is unclear, please rephrase, and add a reference or show the relevant reaction pathway.
- Lines 237-239: After the statement that photolysis is "accompanied by the release of chlorine atoms", please provide an appropriate reference.
- Figure 2 caption: The gray shaded (T1, T2, T3, T5, T6) and cyan shaded (T4) regions are explained only in the body text, not in the caption, please add this. Please also note in the caption what happened around 2/26 (for example, "no measurements available"), since there is an apparent data gap.
- Figure 2, panel (b): The ClNO2 axis unnecessarily extends to 800 pptv, please rescale to the actual data range for better visibility.
- Line 268: "winter chlorine emissions" is used without definition, please specify what this refers to.
- Section 3.2.1, ~page 10 (first use of MB, NMB, RMSE, IOA): These acronyms are used starting here but only formally defined at page 12, please define at first use.
- Section 3.2.2 / Figure 3: The model appears to overestimate N2O5 relative to observations, but this is not discussed. Please comment and, if possible, suggest an explanation.
- Line 342: pCl and HCl values are discussed but it’s not stated where they are shown (in Figure 5), please cite the figure explicitly here.
- Section 3.3.2 (ClNO2 flux discussion, ~lines 409-421): The comparison to McNamara et al. (2021) and Jeong et al. (2023) never states the flux produced by the authors' own simulation (this study), please add it for direct comparison.
- Section 3.3.2, "unknown ClNO2 sources" framing (~lines 369-373): Suggest citing Wang, H., Peng, C., Wang, X., Lou, S., Lu, K., Gan, G., Jia, X., Chen, X., Chen, J., Wang, H., Fan, S., Wang, X., and Tang, M., "N2O5 uptake onto saline mineral dust: a potential missing source of tropospheric ClNO2 in inland China," Atmos. Chem. Phys., 22, 1845-1859, 2022 (https://doi.org/10.5194/acp-22-1845-2022).
- Table 4: This literature summary of ClNO2 yields omits the values derived from the authors' own study (this study), please add a row for direct comparison.
- Line 401: Consider showing the N2O5 ↔ NO3 + NO2 thermal reaction (temperature-dependent, k_T) explicitly here, since the text refers to low winter temperatures favoring the equilibrium shift toward N2O5.
- Section 3.4.1 / Figure 7 (lines 441-442): The text does not clearly state that the figure's panels show OH, RO2, and HO2, please clarify in the caption or text.
- Section 3.4.1: Are there any direct gas-phase Cl + VOC reactions in the mechanism, or is Cl's entire effect on AOC indirect (via changes to OH/RO2/HO2, which then affect VOC oxidation)? Please state this explicitly.
- Section 3.4.1 (OH/RO2/HO2 differences, Fig. 7): The reported concentration changes are numerically small, please put these into relative context against some known process or baseline magnitude so their significance can be judged; if still negligible, consider moving this analysis to the SI.
- Line 550: It is unclear whether the referenced "observed" MDA8 O3 value is a real observation or model output, please clarify. More broadly, is there any O3 measurement available to compare to in this section?
- Section 2.2 (model description, ~lines 149-153): Please briefly characterize the anthropogenic chlorine emission schemes. What are the major emission sources, and how do the two schemes differ?
- Supplementary Information, Table S2: The k’2f term is given as a fully numeric expression for Yu (2020) ("3.0×10⁴ x [H2O]"), but for Bertram (2009) it is left as the symbolic formula with no numeric values for beta and delta provided anywhere in the manuscript or SI.
- Supplementary Information, Figure S3: The panel titles shown in the figure do not match the titles given in the corresponding figure caption, please correct these.
Citation: https://doi.org/10.5194/egusphere-2025-5338-RC2 -
AC2: 'Reply on RC2', Zhang xuelei, 13 Aug 2026
The comment was uploaded in the form of a supplement: https://egusphere.copernicus.org/preprints/2026/egusphere-2025-5338/egusphere-2025-5338-AC2-supplement.pdf
Peer review completion
Journal article(s) based on this preprint
Viewed
| HTML | XML | Total | Supplement | BibTeX | EndNote | |
|---|---|---|---|---|---|---|
| 424 | 120 | 51 | 595 | 73 | 50 | 43 |
- HTML: 424
- PDF: 120
- XML: 51
- Total: 595
- Supplement: 73
- BibTeX: 50
- EndNote: 43
Viewed (geographical distribution)
| Country | # | Views | % |
|---|
| Total: | 0 |
| HTML: | 0 |
| PDF: | 0 |
| XML: | 0 |
- 1
Shengjin Xie

Aijun Xiu
Hong Qi
Shengrui Tong
Qianjie Chen
Chao Gao
Hongmei Zhao
Shichun Zhang
Stephen Dauda Yabo
Yiming Liu
Siting Li
Mengduo Zhang
The requested preprint has a corresponding peer-reviewed final revised paper. You are encouraged to refer to the final revised version.
- Preprint
(3123 KB) - Metadata XML
-
Supplement
(1752 KB) - BibTeX
- EndNote
- Final revised paper
Xie et al. applied the WRF and CAMx models over Northeast China to investigate how chlorine chemistry in the atmosphere and on the snow-covered ground influenced atmospheric concentrations of N₂O₅, ClNO₂, PM₂.₅ and O₃. They modeled February and March of 2024 when atmospheric measurements are available for N₂O₅ and ClNO₂ at a suburban location in Changchun City, Northeast China. They modified CAMx to compare two heterogeneous chemistry schemes (YU20 and BT09) that parameterize reactive uptake of N₂O₅ and HCl (from coal burning emissions) to aerosol surfaces. They also utilize the CAMx surface chemistry model to investigate how reactive uptake of N₂O₅ and HCl by snowpack may influence atmospheric N₂O₅ and ClNO₂. Xie et al. find that the YU20 scheme performed better than BT09 at describing the observed concentrations of N₂O₅ and ClNO₂. They find that reactive uptake of N₂O₅ by aerosol (YU20 scheme) is more influential than reactive uptake to snowpack and adding chlorine/chloride emissions (ACEIC inventory) in combination. They note that ClNO₂ formation from N₂O₅ uptake is influential on model results for PM2.5, ozone and other oxidants. They suggest that future modeling studies (for similar winter conditions) should include these emissions and processes. This study expands on previous 1D modeling studies by presenting a 3D picture of model sensitivity to algorithms and input data. The results can provide useful guidance for modeling similar conditions and planning future field campaigns.
In section 2.5 (and elsewhere) I understood “anthropogenic chlorine emissions” to mean specifically the ACEIC inventory, especially gaseous HCl from coal combustion. Does the MEIC emission inventory include emissions of particulate chloride (PCl)? The ISORROPIA scheme in CAMx equilibrates HCl and PCl depending on aerosol pH and consequently emissions of both PCL and HCl contribute to available reactive chloride. Most likely, simulation Y1 includes some anthropogenic chloride emissions (i.e., PCl from MEIC) and the other simulations have more chloride/chlorine emissions (i.e., from ACEIC). The manuscript should clarify whether MEIC includes chloride emissions. Add a table summarizing mass of chloride/chlorine emissions from MEIC and ACEIC. Provide a citation for ACEIC when first mentioned.
The CAMx surface model can store pollutant mass within the snowpack, and this mass can be lost to the ground, e.g., via meltwater. Was loss of chloride from the snowpack in meltwater modeled, and was it influential?
The OH concentration differences mentioned at line 460 seem large (OH concentration difference ranged from -(1.73 × 10⁶) cm-3 to 52.22 ×106 cm-3) and I suggest double checking.
A suitable reference for the CAMx surface model is Karamchandani et al. (2015). A suitable reference for the CAMx model is Emery et al., (2024). The CAMx v7.1 User’s Guide could be cited (Ramboll, 2021).
Is Bo Sea the same as the Bohai Sea? I think Bohai Sea is more commonly seen in English.
In several places numeric values are given with more precision than needed, for example line 47 “contributing approximately 28.36% to nighttime accumulation” could be “approximately 28%”. Consider whether less precision would make numbers more readable.
I found Figure S1 difficult to read, can the resolution be improved?
References
Emery, C., Baker, K., Wilson, G. and Yarwood, G., 2024. Comprehensive air quality model with extensions: formulation and evaluation for ozone and particulate matter over the US. Atmosphere, 15(10), p.1158.
Karamchandani, P., Emery, C., Yarwood, G., Lefer, B., Stutz, J., Couzo, E. and Vizuete, W., 2015. Implementation and refinement of a surface model for heterogeneous HONO formation in a 3-D chemical transport model. Atmospheric Environment, 112, pp.356-368.
Ramboll, 2020. User’s guide, comprehensive air quality model with extensions, version 7.10. Available at: https://www.camx.com/Files/CAMxUsersGuide_v7.10.pdf