
the Creative Commons Attribution 4.0 License.
the Creative Commons Attribution 4.0 License.
 | 11 Dec 2025
Seasonal upwelling–dust controls on export production in the Canary Current System revealed by Lagrangian particle tracking
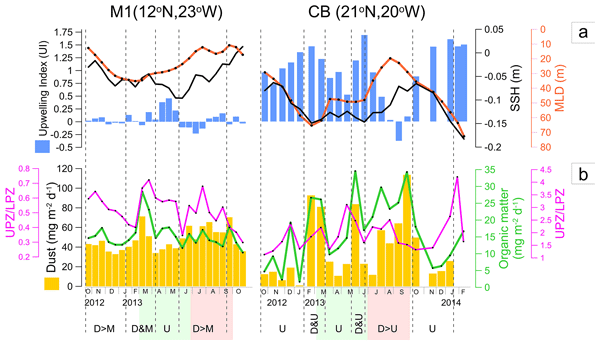
Abstract. The Canary Current System (CCS) is a major eastern boundary upwelling system where intense nearshore productivity, dynamic offshore transport, and Saharan dust deposition jointly shape biogeochemical cycling. Understanding how these physical and atmospheric forcings regulate particulate export is crucial for assessing the biological carbon pump under ongoing North Atlantic warming. Here we combine Lagrangian backtracking of satellite-derived chlorophyll-a (Chl-a), particulate inorganic carbon (PIC), and primary production (PP) with one year of sediment trap fluxes from Cape Blanc (CB) and M1, integrating lithogenic, organic, and coccolith species export with satellite-based upwelling, sea surface height (SSH), aerosol optical depth (AOD), and in situ water-column observations.
The results reveal strong seasonal connectivity between coastal upwelling, offshore transport, and deep export. Late winter–spring intensification of mixing, upwelling, and filament/eddy activity sustained elevated Chl-a, PP, PIC, and high CaCO₃ fluxes, with sinking assemblages dominated by fast-blooming placolith-bearing coccolithophores —especially at CB. Lagrangian trajectories further show that this connectivity weakens offshore, with strong coast-to-open-ocean declines in Chl-a, PP, and PIC—particularly along pathways to M1—highlighting reduced cross-shelf transfer and a stronger yearlong influence of stratified tropical waters at that site.
During summer–autumn, weakened upwelling and intrusions of warm Mauritanian Current waters reduced surface productivity at both traps, yet deep organic matter export remained high—most prominently at CB and even at the persistently oligotrophic M1. Across this period, elevated Saharan dust deposition coincided with enhanced particle fluxes. Multivariate statistical analyses show strong negative correlations between dust and all upper photic zone (UPZ) productivity indicators, and positive associations with warm, stratified conditions dominated by tropical, non-blooming lower photic zone (LPZ) taxa typical—suggesting that mineral ballasting was as the dominant seasonal dust effect. At CB, where summer cross-shelf transfer weakened, the persistence of high export under low surface Chl-a suggests that lateral and subsurface supply of previously produced organic matter played a major role, with Saharan dust further enhancing its downward transfer through mineral ballasting.
Nonetheless, several dust-associated export pulses also displayed increases in coccolith UPZ/LPZ ratios, suggesting episodic fertilisation responses by fast-blooming taxa superimposed on a predominantly ballasting-driven regime. Importantly, dust contributed under both windy, high-productivity late winter–spring conditions and during the stratified summer–autumn phase, sustaining downward particle flux even when local surface productivity was low. The weak relationship between AOD and measured dust flux reflects cloud-induced suppression of satellite AOD retrievals during wet deposition rather than reduced dust deposition.
Altogether, these results demonstrate a dual physical–atmospheric control on export in the central–southern CCS. Upwelling and cross-shelf transport fuel the winter–spring CaCO₃-rich export regime, whereas Saharan dust plays a particularly important role in maintaining organic-matter fluxes under summer–autumn stratification through ballasting, with secondary episodic fertilisation. These findings contribute to refine the mechanistic understanding of coast-to-ocean and vertical export pathways and help constrain how dust–upwelling interactions will shape the biological carbon pump under future climate forcing.
-
Notice on discussion status
The requested preprint has a corresponding peer-reviewed final revised paper. You are encouraged to refer to the final revised version.
-
Preprint
(5794 KB)
-
Supplement
(444 KB)
-
The requested preprint has a corresponding peer-reviewed final revised paper. You are encouraged to refer to the final revised version.
- Preprint
(5794 KB) - Metadata XML
-
Supplement
(444 KB) - BibTeX
- EndNote
- Final revised paper


Journal article(s) based on this preprint
Interactive discussion
Status: closed
-
RC1: 'Comment on egusphere-2025-5789', Anonymous Referee #1, 18 Feb 2026
-
AC1: 'Reply on RC1', Catarina Guerreiro, 17 May 2026
The comment was uploaded in the form of a supplement: https://egusphere.copernicus.org/preprints/2025/egusphere-2025-5789/egusphere-2025-5789-AC1-supplement.pdf
-
AC1: 'Reply on RC1', Catarina Guerreiro, 17 May 2026
-
RC2: 'Comment on egusphere-2025-5789', Anonymous Referee #2, 22 Apr 2026
This preprint by Guerreiro et al. investigates how seasonal upwelling and Saharan dust deposition jointly control particulate export production in the central–southern Canary Current System. The study integrates Lagrangian backtracking of satellite-derived biogeochemical parameters such as chlorophyll-a, particulate inorganic carbon, and primary production with approximately 13–16 months of sediment trap flux data from two deep-ocean moorings collected between October 2012 and early 2014. These are combined with multivariate statistical analyses, in situ CTD profiles, and extant coccolithophore observations from a 2023 cruise. In their paper, the authors find that there is a physical-atmospheric control on export production. The Saharan dust acts as a mineral ballast, accelerating the sinking of pre-existing biogenic material, with secondary episodic fertilisation responses during dust-associated export pulses.
This paper is generally well written, it is strong because of the different methodological integration, it addresses an important challenge in this region which is the role of Saharan dust and coastal upwelling in driving the export production. The paper clearly resolves the seasonal phases during which deep export is decoupled from surface productivity and links it to lateral and subsurface supply mechanisms.
I have a few comments regarding the writing and the content of the article.
Comments related to the content:
- My main issue with the paper is that it relies on only a single continuous deployment period of approximately 13–16 months of sediment trap collected over a decade ago (2012–2014), which raises some questions about the representativeness of the findings given the strong interannual variability acknowledged by the authors themselves, particularly at site M1. In Line 597- 601, you note that surface Chl-a was higher in April 2012 and March–April 2014 than during the study period, and attribute this to above-average surface warming during 2013. While you mention the interannual variability, you don’t mention or acknowledge the period limitation. I suggest mentioning it explicitly either in the discussion or the conclusions, where the generality of your findings is mostly asserted there.
- Another issue in the manuscript is that the authors claim that Saharan dust acts primarily through mineral ballasting rather than nutrient fertilisation. While table 1 and Fig 3 are consistent with this interpretation, they don’t really show a direct relationship. The multivariate analyses show that dust varies with warm stratified conditions while being negatively correlated with surface productivity indicators, which the authors interpret as evidence against fertilisation. In addition, no direct measurements of nutrient addition, iron bioavailability, or phytoplankton growth responses to dust inputs are available in this dataset, meaning the ballasting versus fertilisation question ultimately remains unresolved, despite the confidence with which the ballasting interpretation is presented in the conclusions. The authors should accurately reflect the indirect and correlative nature of their evidence. The statements presented the mineral ballasting as the demonstrated dominant mechanism; this should be reframed as a working hypothesis consistent with the observed statistical patterns rather than a firmly established conclusion. The authors should also more explicitly acknowledge that dust deposition systematically co-occurs with stratified oligotrophic conditions in this region, making it statistically very difficult to separate a true ballasting signal from the background oceanographic state using correlational methods alone. Maybe the authors can outline what additional direct measurements, such as iron addition experiments, aggregate composition analyses, dust associated nutrient flux measurements, would be required to firmly resolve this question in future work.
Comments related to the writing: Some of the phrases are overcomplex or very long.
- Abstract: Here we combine Lagrangian backtracking of satellite-derived chlorophyll-a (Chl-a), particulate inorganic carbon (PIC), and primary production (PP) with one year of sediment trap fluxes from Cape Blanc (CB) and M1, integrating lithogenic, organic, and coccolith species export with satellite-based upwelling, sea surface height (SSH), aerosol optical depth (AOD), and in situ water-column observations. What is M1 here? It is not defined in your abstract. this sentence is very long, I suggest splitting it into two sentences, one describing the lagrangian approach and one the datasets integrated.
- some repetition, check lines 382, 391, and 591: notable notable differences, of of Chl-a, thus thus restricting
- What are the fast-blooming placolith-bearing coccolithophores? it is used everywhere but it would be useful to explain what it is before introducing it.
- line 655: can you modify surprisingly into unexpectedly?
- The paper alternates between "lithogenic flux", "dust flux", "mineral dust", and "aeolian dust" when referring to essentially the same proxy measurement, if I am not mistaken. These terms are not really identical in the strict meaning, and the inconsistencies are a bit confusing. Can you please define which term is used as the dust proxy?
- Line 893: “contribute to refine” can be replaced by “improve our mechanistic understanding….”
- page 26 and 27: why are windy, dry months and warmer months in bold?
- Figure 4 and 5 with the lagrangian maps, with 36 individual map panels per figure, these figures are extremely difficult to read. The individual panels are very small, making it nearly impossible to discern spatial detail in the trajectory patterns. The red dots indicating trap locations are very small and hard to locate consistently across panels. Maybe it would be best to move some of these to the supplementary.
- Fig 6b,c, the x-axis labels are very small and densely packed.
Citation: https://doi.org/10.5194/egusphere-2025-5789-RC2 -
AC2: 'Reply on RC2', Catarina Guerreiro, 17 May 2026
The comment was uploaded in the form of a supplement: https://egusphere.copernicus.org/preprints/2025/egusphere-2025-5789/egusphere-2025-5789-AC2-supplement.pdf
Peer review completion


Interactive discussion
Status: closed
-
RC1: 'Comment on egusphere-2025-5789', Anonymous Referee #1, 18 Feb 2026
GENERAL COMMENTS
The article by Guerreiro et al. presents an interesting multidisciplinary study of the oceanographic factors driving export at two time series stations in the eastern tropical Atlantic Ocean. The authors use in situ sediment traps, satellite data and Lagrangian particle tracking modelling to examine the source of material collected in the traps and how this changes seasonally with changes in the strength of localised coastal upwelling. The article is interesting and well written, though there are some slight grammatical nuances that should be addressed, and the results presented (generally) support the conclusions drawn. The ‘generally support’ comment stems from the choice of graphical presentation of the linkages between satellite sources and trap material, specifically Figures 4, 5a-5c, and 6a-6d. These figures are difficult to interpret and figure panels in some cases go across 3 or 4 journal pages, making the interpretation even more challenging. The authors are strongly encouraged to consider how these results can be presented differently and/or the key patterns made more obvious. In terms of grammatical nuances, there is an abundance of ‘dashes’ in the text rather than a use of commas, colons, semi-colons, parenthesis or shorter sentence structure. This may be a result from the use of ChatGPT (as indicated in the acknowledgements) and show where this tool was used to assist in the language editing. This is most likely an editorial decision, but this reviewer found the abundant dashes broke up the narrative and at times confused the point(s) being made.
SPECIFIC COMMENTS
Ln 20, what is M1? Is this an abbreviation?
Ln 29, both trap sites rather than both traps?
Lns 31-33, consider rephrasing or explaining what is meant by ‘productivity indicators in terms of species floral groups (see also Ln 37 and coccolith UPZ/LPZ).
Ln 58, consider replacing ‘-‘ with a comma, colon, semi-colon, or simply spitting the long lines into two. Overall, the use of dashes throughout the article is confusing and at times breaks the flow of text. Consider replacing all the dashes with either commas, parentheses or restructuring the sentences to avoid this. (See also dashes on Lns 68, 69, 88, 90, 113, 306, 530, 535, 536, 542, 556, 557, 559, 566, 567, 573, 574, 583, 584, 616, 616, 619, 620, 621, 641,642, 655, 663, 666, 668, 686, 715, 722, 729, 770, 780, 800, 808, and 817).
Lns 70-71, conditional phrase at the end needs rephrasing.
Ln 87, remove extra ‘in’.
Ln 92, define CbPM.
Ln 95, is ‘CBeu’ an abbreviation?
Ln 101, replace ‘mean’ with ‘method: ‘sediment traps remain the dominant <method> of …’
Ln 103, ‘organic carbon matter’? Suggest organic carbon or organic matter.
Ln 104, ‘ground-truthing data’ rather than ‘ground-truth’.
Lns 106-110, long sentence, consider splitting into two.
Figure 1: text on this plot is very small, consider making bigger so that it is readable when published.
Ln 130, what is the SACW nutrient-enriched relative to?
Ln 213, consider providing the sinking speed assumed when stating that ‘vertical flux of material is even and relatively fast’.
Ln 216, consider rephrasing to ‘from the coast to each trap location’ rather than ‘traps’ locations’.
Fig 2: On (b) primary production should be blue ? On (d) are the coccolith fluxes and satellite PIC values correct (i.e., 200 x106 = 200,000,000 mol C m-3 or should it be 200 x 10-6 = 0.0002 or 0.2 mmol C m-3)? On (e) is it worth highlighting that the ratios are molar?
Ln 320, where the p-values for the multiple pairwise Pearson correlations Bonferroni Corrected to account for the high number of tests?
Fig. 3: The text below the PC score axis is confusing and contains too many abbreviations to have much value. It also replicates the information in Table 2.
Fig. 4: Could these be increased in size by removing the identical scale bars and limiting the eastwards extent of the plots? Quite difficult to see at this resolution. Same comment for Figs. 5a-5c. Also, should these be separate figures (5, 6 and 7) rather than sub-figures?
Fig. 6a-d: Bar charts far too small to see. Difficult to understand these plots due to the multiple information and small labelling of the axis. It is difficult to determine clearly the patterns and trends in the results as given in the text when referencing to these plots (e.g., Ln 535, ‘much steeper offshore declines along trajectories toward M1 compared to persistently higher productivity in coastal and trap proximal waters at CB (Figs. 6a-c)’). Consider a different way to plot this data, e.g., Hovmoller plots with signal intensity rather than histograms?
Ln 540 and elsewhere, the ‘-a’ in chlorophyll-a should be italicised throughout. At present it is variable whether it is (Ln 530) or is not (Ln 540).
Ln 548, why the use of bold for ‘windy, dry months of boreal winter and spring’? Also, on Ln 586 the use of bold is not clear why.
Ln 569, rephrase ‘this typically occur’.
Ln 598, ‘worth noting’ or ‘worth noticing’?
Ln 618, suggest rephrase ‘negative side groups indicators of warm ..’
Ln 686-387, reference needed to support the dominance of small photo-adapted eukaryotes in deep DCM.
Ln 751, correct spelling ‘co-ocurring’.
Citation: https://doi.org/10.5194/egusphere-2025-5789-RC1 -
AC1: 'Reply on RC1', Catarina Guerreiro, 17 May 2026
The comment was uploaded in the form of a supplement: https://egusphere.copernicus.org/preprints/2025/egusphere-2025-5789/egusphere-2025-5789-AC1-supplement.pdf
-
AC1: 'Reply on RC1', Catarina Guerreiro, 17 May 2026
-
RC2: 'Comment on egusphere-2025-5789', Anonymous Referee #2, 22 Apr 2026
This preprint by Guerreiro et al. investigates how seasonal upwelling and Saharan dust deposition jointly control particulate export production in the central–southern Canary Current System. The study integrates Lagrangian backtracking of satellite-derived biogeochemical parameters such as chlorophyll-a, particulate inorganic carbon, and primary production with approximately 13–16 months of sediment trap flux data from two deep-ocean moorings collected between October 2012 and early 2014. These are combined with multivariate statistical analyses, in situ CTD profiles, and extant coccolithophore observations from a 2023 cruise. In their paper, the authors find that there is a physical-atmospheric control on export production. The Saharan dust acts as a mineral ballast, accelerating the sinking of pre-existing biogenic material, with secondary episodic fertilisation responses during dust-associated export pulses.
This paper is generally well written, it is strong because of the different methodological integration, it addresses an important challenge in this region which is the role of Saharan dust and coastal upwelling in driving the export production. The paper clearly resolves the seasonal phases during which deep export is decoupled from surface productivity and links it to lateral and subsurface supply mechanisms.
I have a few comments regarding the writing and the content of the article.
Comments related to the content:
- My main issue with the paper is that it relies on only a single continuous deployment period of approximately 13–16 months of sediment trap collected over a decade ago (2012–2014), which raises some questions about the representativeness of the findings given the strong interannual variability acknowledged by the authors themselves, particularly at site M1. In Line 597- 601, you note that surface Chl-a was higher in April 2012 and March–April 2014 than during the study period, and attribute this to above-average surface warming during 2013. While you mention the interannual variability, you don’t mention or acknowledge the period limitation. I suggest mentioning it explicitly either in the discussion or the conclusions, where the generality of your findings is mostly asserted there.
- Another issue in the manuscript is that the authors claim that Saharan dust acts primarily through mineral ballasting rather than nutrient fertilisation. While table 1 and Fig 3 are consistent with this interpretation, they don’t really show a direct relationship. The multivariate analyses show that dust varies with warm stratified conditions while being negatively correlated with surface productivity indicators, which the authors interpret as evidence against fertilisation. In addition, no direct measurements of nutrient addition, iron bioavailability, or phytoplankton growth responses to dust inputs are available in this dataset, meaning the ballasting versus fertilisation question ultimately remains unresolved, despite the confidence with which the ballasting interpretation is presented in the conclusions. The authors should accurately reflect the indirect and correlative nature of their evidence. The statements presented the mineral ballasting as the demonstrated dominant mechanism; this should be reframed as a working hypothesis consistent with the observed statistical patterns rather than a firmly established conclusion. The authors should also more explicitly acknowledge that dust deposition systematically co-occurs with stratified oligotrophic conditions in this region, making it statistically very difficult to separate a true ballasting signal from the background oceanographic state using correlational methods alone. Maybe the authors can outline what additional direct measurements, such as iron addition experiments, aggregate composition analyses, dust associated nutrient flux measurements, would be required to firmly resolve this question in future work.
Comments related to the writing: Some of the phrases are overcomplex or very long.
- Abstract: Here we combine Lagrangian backtracking of satellite-derived chlorophyll-a (Chl-a), particulate inorganic carbon (PIC), and primary production (PP) with one year of sediment trap fluxes from Cape Blanc (CB) and M1, integrating lithogenic, organic, and coccolith species export with satellite-based upwelling, sea surface height (SSH), aerosol optical depth (AOD), and in situ water-column observations. What is M1 here? It is not defined in your abstract. this sentence is very long, I suggest splitting it into two sentences, one describing the lagrangian approach and one the datasets integrated.
- some repetition, check lines 382, 391, and 591: notable notable differences, of of Chl-a, thus thus restricting
- What are the fast-blooming placolith-bearing coccolithophores? it is used everywhere but it would be useful to explain what it is before introducing it.
- line 655: can you modify surprisingly into unexpectedly?
- The paper alternates between "lithogenic flux", "dust flux", "mineral dust", and "aeolian dust" when referring to essentially the same proxy measurement, if I am not mistaken. These terms are not really identical in the strict meaning, and the inconsistencies are a bit confusing. Can you please define which term is used as the dust proxy?
- Line 893: “contribute to refine” can be replaced by “improve our mechanistic understanding….”
- page 26 and 27: why are windy, dry months and warmer months in bold?
- Figure 4 and 5 with the lagrangian maps, with 36 individual map panels per figure, these figures are extremely difficult to read. The individual panels are very small, making it nearly impossible to discern spatial detail in the trajectory patterns. The red dots indicating trap locations are very small and hard to locate consistently across panels. Maybe it would be best to move some of these to the supplementary.
- Fig 6b,c, the x-axis labels are very small and densely packed.
Citation: https://doi.org/10.5194/egusphere-2025-5789-RC2 -
AC2: 'Reply on RC2', Catarina Guerreiro, 17 May 2026
The comment was uploaded in the form of a supplement: https://egusphere.copernicus.org/preprints/2025/egusphere-2025-5789/egusphere-2025-5789-AC2-supplement.pdf
Peer review completion
Journal article(s) based on this preprint
Data sets
Coccolith export fluxes and environmental data from sediment trap M1U C. V. Guerreiro et al. https://doi.org/10.1594/PANGAEA.941574
Coccolith export fluxes and environmental data from sediment trap CB C. V. Guerreiro et al. https://doi.org/10.1594/PANGAEA.941544
Coccolith-carbonate species fluxes and environmental data from sediment trap site M1U C. V. Guerreiro et al. https://doi.org/10.1594/PANGAEA.940404
Coccolith-carbonate species fluxes and environmental data from sediment trap site CB C. V. Guerreiro et al. https://doi.org/10.1594/PANGAEA.940504
Particle fluxes from sediment trap M1U [dataset] Laura F. Korte et al. https://doi.org/10.1594/PANGAEA.872086
Viewed
| HTML | XML | Total | Supplement | BibTeX | EndNote | |
|---|---|---|---|---|---|---|
| 1,833 | 1,273 | 208 | 3,314 | 332 | 175 | 191 |
- HTML: 1,833
- PDF: 1,273
- XML: 208
- Total: 3,314
- Supplement: 332
- BibTeX: 175
- EndNote: 191
Viewed (geographical distribution)
| Country | # | Views | % |
|---|
| Total: | 0 |
| HTML: | 0 |
| PDF: | 0 |
| XML: | 0 |
- 1
Catarina V. Guerreiro

Bror F. Jonsson
Peter Land
Javier Arístegui
Jan-Berend Stuut
Afonso Ferreira
Gavin H. Tilstone
Vanda Brotas
Steve B. Groom
The requested preprint has a corresponding peer-reviewed final revised paper. You are encouraged to refer to the final revised version.
- Preprint
(5794 KB) - Metadata XML
-
Supplement
(444 KB) - BibTeX
- EndNote
- Final revised paper
This study examines how winds, ocean currents, and Saharan dust affect the movement of carbon-rich material from surface waters to the deep ocean off Northwest Africa. By tracing surface seawater pathways and quantifying sinking particles throughout the year, the work shows that winter-spring upwelling drive this transfer, while summer dust helps carry organic matter downward. These findings can be used to improve forecasts of how the ocean will store carbon in the future.
This study examines how winds, ocean currents, and Saharan dust affect the movement of...
GENERAL COMMENTS
The article by Guerreiro et al. presents an interesting multidisciplinary study of the oceanographic factors driving export at two time series stations in the eastern tropical Atlantic Ocean. The authors use in situ sediment traps, satellite data and Lagrangian particle tracking modelling to examine the source of material collected in the traps and how this changes seasonally with changes in the strength of localised coastal upwelling. The article is interesting and well written, though there are some slight grammatical nuances that should be addressed, and the results presented (generally) support the conclusions drawn. The ‘generally support’ comment stems from the choice of graphical presentation of the linkages between satellite sources and trap material, specifically Figures 4, 5a-5c, and 6a-6d. These figures are difficult to interpret and figure panels in some cases go across 3 or 4 journal pages, making the interpretation even more challenging. The authors are strongly encouraged to consider how these results can be presented differently and/or the key patterns made more obvious. In terms of grammatical nuances, there is an abundance of ‘dashes’ in the text rather than a use of commas, colons, semi-colons, parenthesis or shorter sentence structure. This may be a result from the use of ChatGPT (as indicated in the acknowledgements) and show where this tool was used to assist in the language editing. This is most likely an editorial decision, but this reviewer found the abundant dashes broke up the narrative and at times confused the point(s) being made.
SPECIFIC COMMENTS
Ln 20, what is M1? Is this an abbreviation?
Ln 29, both trap sites rather than both traps?
Lns 31-33, consider rephrasing or explaining what is meant by ‘productivity indicators in terms of species floral groups (see also Ln 37 and coccolith UPZ/LPZ).
Ln 58, consider replacing ‘-‘ with a comma, colon, semi-colon, or simply spitting the long lines into two. Overall, the use of dashes throughout the article is confusing and at times breaks the flow of text. Consider replacing all the dashes with either commas, parentheses or restructuring the sentences to avoid this. (See also dashes on Lns 68, 69, 88, 90, 113, 306, 530, 535, 536, 542, 556, 557, 559, 566, 567, 573, 574, 583, 584, 616, 616, 619, 620, 621, 641,642, 655, 663, 666, 668, 686, 715, 722, 729, 770, 780, 800, 808, and 817).
Lns 70-71, conditional phrase at the end needs rephrasing.
Ln 87, remove extra ‘in’.
Ln 92, define CbPM.
Ln 95, is ‘CBeu’ an abbreviation?
Ln 101, replace ‘mean’ with ‘method: ‘sediment traps remain the dominant <method> of …’
Ln 103, ‘organic carbon matter’? Suggest organic carbon or organic matter.
Ln 104, ‘ground-truthing data’ rather than ‘ground-truth’.
Lns 106-110, long sentence, consider splitting into two.
Figure 1: text on this plot is very small, consider making bigger so that it is readable when published.
Ln 130, what is the SACW nutrient-enriched relative to?
Ln 213, consider providing the sinking speed assumed when stating that ‘vertical flux of material is even and relatively fast’.
Ln 216, consider rephrasing to ‘from the coast to each trap location’ rather than ‘traps’ locations’.
Fig 2: On (b) primary production should be blue ? On (d) are the coccolith fluxes and satellite PIC values correct (i.e., 200 x106 = 200,000,000 mol C m-3 or should it be 200 x 10-6 = 0.0002 or 0.2 mmol C m-3)? On (e) is it worth highlighting that the ratios are molar?
Ln 320, where the p-values for the multiple pairwise Pearson correlations Bonferroni Corrected to account for the high number of tests?
Fig. 3: The text below the PC score axis is confusing and contains too many abbreviations to have much value. It also replicates the information in Table 2.
Fig. 4: Could these be increased in size by removing the identical scale bars and limiting the eastwards extent of the plots? Quite difficult to see at this resolution. Same comment for Figs. 5a-5c. Also, should these be separate figures (5, 6 and 7) rather than sub-figures?
Fig. 6a-d: Bar charts far too small to see. Difficult to understand these plots due to the multiple information and small labelling of the axis. It is difficult to determine clearly the patterns and trends in the results as given in the text when referencing to these plots (e.g., Ln 535, ‘much steeper offshore declines along trajectories toward M1 compared to persistently higher productivity in coastal and trap proximal waters at CB (Figs. 6a-c)’). Consider a different way to plot this data, e.g., Hovmoller plots with signal intensity rather than histograms?
Ln 540 and elsewhere, the ‘-a’ in chlorophyll-a should be italicised throughout. At present it is variable whether it is (Ln 530) or is not (Ln 540).
Ln 548, why the use of bold for ‘windy, dry months of boreal winter and spring’? Also, on Ln 586 the use of bold is not clear why.
Ln 569, rephrase ‘this typically occur’.
Ln 598, ‘worth noting’ or ‘worth noticing’?
Ln 618, suggest rephrase ‘negative side groups indicators of warm ..’
Ln 686-387, reference needed to support the dominance of small photo-adapted eukaryotes in deep DCM.
Ln 751, correct spelling ‘co-ocurring’.