
the Creative Commons Attribution 4.0 License.
the Creative Commons Attribution 4.0 License.
 | 13 Oct 2025
Chlorophyll-a Variation Trends in Marginal Seas: Assessing the Impact of Global warming and Anthropogenic Activities Using Time Series Satellite Data (1998–2020)
Abstract. Global warming has been identified as the main cause of the decline of surface chlorophyll-a (Chl-a) concentrations in the oceans. Conversely, an increase in Chl-a concentration has been observed in a number of marginal seas over recent decades due to increasing anthropogenic input of key nutrients. However, with the intensification of global warming, its impact on Chl-a in coastal waters has been rarely studied, with the superimposed effects of human regulation of nutrients emissions. This study utilized time series of oceanic color satellite data from 1998 to 2020 to examine the spatio-temporal distribution of Chl-a in a range of marginal sea areas, and its relationship with environmental factors, particularly with sea surface temperature (SST), photosynthetically active radiation (PAR) and surface wind speed (SWS) are considered as well. The results suggested that the sea areas examined with varying mixing and water exchange characteristics and degrees of human influence have differing responses (in terms of their Chl-a trends) to increasing SST. Specifically, eutrophic closed seas with weak hydrodynamic exchange capacity, like the Bohai Sea, increasing SST did not apparent suppress Chl-a concentration, but instead continuous increase in Chl-a was observed in the central of the sea. In comparison, the open marginal seas examined show strong negative relationships between SST and Chl-a with distance offshore regardless of the degree of pressure from human activities, indicating that expected global warming effects driving reductions in Chl-a are extending to nearshore / marginal sea areas. This trend may be exacerbated due to stricter environment management policies imposed in recent years which have reduced anthropogenic nutrient inputs. Distinct from the above effect of global warming, PAR and SWS shape Chl-a in ways that are strongly modulated by geography and climate. PAR is the dominant positive control only in the Amazon estuary, where equatorial cloudiness and high turbidity create a light-limited regime, so any PAR increase directly stimulates phytoplankton. In mid-latitude open waters, PAR is secondary to SST: its seasonal rise is coupled to SST and therefore correlates negatively with Chl-a once thermal stratification reduces nutrient supply. SWS emerges as a key driver in the three open regimes (East China Sea >US East Coast> Amazon shelf), through injecting nutrient-rich cold deep water and episodically raise Chl-a. Inside the two enclosed seas (Bohai, Gulf of Mexico), correlations with both PAR and SWS are weak (│r│ < 0.2); Thus, PAR and SWS control Chl-a in a complex way, but both are more or less links to SST and nutrients input. This study highlights the complex interaction between primary production, SST, nutrient inputs and exchange, and environmental protection controls under the dual pressures of changes in human activity and coastal development, and global warming.
-
Notice on discussion status
The requested preprint has a corresponding peer-reviewed final revised paper. You are encouraged to refer to the final revised version.
-
Preprint
(3012 KB)
-
The requested preprint has a corresponding peer-reviewed final revised paper. You are encouraged to refer to the final revised version.
- Preprint
(3012 KB) - Metadata XML
- BibTeX
- EndNote
- Final revised paper


Journal article(s) based on this preprint
Interactive discussion
Status: closed
-
RC1: 'Comment on egusphere-2025-4558', Mian Liu, 19 Nov 2025
General Comments
This manuscript presents a comprehensive analysis of chlorophyll-a (Chl-a) trends in five marginal seas with varying hydrodynamic and anthropogenic characteristics, using satellite-derived data from 1998 to 2020. The study addresses a timely and important topic—the interplay between global warming and human activities in shaping coastal phytoplankton dynamics. The methodology is robust, combining trend analysis, stability assessment, and correlation/PCA to disentangle the effects of SST, PAR, and SWS on Chl-a. The findings highlight the contrasting responses of enclosed vs. open seas to warming, which is a valuable contribution to the field. The manuscript is generally well-structured and clearly written, though some sections could benefit from greater clarity and methodological detail.
Major Comments
1. Data Integration and Harmonization:
The use of multiple satellite sensors (SeaWiFS and MODIS) is appropriate for long-term trend analysis. However, the methodology for merging and harmonizing these datasets (Appendix A) is not sufficiently detailed in the main text. The authors should clarify how they addressed potential biases between sensors, especially for Chl-a and PAR, and justify the selection of specific months for correction.
2. SST Period Identification:
The identification of SST warming and stable periods using a 4-year moving window is innovative. However, the rationale for choosing this window length and its suitability for capturing climate-scale signals versus interannual variability (e.g., ENSO) should be more thoroughly explained.
3. Interpretation of Correlation vs. Causation:
While the study identifies correlations between Chl-a and environmental factors, the discussion often implies causation. The authors should more carefully distinguish between correlation and causation, especially when attributing Chl-a changes to global warming versus anthropogenic nutrient inputs.
4. Spatial Heterogeneity and Scale:
The study covers large and diverse regions, but some conclusions (e.g., about “open” vs. “enclosed” seas) may oversimplify intra-regional variability. More nuanced discussion of sub-regional processes (e.g., upwelling, river plumes) would strengthen the interpretation.
5. Anthropogenic Proxy:
Population density is used as a proxy for anthropogenic pressure, which is reasonable but indirect. The authors should acknowledge the limitations of this approach and consider discussing other potential indicators (e.g., fertilizer use, wastewater discharge) where data are available.
Specific Comments
1. Abstract:
The abstract clearly summarizes the main findings but could better highlight the novel aspects of the study, such as the contrasting responses of enclosed vs. open seas to SST rise.
2. Introduction:
Lines 65–70: The discussion of upwelling and its role in Chl-a dynamics is well-placed, but the transition to anthropogenic effects seems a bit abrupt and could be smoother.
3. Methods:
Section 2.2: Please specify how the missing data were handled, especially in coastal areas with high turbidity or cloud cover.
Section 2.3.1: The M-K trend test is appropriately applied, but the justification for using both M-K and least squares trend analysis should be briefly explained.
Results:
Figure 4: The spatial patterns are informative, but the color scales for Chl-a are not always intuitive. Consider using a consistent scale across panels for easier comparison.
Figure 9: The correlation maps are useful, but the classification of correlation strength (e.g., “high negative”) should be clearly defined in the caption or legend.
Discussion:
Lines 420–430: The interpretation of PAR in the Amazon Estuary is insightful, but the mechanism behind the weak SST-Chl-a relationship could be elaborated (e.g., barrier layer effects).
Lines 530–540: The conclusion that Chl-a in the Bohai Sea is less impacted by warming due to high nutrient levels is compelling but should be tempered with the acknowledgment of potential lag effects or nonlinear responses.
Conclusions:
The conclusions are well-supported but could be more forward-looking. For example, what are the implications for coastal management under future warming scenarios?
References:
The reference list is comprehensive and up-to-date, though a few recent key studies on marginal sea Chl-a trends (e.g., from the past 2–3 years) could be included.
Format adjustments:
Line 51: The references cited are divided into two parentheses. Please correct.
Line 75: a missing space between the end of the sentence and the cited references
Line 80: Similarly, see line 75
Line 86: Similarly, see line 75
Line 145: It is recommended that the complete form be placed on one page, and the title of the tableshould be placed in the center. (Similar situations will not be listed one by one)
Line 161: The title of the table should come before the table, also the complete form should be placed on one page.
Line 210: The title of the tableshould be placed in the center. (The following tables all have similar situations and will not list them one by one.)
There might be format errors that the reviewer have or omitted or not yet discovered. Please check carefully
Overall Recommendation:
This manuscript presents a valuable and well-executed study that advances our understanding of Chl-a dynamics in marginal seas under dual pressures of climate change and human activity. With minor to moderate revisions—particularly in methodological transparency and causal interpretation—it will be suitable and worthy for publication on Ocean Science.Citation: https://doi.org/10.5194/egusphere-2025-4558-RC1 -
AC1: 'Reply on RC1', Nan Yao, 25 May 2026
Replies to reviewer(s) comments
Dear Editor and Reviewers,
This is the response of the comments on the manuscript “Chlorophyll-a Variation Trends in Marginal Seas: Assessing the Impact of Global Heating and Anthropogenic Activities Using Time Series Satellite Data (1998-2020)” (with ID MARGO-D-23-00381). We concur with your careful review and precise comments, and appreciate your constructive suggestions very much for improving the manuscript.
In this revised manuscript, we substantially improved the logic of the manuscript genreally to make the presentation more clear. Moreover, we seek help from professional language editing to improve the quality and meet the journal’s required standard.
For your convenience, all the changes of the manuscript and relevant discussions have been highlighted in yellow color in the revised manuscript.
Sincerely yours,
Xiaoyu ZHANG and co-authors
---------------------------------------------------------------------------------------------------------------------------------
Reponses to Reviewer's Responses to Questions
Please see the item-by-item responses given as follows:
Reviewer Comments #1, Mian Liu, 19 Nov 2025
General Comments
This manuscript presents a comprehensive analysis of chlorophyll-a (Chl-a) trends in five marginal seas with varying hydrodynamic and anthropogenic characteristics, using satellite-derived data from 1998 to 2020. The study addresses a timely and important topic—the interplay between global warming and human activities in shaping coastal phytoplankton dynamics. The methodology is robust, combining trend analysis, stability assessment, and correlation/PCA to disentangle the effects of SST, PAR, and SWS on Chl-a. The findings highlight the contrasting responses of enclosed vs. open seas to warming, which is a valuable contribution to the field. The manuscript is generally well-structured and clearly written, though some sections could benefit from greater clarity and methodological detail.
Response: We sincerely thank the reviewers for their positive evaluation of our manuscript and for acknowledging the scientific merit of our work.
Major Comments
Major Comment 1: Data Integration and Harmonization:
The use of multiple satellite sensors (SeaWiFS and MODIS) is appropriate for long-term trend analysis. However, the methodology for merging and harmonizing these datasets (Appendix A) is not sufficiently detailed in the main text. The authors should clarify how they addressed potential biases between sensors, especially for Chl-a and PAR, and justify the selection of specific months for correction.
Response: To fully utilize available data to eliminate inter-sensor biases of chlorophyll-a (Chl-a) and photosynthetically active radiation (PAR), we conducted cross-calibration based on all overlapping observations of SeaWiFS and MODIS during their concurrent period, namely Period T2 from January 2003 to December 2010.
Given the longer time span of MODIS records, we took MODIS data as the reference standard. We first established a data mapping relationship between the two sensors using overlapping datasets. When calibrating SeaWiFS standalone observations, Monthly regression analysis was implemented separately. When the original SeaWiFS data show determination coefficient R2 exceeded 0.5 with calibrated data, the calibrated data was applied. For cases with poor correlation, new values were obtained by averaging original SeaWiFS data and calibrated results. and then against MODIS benchmarks. Relevant calibration details have been supplemented in Appendix A.
Major Comment 2: SST Period Identification:
The identification of SST warming and stable periods using a 4-year moving window is innovative. However, the rationale for choosing this window length and its suitability for capturing climate-scale signals versus interannual variability (e.g., ENSO) should be more thoroughly explained.
Response: To determine the optimal parameter, we tested different moving window sizes of 3, 4 and 5 years for warm season identification. The 3-year window is too short, which tends to capture sea water warming signals unrelated to global warming and produces excessive warming events inconsistent with reality. The 5-year window has an overly long timescale, likely omitting actual warming variations induced by global warming within short periods. Comparative analyses showed that the 4-year moving window yielded the most robust results that match realistic conditions, outperforming both the 3-year and 5-year alternatives. Consequently, the 4-year window was ultimately adopted in this study.
Major Comment 3: Interpretation of Correlation vs. Causation:
While the study identifies correlations between Chl-a and environmental factors, the discussion often implies causation. The authors should more carefully distinguish between correlation and causation, especially when attributing Chl-a changes to global warming versus anthropogenic nutrient inputs.
Response: We sincerely thank the reviewer for highlighting the critical distinction between correlation and causation. We have carefully revised Sections 4.2.2 and 4.2.3 with terms indicating association rather than strong causal verbs. Additionally, we have added a clarifying sentence in Section 4.2.2 acknowledging that while correlations exist, confounding factors prevent us from asserting direct causation regarding the effects of global warming versus nutrient inputs
Major Comment 4: Spatial Heterogeneity and Scale:
The study covers large and diverse regions, but some conclusions (e.g., about “open” vs. “enclosed” seas) may oversimplify intra-regional variability. More nuanced discussion of sub-regional processes (e.g., upwelling, river plumes) would strengthen the interpretation.
Response: We thank the reviewer for this insightful comment regarding spatial heterogeneity. We agree that the broad classification of "open" versus "enclosed" seas required more nuanced discussion. We have revised Sections 4.2.2 and 5.1 to explicitly acknowledge the limitations of this basin-scale classification. We now emphasize that sub-regional processes—specifically upwelling and river plume dynamics (e.g., the Changjiang Diluted Water and Mississippi plume)—create significant intra-regional variability that modulates the generalized trends. Additionally, we have softened the language in the Conclusions to reflect that our findings indicate associations rather than definitive causal demonstrations. Corresponding additions have been made to Sections 4.2.2 “It is important to recognize that substantial sub-regional heterogeneity exists within the broad definitions of open and enclosed seas when generalizing the response of Chl-a to warming. For instance, the negative Chl-a-SST correlations observed in the open East China Sea are not uniform; they are modulated by localized physical processes such as the Changjiang River plume and coastal upwelling, which introduce nutrient-rich waters and alter stratification. Similarly, the Gulf of Mexico exhibits complex spatial patterns where the influence of the Mississippi River plume contrasts with the oligotrophic conditions of the central basin. These findings highlight that while basin-scale geometry is important, intra-regional processes collectively shape the local magnitude and direction of Chl-a responses.” and 5.2” (b) raises the urgency of integrating high-resolution observations and modeling to disentangle sub-regional processes (e.g., upwelling, river plumes) from basin-scale trends, which is prerequisite for accurately quantifying the relative contributions of global warming and anthropogenic nutrient inputs;” to address this point.
Major Comment 5: Anthropogenic Proxy:
Population density is used as a proxy for anthropogenic pressure, which is reasonable but indirect. The authors should acknowledge the limitations of this approach and consider discussing other potential indicators (e.g., fertilizer use, wastewater discharge) where data are available.
Response: We sincerely appreciate the reviewer’s insightful suggestion regarding the use of more direct indicators of anthropogenic pressure, such as fertilizer use and wastewater discharge. We fully agree that these variables offer a more precise representation of specific pollution/nutrients sources.
However, during our data compilation, we encountered significant challenges regarding data comparability across these specific transboundary basins: 1) For the East China Sea and Bohai Sea, official statistics are primarily reported based on administrative boundaries (provincial levels) rather than hydrological boundaries. This makes it difficult to accurately attribute nutrient loads specifically to the target marine basins. 2) For the Amazon Estuary, there is a general lack of long-term, systematic monitoring data due to limited infrastructure in the region. 3) Regarding the U.S. East Coast and Gulf of Mexico, although data are relatively complete, they often differ in format and baseline definitions compared to the Asian and South American regions. Given these constraints, population density remains the most robust, globally standardized, and continuously available metric for cross-continental comparison. It allows for consistent spatial alignment across all basins and is widely accepted in the literature as a reliable proxy for cumulative anthropogenic pressure.
Specific Comments
Specific Comment 1:
Abstract:
The abstract clearly summarizes the main findings but could better highlight the novel aspects of the study, such as the contrasting responses of enclosed vs. open seas to SST rise.
Response: We thank the reviewer for highlighting the need to better emphasize the novel aspects of our study. We agree that the contrasting responses of enclosed versus open seas to SST rise represent a key novelty. Following this suggestion, we have revised the Abstract to explicitly highlight this comparative perspective. Specifically, we added the following sentence after the introduction of the background and research gaps:
“To fill this gap, this study provides a novel comparative analysis of enclosed versus open marginal seas, revealing divergent physiological and ecological responses to rising SST across different nutrient regimes”. We believe this revision sharpens the focus of the paper and more effectively communicates the unique contribution of our work regarding the differential impacts of global warming on various coastal systems.
Specific Comment 2:
Introduction:
Lines 65–70: The discussion of upwelling and its role in Chl-a dynamics is well-placed, but the transition to anthropogenic effects seems a bit abrupt and could be smoother.
Response: We thank the reviewer for pointing out the abrupt transition in Lines 65–70. We have added a transitional sentence to bridge the discussion between natural physical processes (upwelling) and anthropogenic effects. The revised text now reads:
"However, this natural physical control can be masked or even reversed in coastal systems where anthropogenic pressures dominate."
This addition clarifies the shift in context and ensures a smoother logical flow.
Specific Comment 3:
Methods:
Section 2.2: Please specify how the missing data were handled, especially in coastal areas with high turbidity or cloud cover.
Response: The boundaries of the study area were first delineated using Natural Earth data. Kriging interpolation was adopted to fill data gaps caused by high-turbidity masking and cloud removal.
Section 2.3.1: The M-K trend test is appropriately applied, but the justification for using both M-K and least squares trend analysis should be briefly explained.
Response: Least squares trend analysis is adopted to quantify the magnitude of increasing or decreasing trends and calculate spatio-temporal variation rates. The Mann-Kendall test is used to identify whether the trends show significant rise or fall within the study period.
Specific Comment 4:
Results:
Figure 4: The spatial patterns are informative, but the color scales for Chl-a are not always intuitive. Consider using a consistent scale across panels for easier comparison.
Response: We appreciate the reviewer’s suggestion regarding the use of a consistent color scale for Figure 4. We agree that a uniform scale facilitates direct inter-comparison. However, the differences in Chl-a magnitude among the study regions (e.g., the highly eutrophic Bohai Sea versus the oligotrophic open ocean) caused the spatial gradients and detailed patterns within each specific basin to be obscured. Low-concentration areas appeared uniformly blank, while high-concentration areas were saturated. Therefore, to best highlight the distinct spatial heterogeneity and dynamic ranges characteristic of each specific marginal sea, we retained the tailored color scales for each panel. We hope the reviewer understands that this choice prioritizes the clarity of the scientific patterns presented.
Figure 9: The correlation maps are useful, but the classification of correlation strength (e.g., “high negative”) should be clearly defined in the caption or legend.
Response:
Specific Comment 5:
Discussion:
Lines 420–430: The interpretation of PAR in the Amazon Estuary is insightful, but the mechanism behind the weak SST-Chl-a relationship could be elaborated (e.g., barrier layer effects).
Response: We appreciate the reviewer’s suggestion to elaborate on the mechanism behind the weak SST-Chl-a relationship in the Amazon Estuary. As recommended, we have added a detailed explanation regarding the barrier layer effect induced by the low-salinity Amazon plume.
Please see Lines 404–407 in the revised manuscript:
“However, Amazon Estuary is an exception with insignificant negative correlation between Chl-a and SST. The variation of SST of the Amazon Estuary may be related more with input of low salinity Amazon plume, which creates a near surface barrier layer that inhibits mixing, increases SST, and prevents vertical mixing between the upper warm mixed layer and the cold deep ocean (Ferry and Reverdin, 2004; Balaguru et al., 2012; Grodsky et al., 2012; Coles et al.,2013).”
We believe this addition clarifies why the typical SST-Chl-a relationship breaks down in this specific region.
Lines 530–540: The conclusion that Chl-a in the Bohai Sea is less impacted by warming due to high nutrient levels is compelling but should be tempered with the acknowledgment of potential lag effects or nonlinear responses.
Response: We thank the reviewer for highlighting the need to temper our conclusion. We agree that the system may be subject to nonlinear dynamics. We have added the following sentence to acknowledge the potential for future threshold responses: “…which currently masks the potential impact of global warming. However this lagging effect may be temporary and subject to future nonlinear threshold responses.”
Specific Comment 6:
Conclusions:
The conclusions are well-supported but could be more forward-looking. For example, what are the implications for coastal management under future warming scenarios?
Response: Conclusions: We have expanded the conclusion to embed our findings within broader global scientific frameworks, including the Global Carbon Project (GCP), GO₂NE (Global Ocean Oxygen Network), and Marine Ecosystem Regime Shift Theory. We also explicitly discuss the implications for SDG 14 and the UN Ocean Decade, linking regional findings to global climate and sustainability challenges.
Specific Comment 7:
References:
The reference list is comprehensive and up-to-date, though could be included.
Response: some new references have been included, particulary literatures published after year 2022.
Format adjustments:
Format adjustment 1: Line 51: The references cited are divided into two parentheses. Please correct.
Response: Thank you for pointing out the formatting error. Have corrected.
Format adjustment 2: Line 75: a missing space between the end of the sentence and the cited references
Response: Thank you for pointing out the formatting error. Have corrected.
Format adjustment 3: Line 80: Similarly, see line 75
Response: Thank you for pointing out the formatting error. Have corrected.
Format adjustment 4: Line 86: Similarly, see line 75
Response: Thank you for pointing out the formatting error. Have corrected.
Format adjustment 5: Line 145: It is recommended that the complete form be placed on one page, and the title of the tableshould be placed in the center. (Similar situations will not be listed one by one)
Response: Thank you for pointing out the formatting error. We have moved the table title in the center. Additionally, we have adjusted the layout to ensure the complete table is now presented on a single page.
Format adjustment 6: Line 161: The title of the table should come before the table, also the complete form should be placed on one page.
Response: Thank you for pointing out the formatting error. We have moved the table title to the correct position above the table. Additionally, we have adjusted the layout to ensure the complete table is now presented on a single page.
Format adjustment 7: Line 210: The title of the table should be placed in the center. (The following tables all have similar situations and will not list them one by one.)
Response: Thank you for pointing out the formatting inconsistency with the table titles. We have corrected this error and centered all table titles throughout the manuscript, including those not explicitly listed. We appreciate your careful review.
Format adjustment 8: There might be format errors that the reviewer have or omitted or not yet discovered. Please check carefully
Response: We sincerely appreciate the reviewer’s diligence in reminding us to check the manuscript formatting. We take this concern very seriously. Following your advice, we have conducted a comprehensive and careful proofreading of the entire manuscript. We have corrected any format inconsistencies we could identify regarding layout, citation style, figure placement, and reference formatting. We hope the revised version now meets the journal's standards.
Overall Recommendation:
This manuscript presents a valuable and well-executed study that advances our understanding of Chl-a dynamics in marginal seas under dual pressures of climate change and human activity. With minor to moderate revisions—particularly in methodological transparency and causal interpretation—it will be suitable and worthy for publication on Ocean Science.
Response: We sincerely thank the reviewer for the encouraging comments and the thorough evaluation of our manuscript. We are pleased to learn that you find our study valuable for advancing the understanding of Chl-a dynamics under the dual pressures of climate change and human activity.
We greatly appreciate your constructive suggestions regarding methodological transparency and causal interpretation. Following your guidance, we have carefully revised the manuscript to address these points. We believe these revisions have significantly improved the clarity and rigor of the paper, and we hope the revised version meets your expectations for publication in Ocean Science.
Citation: https://doi.org/10.5194/egusphere-2025-4558-AC1
-
AC1: 'Reply on RC1', Nan Yao, 25 May 2026
-
CC1: 'Comment on egusphere-2025-4558', Shengqiang Wang, 10 Jan 2026
General comments
This manuscript presents an interesting comparative analysis of long-term Chl-a trends across five representative marginal seas with contrasting hydrodynamic conditions and anthropogenic pressures. The selection of the study regions is appropriate and well justified, covering both enclosed and open systems under different climatic and human influences. The use of multi-sensor satellite time series spanning more than two decades provides a solid data foundation, and the combination of trend analysis, stability assessment, and correlation analysis allows for a comprehensive examination of Chl-a variability. Overall, the manuscript is generally well structured, and the results are clearly presented. The discussion demonstrates a good understanding of regional oceanographic processes and places the findings in a broader context of global warming and anthropogenic nutrient regulation. This paper can be considered for publication after clarifying the following concerns.Specific comments
1. The manuscript briefly mentions that systematic errors between SeaWiFS and MODIS products were eliminated before merging the datasets. It would be helpful to provide a short quantitative description of the inter-sensor bias correction or cross-calibration results in the main text, for example by reporting mean bias or correlation statistics during the overlap period, with detailed information remaining in Appendix A.2. Chl-a, SST, PAR, and SWS datasets have different spatial resolutions. Although this is common in satellite-based studies, a short explanation of how spatial resampling or aggregation was handled would improve methodological transparency.
3. Coastal and estuarine waters often suffer from data gaps due to cloud cover or high turbidity. The authors should briefly describe how missing pixels were handled when calculating regional means and trend statistics.
4. The four-year moving window approach is reasonable. However, the authors may consider adding a brief sensitivity discussion explaining why a four-year window was selected instead of alternative window lengths, such as three or five years.
5. The manuscript states that Chl-a and SST time series were normalized before correlation analysis. It would be useful to specify whether standard z-score normalization or another approach was applied.
6. Terms such as “Eastern Coastal Waters of the US” and “U.S. East Coast” appear to be used interchangeably. Standardizing terminology throughout the manuscript would enhance clarity.
7. The Conclusions section is relatively lengthy. The authors are encouraged to further streamline this section by concisely summarizing the main findings and scientific contributions of the study. In addition, explicitly stating the limitations of the current analysis and outlining potential directions for future research would strengthen the conclusions.
8. In Figure 1a, the blue label “East Sea” should be corrected to “East China Sea”.
Citation: https://doi.org/10.5194/egusphere-2025-4558-CC1 -
AC3: 'Reply on CC1', Nan Yao, 25 May 2026
Replies to reviewer(s) comments
Dear Editor and Reviewers,
This is the response of the comments on the manuscript “Chlorophyll-a Variation Trends in Marginal Seas: Assessing the Impact of Global Heating and Anthropogenic Activities Using Time Series Satellite Data (1998-2020)” (with ID MARGO-D-23-00381). We concur with your careful review and precise comments, and appreciate your constructive suggestions very much for improving the manuscript.
In this revised manuscript, we substantially improved the logic of the manuscript genreally to make the presentation more clear. Moreover, we seek help from professional language editing to improve the quality and meet the journal’s required standard.
For your convenience, all the changes of the manuscript and relevant discussions have been highlighted in yellow color in the revised manuscript.
Sincerely yours,
Xiaoyu ZHANG and co-authors
---------------------------------------------------------------------------------------------------------------------------------
Reponses to Reviewer's Responses to Questions
CC1: 'Comment on egusphere-2025-4558', Shengqiang Wang, 10 Jan 2026
General comments
This manuscript presents an interesting comparative analysis of long-term Chl-a trends across five representative marginal seas with contrasting hydrodynamic conditions and anthropogenic pressures. The selection of the study regions is appropriate and well justified, covering both enclosed and open systems under different climatic and human influences. The use of multi-sensor satellite time series spanning more than two decades provides a solid data foundation, and the combination of trend analysis, stability assessment, and correlation analysis allows for a comprehensive examination of Chl-a variability. Overall, the manuscript is generally well structured, and the results are clearly presented. The discussion demonstrates a good understanding of regional oceanographic processes and places the findings in a broader context of global warming and anthropogenic nutrient regulation. This paper can be considered for publication after clarifying the following concerns.
Response:We sincerely thank the reviewer for the encouraging comments and the thorough evaluation of our manuscript. We are pleased that you find the comparative analysis of the five marginal seas interesting and the regional selection appropriate. We also appreciate your recognition of our data foundation and analytical approach.
As suggested, we have carefully clarified the specific concerns raised by the reviewer. Detailed responses to each comment are provided below, and corresponding revisions have been made to the manuscript to improve clarity and scientific rigor.
We hope the revised version meets your expectations and is now suitable for publication.
Specific comments
Specific comment #1: The manuscript briefly mentions that systematic errors between SeaWiFS and MODIS products were eliminated before merging the datasets. It would be helpful to provide a short quantitative description of the inter-sensor bias correction or cross-calibration results in the main text, for example by reporting mean bias or correlation statistics during the overlap period, with detailed information remaining in Appendix A.
Response:Thank you for this helpful suggestion. We have revised the Appendix A to include a short quantitative description of the inter-sensor correction during the SeaWiFS-MODIS overlap period. Specifically, we now report the monthly regression-based cross-calibration approach and summarize the fitting performance using the R² statistics for Chl-a and PAR across the study areas. The detailed monthly fitting equations and full R² results for each region remain provided in Appendix A. This revision clarifies how systematic differences between SeaWiFS and MODIS were evaluated and corrected before dataset merging.
Specific comment #2: Chl-a, SST, PAR, and SWS datasets have different spatial resolutions. Although this is common in satellite-based studies, a short explanation of how spatial resampling or aggregation was handled would improve methodological transparency.
Response:We thank the reviewer for the insightful comment. We agree that clarifying how spatial and temporal resolutions were harmonized improves methodological transparency. Accordingly, we have added a detailed explanation in the revised manuscript.To address the different spatial resolutions of Chl‑a, SST, PAR, and wind speed (SWS) datasets, we selected a reference MODIS grid (sample.tif, WGS84 projection) covering the entire study area. Using the gdal.Warp function with bilinear resampling, all variables were reprojected and resampled to this common grid, ensuring identical pixel size and spatial extent.Temporally, the original daily data were aggregated into monthly averages for the period 1998–2020.
Specific comment #3: Coastal and estuarine waters often suffer from data gaps due to cloud cover or high turbidity. The authors should briefly describe how missing pixels were handled when calculating regional means and trend statistics.
Response: The boundaries of the study area were first delineated using Natural Earth data. Kriging interpolation was adopted to fill data gaps caused by high-turbidity masking and cloud removal.
Specific comment #4: The four-year moving window approach is reasonable. However, the authors may consider adding a brief sensitivity discussion explaining why a four-year window was selected instead of alternative window lengths, such as three or five years.
Response: To determine the optimal parameter, we tested different moving window sizes of 3, 4 and 5 years for warm season identification. The 3-year window is too short, which tends to capture sea water warming signals unrelated to global warming and produces excessive warming events inconsistent with reality. The 5-year window has an overly long timescale, likely omitting actual warming variations induced by global warming within short periods. Comparative analyses showed that the 4-year moving window yielded the most robust results that match realistic conditions, outperforming both the 3-year and 5-year alternatives. Consequently, the 4-year window was ultimately adopted in this study.
Specific comment #5: The manuscript states that Chl-a and SST time series were normalized before correlation analysis. It would be useful to specify whether standard z-score normalization or another approach was applied.
Response:Thank you for pointing out this ambiguity. We have checked the code and clarified the description in the revised manuscript. No additional z-score normalization was applied before the correlation analysis. Instead, Pearson correlation coefficients were calculated directly from the paired Chl-a and environmental-factor time series after quality control and temporal matching. Because Pearson’s r is inherently standardized by the mean and standard deviation of each variable, the correlation calculation itself accounts for differences in units and magnitudes.
Specific comment #6: Terms such as “Eastern Coastal Waters of the US” and “U.S. East Coast” appear to be used interchangeably. Standardizing terminology throughout the manuscript would enhance clarity.
Response:Thank you for this helpful comment. We have carefully checked the full manuscript and standardized the terminology throughout. In particular, we now consistently use “Eastern Coastal Waters of the US” to refer to this study area, ensuring that the wording is consistent across the text, figures, tables, and appendices.
Specific comment #7: this section by concisely summarizing the main findings and scientific contributions of the study. In addition, explicitly stating the limitations of the current analysis and outlining potential directions for future research would strengthen the conclusions.
Response:We sincerely thank the reviewers for recognizing the robustness of our conclusions and for providing constructive suggestions to improve the manuscript by explicitly stating the limitations of the current analysis and outlining potential directions for future research. In the revised conclusion, we acknowledge that unresolved inter-basin physical-biogeochemical feedbacks (e.g., upwelling, coastal currents, and deoxygenation) limit the mechanistic interpretation of the current trends. We outline future research directions focusing on the Anthropocene marine hotspot concept, emphasizing the need to disentangle the synergistic effects of multiple stressors (climate change, eutrophication, and resource exploitation) on ecosystem dynamics.
These additions have strengthened the conclusion by clearly stating the study's limitations while enhancing its global relevance and scientific depth. We believe the revised manuscript fully addresses your concerns.
Specific comment #8: In Figure 1a, the blue label “East Sea” should be corrected to “East China Sea”.
Response:We thank the reviewer for pointing out the inaccuracy in the geographical label. As suggested, we have corrected the label “East Sea” to “East China Sea” in Figure 1a. Furthermore, we have carefully checked the entire manuscript (including all figures, tables, and the main text) and standardized the expression of all place names to ensure consistency and accuracy.
Citation: https://doi.org/10.5194/egusphere-2025-4558-AC3
-
AC3: 'Reply on CC1', Nan Yao, 25 May 2026
-
RC2: 'Comment on egusphere-2025-4558', Anonymous Referee #2, 10 Mar 2026
The manuscript “Chlorophyll-a Variation Trends in Marginal Seas: Assessing the Impact of Global warming and Anthropogenic Activities Using Time Series Satellite Data (1998-2020)” by Nan Yao and colleagues assesses the impact of sea surface temperature and nutrient concentration in a couple of regional seas and basins on Chlorophyll a concentration timeseries derived from ocean color remote sensing products. The statistical analysis differentiates between enclosed seas and open water regimes, as well as periods of stable or rising temperatures, and as such, tries to disentangle the effects of rising sea surface temperatures among other physical parameters on primary production. The study could benefit from some revisions regarding the sometimes lenghty presentation of results, contrasting the rather short discussion, missing the embedding of the conclusions drawn in the broader scientific frame. I have some suggestions that hopefully the authors can address to improve the manuscript.
The differentiation of open and enclosed seas seems a bit weak because the authors have already stated the influence of ocean currents (and water mass trasnport) in the Gulf of Mexico. However, in the Results and Discussion Sections, the authors first generalize based on the Bohai Sea for statements on the enclosed seas which do not old for the Gulf of Mexico. Maybe the general statements could be somehow toned down?
As in the Discussion Section, the authors still introduce new results, I got a bit lost in the details. I would like to see how the results are discussed along available literature on drivers of Chl-a in the five regions selected in this study. This is partly done in Section 4.2.3 (L. 455-472), the study would benefit from assessing the results/conclusions with literature. Moreover, it would be interesting to broaden the perspective at some point, create a train of thought (like in the Conclusions), and compare, how other regions are shaped (quickly synthesizing other studies).
Quality of plots: I would prefer if you could spell out all abbreviations again (increased readability, also inconsistently done in manuscript) and generally use a larger font size in the labels and annotations.
Appendix A, C, D: Could you integrate these parts in the main manuscript? They are rather short and the Methods Section could profit from including a bit more details about the processing. You could still keep all the resulting equations of Appendix A in an Appendix Table.
Please carefully check grammar and spelling again, I listed some examples below that caught my eye.
Specific comments
Section 1
L. 17: Why do you prefer the term "oceanic color" to "ocean color"?
L. 21: "Specifically, in eutrophic closed seas"
L. 22: apparently/appear to?
L. 23: in the central part of the sea
L. 24 "with distance offshore" please rephrase
L. 33: raising
L. 34: linked
L. 35: exchange of what?
L: 40: I would think the term "biological carbon pump" is more common
L. 51: increasing with distance from shore/from coast?
L. 51: There is a sentence consisting only of citations. What is the message?
L. 64: Maybe you could add the values here?
L. 68-71: I suggest splitting the sentence.
L. 73: including? I suggest re-phrasing and splitting, your point here is really hard to grasp.
L. 76-77: Please rephrase: You argue that global warming induced changes of PAR and SWS might change chl-a, but this is complex to clarify?
L. 81: reference for "The influence of SWS on Chl-a is non-linear and spatially heterogeneous."? Maybe you want to add references to the following statements as well? Is it only Wang and Xiu (2022)?
L. 95: warm water?Section 2
Please reconsider the use of tenses and unify in the whole section. Right now you switch between past and present tense quite randomly.
L. 113: I'd prefer larger font size for the annotations on the world map and for the geographical names in the subsets a-e.
L. 127-129: Please rephrase this sentence and unify tenses, maybe "events which increased"?
L. 138: Add a reference fot the pollutants.
Table 1: Consider horizontal row seperators because the table is hard to read.
L. 165: What are applicable methods? Do you mean you "applied a method"? Maybe you want to shift the processing to the Methods Section 2.3?
l. 170: "The two types of data products have different coverage times" - what are the different types? That's unclear.
L. 203: Please rephrase the reference to Appendix C.
L. 226: Is there a reference for the seasonal cycles or weather events?
L. 243-249: Unlcear how you conducted the PCA, which are the input timeseries and which is the target.
L. 244: Please rephrase. What do you conclude from M+R1993?
Figure 4: It would be much clearer if you could use the same color bar scale for all maps - log10 Chl-a could be considered. Panel f: No difference visible between two red dashed lines (GOM, BS). Please consider using log10 Chl-a and all regions on one y-axis. "monthyl change rate" seems a bit odd here, could you transfer it to the main text?Section 3
L. 253-255: As you have only two closed sea areas, it seems a bit odd to generalize from the Bohai Sea only, as the Gulf of Mexico represents the contrary.
L. 254: "while the Gulf... shows"
L. 259: Consistently higher annual Chl-a concentration? variation?
L. 259: "the other regions"
L. 264: Remove whole line.
L. 272: Please check grammar.
L. 274: "While a slightly increasing tendency"
L. 276: "in the sea area"
L. 279: "continous increase"
L. 279: decline of the chl-a concentration in the East China Sea?
L. 279-280: I don't see where you indicated the "turn point of Bohai Sea" in Figure 5.
Figure 5: Spelling of "red dashed line", first", "a regressive trend line", "four columns to the right". Waht are the colors in the first column representing? Which color - red (blue) - refers to Chl-a (SST)? X-axis ticks missing. COuld you unify the x-axis for all panels? Please consider log10 Chl-a for all panels. Maybe you can specify: it's a linear regression line you added to the timeseries. What about their statistics/sgnificances?
L. 285: What "seasonal Chl-a" do you mean? concentration? It is not clear to me what you are refering to and what is different in the Gulf of Mexico.
L. 288: I don't get what you mean by " the Chl-a in
winter substitute with the summer Chl-a and becomes the second decisive factor".
Table 5: Check capitalization. Add a vertical line to separate open and enclosed sea areas.
L. 296-297: You mean "areas with increasing Chl-a trend"?
Figure 6: A legend is missing - do you use the same boundary norm for all panels?
Caption and panel labels do not match.
Why is the fraction of downward tendency in the Gulf of Mexico so high?
L. 308: " as illustrated in Figure 5d and 6d" - no! pie charts disagree!
L. 313: terrestrial nutrient input
L. 320: What are "significant rivers"?
L. 324-339: Please consider re-writing the two paragraphs and sort by open/enclosed. The first paragraph is quite chaotic, the second provides a bit more structure.
L. 325: What is an "obvious" trend?
L. 329: In which terms are the Chl-a stabilites "significant different"?
L. 330-331: Please rephrase "Chl-a shows lower stability of Chl-a are observed..."
L. 338: "whatever" - probably: "in both open and enclosed seas."?
Figure 7: Panel labels do not match caption.
L. 345: "spatio-temporal", please be consistent in the whole document, also L. 346.Section 4
Section 4.1: This is still presenting results, so shift to Results Section?
Figure 8: I can't distinguish "color-coded data density". Significance levels of panels to not match caption. Please use bigger font size. What do you gain from including this figure in the manuscript compared to a table reporting on the correlation statistics like Table 5?
L. 359: All panels suggest a negative correlation of Chl-a and SST, but not all are significant. I don't get why you highlight the open seas here.
L. 371-383: I suggest to reorder the two paragraphs by regions. Further, it is unlcear to me how you conducted the PCA (see comment to L. 243-249). How did you prepare the data? Did you use spatial or temporal averaging? What avout the two time periods specified in the Methods Section?
L. 380-383: Is there a reference to underline your thoughts?
L. 394: You probably want to say, that your three indices are valuable for predicting Chl-a concentrations? "determining Chl-a concentration" sounds misleading.
L. 395 studied
L. 397: What is "inhibition of Chl-a"?
L. 397 "induced by global warming"
L. 408: "heightened" - increased?
L. 423: The section heading is not really fitting. Here, you report results on SST and refrain from discussing global warming as such.
Figure 9: This is a complex figure, I would like to see it introduced in the Results Section.
Can you explain why the correlation coefficients vary so much in space? I would have assumed that major current patterns would be visible as strucutral element.
In the caption, you specify the years and differentiate between SST rising and stable periods. Did you evaluate more than one period for each panel? Maybe a cross-reference to Table 4/Figure 3 would be nice. There, you only specified one stable/rising period for each region, so I would assume this is also the underlying data here?
Please unify the y-axis in panel group (b), so percentages can be compared more easily.
L. 440-441: Why are open sea ares more affected by SST? The values stated for enclosed seas in L. 447-448 are comparable to the open seas.
L. 455/Section 4.2.3: This section is more about Chl-a timeseries than on anthropogenic nutrient inputs. Could you enrich the section with a discussion on nutrients and their impact on Chl-a, citing relevant literature?
L. 461: "In spring, there is"?
L. 470: "In autumn, there is"?
L. 475-476: reference?
L. 481: "since 4" - something is missing here.
L. 481: "a decreasing rate of Chl-a conc increase", probably easier to rephrase: "a slowdown of Chl-a increase"?
L. 481-484: references?L 548: "fluvial" only appears here, I suggested "terrestrial" (L. 313, but also elsewhere)
L. 560: Github repository: could you provide a commit ID to track which version you used? Some of the comments in the code is in Chinese, it would be great to translate it to English. It would be nice to have a bit more information in the Readme document on github.
L. 753: This is already Appendix A.
L. 838: Which validation steps explictly?
Appendix E: Check capitalization. Could you add the significance levels of the trends?
Appendix F: Check capitalizationTechnical comments
Please unify in whole document:
Tab. or Table? Fig. or Figure?
Check general use of comma, use of Oxford comma
Text alignment within tables (left?)
Consistent use of articles when refering to, e.g., "the Bohai Sea" (L. 278)
Please consider the use of "temporal variation rate" and "trend" (e.g., Figure 6). I suggest to stick to one term and use it throughout the mansucript. Switching back and forth leads to irritations on my side. In the text you even use "annual growth rate" additionally (e.g., L. 300).
Same for "increase"/"upward tendency"/"growth" - the wild mix of these terms confuses me when comparing the text to figures (e.g. L. 308-310 and caption Figure 6).
Tables: Capitalization of first word in each grid cellL. 41: add space after "carbon sink" before citation, also L. 45, 49, 53, 75, 80, 86, 127, 196, 239, 244, 337, 477
L. 60: please re-order citations
L. 66: two dots in "e..g."
L. 71: anthropogenically enhanced processes
L. 78: use em-dash
L. 96: describe (plural), or "the D&M section describes", also for introduction of Results, Discussion, and Conclusions sections
L. 105: five (as in the rest of the manuscript)
L. 133: Please unify in the manuscript: HABs events or HAB events?
L. 140: acts
L. 153: Consider use of Oxford comma, reorder citations for consistency
L. 158: Please unify in whole document: Tab. or Table?
Table 2: Please add date of last access of websites, consider using horizontal lines to separate rows
L. 176: "to the availability"
Figure 2: Please unify capitalization.
Table 3: "Significantly"
L. 214: "in five different locations"
L. 257: sea area
L. 371: Split sentences correctly.
L. 404: steadily
L. 405: However
L. 418: currents are
L. 424: Pearson
L. 487: surplus ")"
L. 562: Missing space after link. Please add last access to links.
L. 750: Overlapping
L. 829: dailyCitation: https://doi.org/10.5194/egusphere-2025-4558-RC2 -
AC2: 'Reply on RC2', Nan Yao, 25 May 2026
Replies to reviewer(s) comments
Dear Editor and Reviewers,
This is the response of the comments on the manuscript “Chlorophyll-a Variation Trends in Marginal Seas: Assessing the Impact of Global Heating and Anthropogenic Activities Using Time Series Satellite Data (1998-2020)” (with ID MARGO-D-23-00381). We concur with your careful review and precise comments, and appreciate your constructive suggestions very much for improving the manuscript.
In this revised manuscript, we substantially improved the logic of the manuscript genreally to make the presentation more clear. Moreover, we seek help from professional language editing to improve the quality and meet the journal’s required standard.
For your convenience, all the changes of the manuscript and relevant discussions have been highlighted in yellow color in the revised manuscript.
Sincerely yours,
Xiaoyu ZHANG and co-authors
---------------------------------------------------------------------------------------------------------------------------------
Reponses to Reviewer's Responses to Questions
Please see the item-by-item responses given as follows:
Anonymous Referee #2, 10 Mar 2026
General Comments
The manuscript “Chlorophyll-a Variation Trends in Marginal Seas: Assessing the Impact of Global warming and Anthropogenic Activities Using Time Series Satellite Data (1998-2020)” by Nan Yao and colleagues assesses the impact of sea surface temperature and nutrient concentration in a couple of regional seas and basins on Chlorophyll a concentration timeseries derived from ocean color remote sensing products. The statistical analysis differentiates between enclosed seas and open water regimes, as well as periods of stable or rising temperatures, and as such, tries to disentangle the effects of rising sea surface temperatures among other physical parameters on primary production. The study could benefit from some revisions regarding the sometimes lenghty presentation of results, contrasting the rather short discussion, missing the embedding of the conclusions drawn in the broader scientific frame. I have some suggestions that hopefully the authors can address to improve the manuscript.
Response:We sincerely thank the reviewer for the encouraging comments and the thoughtful critique of our manuscript. We are pleased that you recognize the value of our comparative analysis across regional seas and our effort to disentangle the effects of SST and anthropogenic drivers on Chl-a dynamics.
Following your suggestions, we have substantially revised the manuscript in the following two aspects:
(1) Results Section: We have streamlined the presentation of results, reducing the overall length by approximately 15%. the text has been refined for conciseness and clarity. The specific locations of these refinements are highlighted in blue in the revised manuscript for easy reference.
(2) Conclusions: We have expanded the conclusion to embed our findings within broader global scientific frameworks, including the Global Carbon Project (GCP), GO₂NE (Global Ocean Oxygen Network), and Marine Ecosystem Regime Shift Theory. We also explicitly discuss the implications for SDG 14 and the UN Ocean Decade, linking regional findings to global climate and sustainability challenges.
We believe these revisions have significantly strengthened the manuscript. We hope the revised version meets your expectations.
Major Comments
Major Comment 1: The differentiation of open and enclosed seas seems a bit weak because the authors have already stated the influence of ocean currents (and water mass trasnport) in the Gulf of Mexico. However, in the Results and Discussion Sections, the authors first generalize based on the Bohai Sea for statements on the enclosed seas which do not old for the Gulf of Mexico. Maybe the general statements could be somehow toned down?
Response: We agree with the reviewer that generalizing all enclosed seas based solely on the Bohai Sea is inaccurate, given the strong hydrodynamic activity in the Gulf of Mexico. Following this comment, we have carefully revised the manuscript to tone down these generalizations.
In the revised version, we now explicitly distinguish between "enclosed seas with restricted water exchange" (referring specifically to the Bohai Sea) and "enclosed seas with strong water exchange" (referring to the Gulf of Mexico). We have replaced broad terms like "enclosed seas" with these more precise descriptions throughout the Results and Discussion sections to ensure the text accurately reflects the distinct physical controls on Chl-a dynamics in these two regions.
Major Comment 2: As in the Discussion Section, the authors still introduce new results, I got a bit lost in the details. I would like to see how the results are discussed along available literature on drivers of Chl-a in the five regions selected in this study. This is partly done in Section 4.2.3 (L. 455-472), the study would benefit from assessing the results/conclusions with literature. Moreover, it would be interesting to broaden the perspective at some point, create a train of thought (like in the Conclusions), and compare, how other regions are shaped (quickly synthesizing other studies).
Response: We thank the reviewer for this constructive critique. We have substantially revised Section 4.2 as follows:
(1)Sections 4.2.1 and 4.2.2 have been rewritten to remove redundant numerical result descriptions and now include explicit comparisons with previous studies on SST–Chl-a decoupling by river plumes (e.g., Gomes et al., 2018; Foltz et al., 2009), stratification–productivity relationships on the ECS and U.S. East Coast shelves (Behrenfeld et al., 2006; Liu et al., 2010; Kako et al., 2016), and wind–upwelling linkages (Hu & Wang, 2016; Walsh et al., 2005).
(2)Section 4.2.3 now opens with a synthesis paragraph linking physical and anthropogenic drivers, and closes with a cross-regional comparison based on our five-study-site findings within global syntheses of coastal Chl-a drivers (Cloern et al., 2016; Glibert et al., 2014; Nixon, 1995; Seitzinger et al., 2010).
The discussion now emphasis mechanistic interpretation rather than reiterating figure statistics, and highlights sub-regional heterogeneity as indicated.
Major Comment 3: Quality of plots: I would prefer if you could spell out all abbreviations again (increased readability, also inconsistently done in manuscript) and generally use a larger font size in the labels and annotations.
Response: Thank you for the suggestion. We have retained the full names of the different sea areas and ensured that they correspond consistently with the terminology used in the main text. In addition, while maintaining the overall clarity and neatness of the figures, we increased the font size of all legends and annotations to improve readability.
Major Comment 4: Appendix A, C, D: Could you integrate these parts in the main manuscript? They are rather short and the Methods Section could profit from including a bit more details about the processing. You could still keep all the resulting equations of Appendix A in an Appendix Table.
Response: Thank you for your valuable suggestion. After careful consideration, we prefer to keep Appendix A, C and D as they are. These contents involve specialized computational formulas and auxiliary processing details, which would disrupt the logical coherence of the main Methods section if incorporated. We retain relevant equations in the appendix table for easy reference, and the current layout ensures neat and reasonable manuscript structure.
Major Comment 5: Please carefully check grammar and spelling again, I listed some examples below that caught my eye.
Response: We have carefully checked the full text for grammar and spelling errors and revised them accordingly, hoping the manuscript now meets publication requirements.
Specific comments
Section 1
- 17: Why do you prefer the term"oceanic color" to "ocean color"?
Response: have replaced “ocean color” to “oceanic color” in Line 17, in addition, we checked through the whole paper to avoid the same mistakes.
- 21: "Specifically, in eutrophic closed seas"
Response: has revised as “Specifically, in eutrophic closed seas with weak hydrodynamic exchange capacity, such as the Bohai Sea, increasing SST did not apparently suppress Chl-a concentration; instead, a continuous increase in Chl-a was observed in the center of the sea.”
- 22: apparently/appear to?
Response:“apparent” has replaced with “apparently”.
- 23: in the central part of the sea
Response:has revised as “in the center of the sea”.
- 24"with distance offshore" please rephrase
Response:has revised as “with increasing distance offshore”.
- 33: raising
Response:has revised.
- 34: linked
Response:has revised.
- 35: exchange of what?
Response:has revise as “hydrodynamic exchange”.
L: 40: I would think the term "biological carbon pump" is more common
Response:has replaced with term "biological carbon pump".
- 51: increasing with distance from shore/from coast?
Response:has revised as “increasing with distance from coast”.
- 51: There is a sentence consisting only of citations. What is the message?
Response: has deleted unnecessary citations.
- 64: Maybe you could add the values here?
Response: SST warming was accompanied by a decreasing trend in Chla, though no quantitative correlation coefficient was provided.
- 68-71: I suggest splitting the sentence.
Response:has splitting the sentence as following: “For example, in the Baltic Sea, an increase in cultural eutrophication since the 1950s has produced marked sedimentary changes in a range of organic geochemical indicators. These indicators, including those reflecting increased phytoplankton biomass, have been suggested as important secondary markers for the proposed Anthropocene epoch at this candidate Global Boundary Stratotype Section and Point (GSSP) site”.
- 73: including? I suggest re-phrasing and splitting,your point here is really hard to grasp.
Response:has re-phrased and split as follwong: “Other anthropogenically enhanced processes have also profoundly altered the correlation between Chl-a and SST. These include predation pressure—particularly in aquaculture areas, where filter-feeding organisms reduce phytoplankton biomass (e.g., Frau et al., 2021; Mao et al., 2020), and commercial fishing, which indirectly affects phytoplankton biomass by altering zooplankton and fish abundance (Campos-Silva et al., 2021; Reid et al., 2000).”
- 76-77: Please rephrase: You argue that global warming induced changes of PAR and SWS might change chl-a, but this is complex to clarify?
Response:In addition, the complex responses of photosynthetically active radiation (PAR) and surface wind speed (SWS) to global warming exert additional controls on upper-layer Chl-a, making it difficult to clarify the sole impact of warming independent of these concurrent physical changes.已经修改。
- 81: reference for "The influence of SWS on Chl-a is non-linear and spatially heterogeneous."? Maybe you want to add references to the following statements as well? Is it only Wang and Xiu (2022)?
Response:has added a new reference: X Wei, H Zhao, Spatiotemporal distribution of chlorophyll-a concentration in the south China sea and its possible environmental regulation mechanisms, Marine Environmental Research, 2025
- 95: warm water?
Response: has revised as “warm water”.
Section 2
Please reconsider the use of tenses and unify in the whole section. Right now you switch between past and present tense quite randomly.
Response: has revised the tense and unified, please see the text with bright yellow.
- 113: I'd prefer larger font size for the annotations on the world map and for the geographical names in the subsets a-e.
Response: Thank you for your valuable suggestion. We attempted to adjust the font size of geographical labels. Given the large number of place names and lengthy text, enlarging the font would cause severe overcrowding across the sea areas. Accordingly, we retain the original font size, and the figure still maintains good clarity for reading.
- 127-129: Please rephrase this sentence and unify tenses, maybe "events which increased"?
Response: has revised as suggested.
- 138: Add a reference fot the pollutants.
Response: has added references as suggested.
Table 1: Consider horizontal row seperators because the table is hard to read.
Response:We have readjusted the table width for better visual presentation. No additional horizontal lines are added to maintain consistent three-line table formatting throughout the paper.
- 165: What are applicable methods? Do you mean you "applied a method"? Maybe you want to shift the processing to the Methods Section 2.3?
Response:yes, has revised as “We applied a consistent preprocessing method (see Section 2.3) to establish a unified satellite dataset from multiple satellites. “
- 170: "The two types of data products have different coverage times" - what are the different types? That's unclear.
Response:has revised as “The two satellite sensors (SeaWiFS and MODIS) have different operational periods”.
- 203: Please rephrase the reference to Appendix C.
Response:The relevant calculation formulas are provided in Appendix C.
- 226: Is there a reference for the seasonal cycles or weather events?
Response: the reference for the weather events extracted in this paper was indicated in the following text from L238-L240 above table 4. “The main SST rising periods of GM, ECS, and ECW tally with the time windows of the most intense El Niño event recorded (2014-2016), whereas distinct rises in SST for AE and BS are coincident with the occurrence of the El Niño windows of 2002-2003 and 2009-2010, respectively (Cai et al., 2021).”, and the record by NOAA in “websitehttps://www.cpc.ncep.noaa.gov/products/analysis_monitoring/ensostuff/ONI_v5.php”.
- 243-249: Unlcear how you conducted the PCA, which are the input timeseries and which is the target.
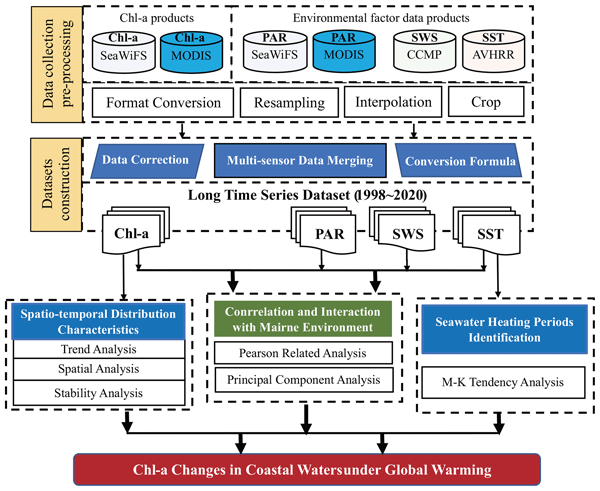
Response: Thank you for your comment. Pearson correlation analysis and principal component analysis (PCA) serve as two independent analytical methods based on the same dataset. Pearson correlation is employed to fit time-series data and explore linear correlations between environmental factors and chlorophyll-a concentration. With all observational time series adopted as input variables, PCA is applied to extract primary driving factors of chlorophyll-a variation.
- 244: Please rephrase. What do you conclude from M+R1993?
Response:we moved the citation to the end of the sentence.
Figure 4: It would be much clearer if you could use the same color bar scale for all maps - log10 Chl-a could be considered. Panel f: No difference visible between two red dashed lines (GOM, BS). Please consider using log10 Chl-a and all regions on one y-axis. "monthyl change rate" seems a bit odd here, could you transfer it to the main text?
Response: We attempted to adopt a unified color scale and logarithmic scale, yet the visual presentation was unsatisfactory. Accordingly, we retain the original color scale and vertical axis units. Meanwhile, dark red curve of GOM has been adjusted to rose red for better visual distinction.
Section 3
- 253-255: As you have only two closed sea areas, it seems a bit odd to generalize from the Bohai Sea only, as the Gulf of Mexico represents the contrary.
Response:Thank you for your valuable comment. We fully agree with your view and have revised the relevant content accordingly. We no longer simply classify them as enclosed seas. Instead, we define the Bohai Sea as an enclosed sea with weak hydrodynamic exchange, while the Gulf of Mexico is described as an enclosed sea with strong hydrodynamic exchange to distinguish their discrepancies.
- 254: "while the Gulf... shows"
Response:has revised.
- 259: Consistently higher annual Chl-a concentration? variation?
Response:has revised as “Meanwhile the East China Sea, which is an open sea in highly eutrophic state, exhibits a consistently higher annual Chl-a, with spring values frequently exceeding 0.6 mg/m3. The other three regions all have year-round Chl-a below 0.6 mg/m3. “
- 259: "the other regions"
Response:has revised.
- 264: Remove whole line.
Response:has removed“This is in stark contrast to the Bohai Sea and the Gulf of Mexico, where the change rates of monthly variation are 18.97% and 16.32% respectively, neither exceeding the 20%.”
- 272: Please check grammar.
Response:has revised as “The Mann-Kendall trend test reveals distinct temporal trends in Chl-a concentrations across the five study regions (Fig. 5).”
- 274: "While a slightly increasing tendency"
Response:has revised
- 276: "in the sea area"
Response:failed to locate.
- 279: "continous increase"
Response:we spell ss continuous
- 279: decline of the chl-a concentration in the East China Sea?
Response: Yes, the East China Sea exhibits a non-significant declining trend after 2017.
- 279-280: I don't see where you indicated the "turn point of Bohai Sea" in Figure 5.
Response:We observe a noticeable declining trend of Chl-a concentration in the Bohai Sea starting from 2014, which is consistent with findings in existing studies.
Figure 5: Spelling of "red dashed line", first", "a regressive trend line", "four columns to the right". Waht are the colors in the first column representing? Which color - red (blue) - refers to Chl-a (SST)? X-axis ticks missing. COuld you unify the x-axis for all panels? Please consider log10 Chl-a for all panels. Maybe you can specify: it's a linear regression line you added to the timeseries. What about their statistics/sgnificances?
Response:We have revised the figure panels into subplots consisting of bar graphs and line graphs, while retaining the original linear scale of Chl-a on the vertical axis.
The horizontal axis is only unified for the line graphs, as further expanding the figure width is not feasible. In addition, we have added horizontal ticks on the x-axis for improved readability.
- 285: What "seasonal Chl-a" do you mean? concentration? It is not clear to me what you are refering to and what is different in the Gulf of Mexico.
Response:has revised as “The seasonal mean Chl-a concentrations do not always follow the same temporal trend as the annual mean. However, in the Gulf of Mexico, all four seasonal means show consistent increasing trends that align with the annual mean trend (Fig. 5).”
- 288: I don't get what you mean by " the Chl-a in winter substitute with the summer Chl-a and becomes the second decisive factor".
Response:has revised as “winter and spring Chl-a concentrations are strongly correlated with the annual mean and thus serve as the primary drivers of the annual trend. The Amazon Estuary represents an exception, where summer and winter Chl-a are more important in determine the annual trend.”
Table 5: Check capitalization. Add a vertical line to separate open and enclosed sea areas.
Response:has revised.
- 296-297: You mean "areas with increasing Chl-a trend"?
Response:yes, has revised.
Figure 6: A legend is missing - do you use the same boundary norm for all panels?
Response:A unified normalized color scale has been added, and consistent boundaries are applied to all subplots across different sea areas
Caption and panel labels do not match.
Response:the caption has been corrected as “Temporal variation trend of seasonal and annual Chl-a in each pixel in the five locations.”
Why is the fraction of downward tendency in the Gulf of Mexico so high?
Response:Compared with other sea areas, the area showing a declining trend in the Gulf of Mexico is relatively limited.
- 308: " as illustrated in Figure 5d and 6d" - no! pie charts disagree!
Response: The pie chart has been redrawn based on the data in Appendix E. The text content is now consistent with the figures.
- 313: terrestrial nutrient input
Response:has revised.
- 320: What are "significant rivers"?
Response:it could be major rivers ,now we have deleted the sentence to be concise.
- 324-339:Please consider re-writing the two paragraphs and sort by open/enclosed. The first paragraph is quite chaotic, the second provides a bit more structure.
Response:The revision has been completed. We separately discuss enclosed seas and open seas, making the content concise and logically organized.
- 325: What is an "obvious" trend?
Response:The so-called obvious trend refers to substantial variations in pixel values. In principle, larger fluctuations of pixel values correspond to lower stability. Besides, sustained increasing or decreasing trends also result in low stability.
- 329:In which terms are theChl-a stabilites "significant different"?
Response:We have revised and refined the corresponding section thoroughly, and removed the inappropriate expression of "significant different".
- 330-331: Please rephrase "Chl-a shows lower stability of Chl-a are observed..."
Response:has revised as “Lower stability of Chl-a is observed in areas.”
- 338: "whatever" - probably: "in both open and enclosed seas."?
Response:has revised.
Figure 7: Panel labels do not match caption.
Response:We have revised the figure labels and captions, which are now consistent with each other.
- 345: "spatio-temporal", please be consistent in the whole document, also L. 346.
Response:has revised.
Section 4
Section 4.1: This is still presenting results, so shift to Results Section?
Response: After careful consideration, we decide to retain Section 4.1 in its current position. This section analyzes correlations among environmental factors across different sea areas and their effects on chlorophyll-a based on Pearson correlation and PCA analysis, which cannot be separately placed in the Results section. We greatly appreciate your valuable suggestion.
Figure 8: I can't distinguish "color-coded data density". Significance levels of panels to not match caption. Please use bigger font size. What do you gain from including this figure in the manuscript compared to a table reporting on the correlation statistics like Table 5?
- 359: All panels suggest a negative correlation of Chl-a and SST, but not all are significant. I don't get why you highlight the open seas here.
Response:We notice that two out of the three open sea areas, the East China Sea and the eastern coastal waters of the United States, show significant negative correlations between Chl-a concentration and SST. By contrast, only weak correlations are observed in the Amazon Estuary, Bohai Bay and the Gulf of Mexico. We consider open sea environment as a key factor modulating such correlation. Warm seawater in open seas generally exerts an inhibitory effect on Chl-a. Although the Amazon Estuary also belongs to open sea waters, it is strongly influenced by other confounding factors, weakening the response of Chl-a to SST variation. Despite the overall weak negative trend across regions, the underlying driving mechanisms differ substantially.
- 371-383: I suggest to reorder the two paragraphs by regions. Further, it is unlcear to me how you conducted the PCA (see comment to L. 243-249). How did you prepare the data? Did you use spatial or temporal averaging? What avout the two time periods specified in the Methods Section?
Response:Thank you for the suggestion. We have revised the PCA description to clarify the data preparation procedure. For each study region, monthly raster data of Chl-a, PAR, SST, and surface wind speed were first spatially averaged over all valid pixels within the region, producing one regional monthly mean value for each variable. The resulting monthly time series were then normalized using min-max normalization before PCA. PCA was therefore conducted using region-level monthly environmental factor series rather than pixel-level data. The two temperature-change periods defined in the Methods were used for the SST-Chl-a correlation analysis, whereas PCA was performed using the full monthly time series for each region.
- 380-383: Is there a reference to underline your thoughts?
Response:has added a references, please see in the text.
- 394: You probably want to say, that your three indices are valuable for predicting Chl-a concentrations? "determining Chl-a concentration" sounds misleading.
Response:we finally use “regulating”.
- 395 studied
Response:has revised as “studied area”.
- 397: What is "inhibition of Chl-a"?
Response:has revised as “suppressive effect”
- 397 "induced by global warming"
Response:has revised as “in the context of global warming”
- 408: "heightened" - increased?
Response:has revised as “greater sensitivity”
- 423: The section heading is not really fitting. Here, you report results on SST and refrain from discussing global warming as such.
Response:We appreciate your valuable comment on the section title. This subsection not only discusses the relationship between global warming-induced sea surface temperature rise and Chl-a variation, but also elaborates considerable regional thermal changes driven by seasonal fluctuation and upwelling effects other than global warming. Accordingly, we revised the section title to better cover the Chl-a responses under global wariming with diverse temperature driving factors and subsequent.
Figure 9: This is a complex figure, I would like to see it introduced in the Results Section.
Response:We highly appreciate your insightful comment on the placement of Figure 9. After repeated discussions among all authors, we ultimately decide to retain this figure and its relevant discussion in the Discussion section. Figure 9 clearly illustrates the variations in Chl-a-SST correlations during diverse water mass interaction processes across different sea areas. It provides critical evidence for distinguishing SST changes driven by different mechanisms and evaluating the corresponding ecological responses of chlorophyll-a. Therefore, we consider it appropriate to discuss these correlation characteristics and their implications for sea warming effects on Chl-a in the Discussion section
Can you explain why the correlation coefficients vary so much in space? I would have assumed that major current patterns would be visible as strucutral element.
Response:We fully agree with your valuable opinion. This is exactly why we place this figure in the Discussion section for in-depth analysis.
In the caption, you specify the years and differentiate between SST rising and stable periods. Did you evaluate more than one period for each panel? Maybe a cross-reference to Table 4/Figure 3 would be nice. There, you only specified one stable/rising period for each region, so I would assume this is also the underlying data here?
Response:We greatly agree with your comment. Multiple warming and stable periods indeed exist in each study region. Table 4 and Figure 3 present the most prominent warming and stable phases, the most prominent warming periods correspond to strong El Niño events records. Accordingly, the correlation analysis in Figure 9 is conducted strictly based on these identified periods for respective sea areas.
Please unify the y-axis in panel group (b), so percentages can be compared more easily.
Response:This bar chart mainly compares the correlation between Chl-a and SST during warming and stable periods. Different y-axis ranges were adopted for various sea areas to achieve clearer comparison results.
- 440-441: Why are open sea ares more affected by SST? The values stated for enclosed seas in L. 447-448 are comparable to the open seas.
Response:We consider that correlation coefficients only reflect the correlation degree between Chl-a and SST, rather than the magnitude of SST impact on Chl-a variation. Open sea waters feature low Chl-a concentration and oligotrophic conditions, where sea surface warming exerts a more pronounced influence on phytoplankton growth. In eutrophic enclosed seas, SST still shows notable correlation with Chl-a below the critical threshold, yet such temperature fluctuation may not trigger drastic changes in chlorophyll-a content.
- 455/Section 4.2.3: This section is more about Chl-a timeseries than on anthropogenic nutrient inputs. Could you enrich the section with a discussion on nutrients and their impact on Chl-a, citing relevant literature?
Response:Thank you very much for your valuable suggestion. Relevant literature concerning nutrients and their effects on Chl-a has been supplemented in this section.
- 461: "In spring, there is"?
Response:has revised.
- 470: "In autumn, there is"?
Response:has revised.
- 475-476: reference?
Response:has added as suggested, please see in the text.
- 481: "since 4" - something is missing here.
Response:Thank you for pointing out this omission. This was an oversight in the original text, and we have checked and corrected the incomplete phrase to “since 2014” in the revised manuscript.
- 481: "a decreasing rate of Chl-a conc increase", probably easier to rephrase: "a slowdown of Chl-a increase"?
Response:has corrected as suggested.
- 481-484: references?
Response: has added references as suggested, please see in the text.
L 548: "fluvial" only appears here, I suggested "terrestrial" (L. 313, but also elsewhere)
Response:has revised.
- 560: Github repository: could you provide a commit ID to track which version you used? Some of the comments in the code is in Chinese, it would be great to translate it to English. It would be nice to have a bit more information in the Readme document on github.
Response:We thank the reviewer for this helpful suggestion. We have updated the GitHub repository as follows,Commit ID: The exact code version used for the manuscript analyses is documented in the README under Repository Version (Commit ID). The commit hash is f7151f0e93458e0038aacb0a56c4537a4071f94d. Users can reproduce the analysis by checking out this commit after cloning the repository.All inline comments and function docstrings that were previously written in Chinese have been translated into English across all processing and plotting scripts.The README has been substantially expanded to include a study overview, study regions, data sources, workflow description, script descriptions, expected directory structure, software requirements, quick-start instructions, and output descriptions to improve reproducibility and usability of the repository.
- 753: This is already Appendix A.
Response:We have revised the wording to eliminate inaccuracies.
- 838:Which validation steps explictly?
Response:Thank you for pointing this out. We have revised this section to avoid implying additional validation procedures that were not explicitly applied. The original statement about “additional validation steps” has been removed, and Appendix B now describes the implemented procedure more accurately: outliers were identified using the mean ± three standard deviations criterion and excluded once from each pixel-level time series before calculating the trend and coefficient of variation.
Appendix E: Check capitalization. Could you add the significance levels of the trends?
Response:Thanks for pointing out the capitalization issues in Appendix E, which we have revised accordingly. Appendix E presents the proportion of pixels showing rising and falling trends across the study area throughout the research period. Confidence levels are only calculable for individual pixel trends. An overall confidence level for the entire region cannot be determined, given the large number of independent pixels that cannot be simply aggregated.
Appendix F: Check capitalization
Response:has checked and revised.
Technical comments
Please unify in whole document: Tab. or Table? Fig. or Figure?
Response:has revised.
Check general use of comma, use of Oxford comma
Response:has revised.
Text alignment within tables (left?)
Response:has revised.
Consistent use of articles when refering to, e.g., "the Bohai Sea" (L. 278)
Response:has revised.
Please consider the use of "temporal variation rate" and "trend" (e.g., Figure 6). I suggest to stick to one term and use it throughout the mansucript. Switching back and forth leads to irritations on my side. In the text you even use "annual growth rate" additionally (e.g., L. 300).
Response:Revisions have been made as suggested. The term "annual growth rate" has been removed, while only "spatio-temporal variation rates" is retained once in Section 3.3. The word "trend" is adopted elsewhere.
Same for "increase"/"upward tendency"/"growth" - the wild mix of these terms confuses me when comparing the text to figures (e.g. L. 308-310 and caption Figure 6).
Response:We have standardized the descriptive terms including increase, upward tendency and growth throughout the manuscript to avoid confusion. The corresponding sentence has been revised with unified wording, and Figure 6 particularly the pie charts have been redrawn according to the appended data.
Tables: Capitalization of first word in each grid cell
Response:has revised.
- 41: add space after "carbon sink" before citation, also L. 45, 49, 53, 75, 80, 86, 127, 196, 239, 244, 337, 477
Response:has revised.
- 60: please re-order citations
Response:A thorough check has been conducted on all in-text citations, which have been sorted alphabetically by authors' surnames.
- 66: two dots in "e..g."
Response:has revised.
- 71: anthropogenically enhanced processes
Response:has revised.
- 78: use em-dash
Response:has revised.
- 96: describe (plural), or "the D&M section describes", also for introduction of Results, Discussion, and Conclusions sections
Response:has revised.
- 105: five (as in the rest of the manuscript)
Response:has revised.
- 133: Please unify in the manuscript: HABs events or HAB events?
Response:has revised as HABs and HAB events, 'HABs' denotes harmful algal blooms (the phenomenon), whereas 'HAB events' refers to specific instances or outbreaks of harmful algal blooms.
- 140: acts
Response:has revised.
- 153: Consider use of Oxford comma, reorder citations for consistency
Response:References cited in the text have been rearranged in alphabetical order as suggested by reviewers.
- 158: Please unify in whole document: Tab. or Table?
Response:has revised for consistency.
Table 2: Please add date of last access of websites, consider using horizontal lines to separate rows
Response:Thank you for the suggestion. We have added a “Last accessed date” column to the data source table and provided the access date for each dataset and source link.
- 176: "to the availability"
Response:has revised.
Figure 2: Please unify capitalization.
Response:Thank you for pointing this out. We have revised Figure 2 to standardize the capitalization style across all labels. The inconsistent mixture of title case and sentence case has been corrected to ensure uniform formatting throughout the figure.
Table 3: "Significantly"
Response:has revised.
- 214: "in five different locations"
Response:has revised.
- 257: sea area
Response:has revised.
- 371: Split sentences correctly.
Response:has revised.: “To clarify the key factors influencing Chl-a concentration, PCA was conducted in this study. As shown in Table 6, SST has its largest loading (≥0.22) on the first principal component across all five sea areas.”
- 404: steadily
Response:has revised.
- 405: However
Response:has revised.
- 418: currents are
Response:has revised.
- 424: Pearson
Response:has revised.
- 487: surplus ")"
Response:This is not a surplus parenthesis. One refers to Fig. 6, and the other completes the bracket pair opened earlier in the sentence.
- 562: Missing space after link. Please add last access to links.
Response:Response:We have added the missing space after link in the revised manuscript.
- 750: Overlapping
Response: “the overlapped” has been revised to “overlapping”. Additionally, two other optimizations were made to the original sentence: the redundant word 'data' has been removed (changing “Chl-a data from MODIS and SeaWiFS data” to “Chl-a data from MODIS and SeaWiFS”), and the unnecessary space before “with” has been deleted. These corrections have been implemented in the revised manuscript."
- 829: daily
Response:has revised “Daily” to “daily”.
Citation: https://doi.org/10.5194/egusphere-2025-4558-AC2
-
AC2: 'Reply on RC2', Nan Yao, 25 May 2026
Peer review completion


Post-review adjustments


Interactive discussion
Status: closed
-
RC1: 'Comment on egusphere-2025-4558', Mian Liu, 19 Nov 2025
General Comments
This manuscript presents a comprehensive analysis of chlorophyll-a (Chl-a) trends in five marginal seas with varying hydrodynamic and anthropogenic characteristics, using satellite-derived data from 1998 to 2020. The study addresses a timely and important topic—the interplay between global warming and human activities in shaping coastal phytoplankton dynamics. The methodology is robust, combining trend analysis, stability assessment, and correlation/PCA to disentangle the effects of SST, PAR, and SWS on Chl-a. The findings highlight the contrasting responses of enclosed vs. open seas to warming, which is a valuable contribution to the field. The manuscript is generally well-structured and clearly written, though some sections could benefit from greater clarity and methodological detail.
Major Comments
1. Data Integration and Harmonization:
The use of multiple satellite sensors (SeaWiFS and MODIS) is appropriate for long-term trend analysis. However, the methodology for merging and harmonizing these datasets (Appendix A) is not sufficiently detailed in the main text. The authors should clarify how they addressed potential biases between sensors, especially for Chl-a and PAR, and justify the selection of specific months for correction.
2. SST Period Identification:
The identification of SST warming and stable periods using a 4-year moving window is innovative. However, the rationale for choosing this window length and its suitability for capturing climate-scale signals versus interannual variability (e.g., ENSO) should be more thoroughly explained.
3. Interpretation of Correlation vs. Causation:
While the study identifies correlations between Chl-a and environmental factors, the discussion often implies causation. The authors should more carefully distinguish between correlation and causation, especially when attributing Chl-a changes to global warming versus anthropogenic nutrient inputs.
4. Spatial Heterogeneity and Scale:
The study covers large and diverse regions, but some conclusions (e.g., about “open” vs. “enclosed” seas) may oversimplify intra-regional variability. More nuanced discussion of sub-regional processes (e.g., upwelling, river plumes) would strengthen the interpretation.
5. Anthropogenic Proxy:
Population density is used as a proxy for anthropogenic pressure, which is reasonable but indirect. The authors should acknowledge the limitations of this approach and consider discussing other potential indicators (e.g., fertilizer use, wastewater discharge) where data are available.
Specific Comments
1. Abstract:
The abstract clearly summarizes the main findings but could better highlight the novel aspects of the study, such as the contrasting responses of enclosed vs. open seas to SST rise.
2. Introduction:
Lines 65–70: The discussion of upwelling and its role in Chl-a dynamics is well-placed, but the transition to anthropogenic effects seems a bit abrupt and could be smoother.
3. Methods:
Section 2.2: Please specify how the missing data were handled, especially in coastal areas with high turbidity or cloud cover.
Section 2.3.1: The M-K trend test is appropriately applied, but the justification for using both M-K and least squares trend analysis should be briefly explained.
Results:
Figure 4: The spatial patterns are informative, but the color scales for Chl-a are not always intuitive. Consider using a consistent scale across panels for easier comparison.
Figure 9: The correlation maps are useful, but the classification of correlation strength (e.g., “high negative”) should be clearly defined in the caption or legend.
Discussion:
Lines 420–430: The interpretation of PAR in the Amazon Estuary is insightful, but the mechanism behind the weak SST-Chl-a relationship could be elaborated (e.g., barrier layer effects).
Lines 530–540: The conclusion that Chl-a in the Bohai Sea is less impacted by warming due to high nutrient levels is compelling but should be tempered with the acknowledgment of potential lag effects or nonlinear responses.
Conclusions:
The conclusions are well-supported but could be more forward-looking. For example, what are the implications for coastal management under future warming scenarios?
References:
The reference list is comprehensive and up-to-date, though a few recent key studies on marginal sea Chl-a trends (e.g., from the past 2–3 years) could be included.
Format adjustments:
Line 51: The references cited are divided into two parentheses. Please correct.
Line 75: a missing space between the end of the sentence and the cited references
Line 80: Similarly, see line 75
Line 86: Similarly, see line 75
Line 145: It is recommended that the complete form be placed on one page, and the title of the tableshould be placed in the center. (Similar situations will not be listed one by one)
Line 161: The title of the table should come before the table, also the complete form should be placed on one page.
Line 210: The title of the tableshould be placed in the center. (The following tables all have similar situations and will not list them one by one.)
There might be format errors that the reviewer have or omitted or not yet discovered. Please check carefully
Overall Recommendation:
This manuscript presents a valuable and well-executed study that advances our understanding of Chl-a dynamics in marginal seas under dual pressures of climate change and human activity. With minor to moderate revisions—particularly in methodological transparency and causal interpretation—it will be suitable and worthy for publication on Ocean Science.Citation: https://doi.org/10.5194/egusphere-2025-4558-RC1 -
AC1: 'Reply on RC1', Nan Yao, 25 May 2026
Replies to reviewer(s) comments
Dear Editor and Reviewers,
This is the response of the comments on the manuscript “Chlorophyll-a Variation Trends in Marginal Seas: Assessing the Impact of Global Heating and Anthropogenic Activities Using Time Series Satellite Data (1998-2020)” (with ID MARGO-D-23-00381). We concur with your careful review and precise comments, and appreciate your constructive suggestions very much for improving the manuscript.
In this revised manuscript, we substantially improved the logic of the manuscript genreally to make the presentation more clear. Moreover, we seek help from professional language editing to improve the quality and meet the journal’s required standard.
For your convenience, all the changes of the manuscript and relevant discussions have been highlighted in yellow color in the revised manuscript.
Sincerely yours,
Xiaoyu ZHANG and co-authors
---------------------------------------------------------------------------------------------------------------------------------
Reponses to Reviewer's Responses to Questions
Please see the item-by-item responses given as follows:
Reviewer Comments #1, Mian Liu, 19 Nov 2025
General Comments
This manuscript presents a comprehensive analysis of chlorophyll-a (Chl-a) trends in five marginal seas with varying hydrodynamic and anthropogenic characteristics, using satellite-derived data from 1998 to 2020. The study addresses a timely and important topic—the interplay between global warming and human activities in shaping coastal phytoplankton dynamics. The methodology is robust, combining trend analysis, stability assessment, and correlation/PCA to disentangle the effects of SST, PAR, and SWS on Chl-a. The findings highlight the contrasting responses of enclosed vs. open seas to warming, which is a valuable contribution to the field. The manuscript is generally well-structured and clearly written, though some sections could benefit from greater clarity and methodological detail.
Response: We sincerely thank the reviewers for their positive evaluation of our manuscript and for acknowledging the scientific merit of our work.
Major Comments
Major Comment 1: Data Integration and Harmonization:
The use of multiple satellite sensors (SeaWiFS and MODIS) is appropriate for long-term trend analysis. However, the methodology for merging and harmonizing these datasets (Appendix A) is not sufficiently detailed in the main text. The authors should clarify how they addressed potential biases between sensors, especially for Chl-a and PAR, and justify the selection of specific months for correction.
Response: To fully utilize available data to eliminate inter-sensor biases of chlorophyll-a (Chl-a) and photosynthetically active radiation (PAR), we conducted cross-calibration based on all overlapping observations of SeaWiFS and MODIS during their concurrent period, namely Period T2 from January 2003 to December 2010.
Given the longer time span of MODIS records, we took MODIS data as the reference standard. We first established a data mapping relationship between the two sensors using overlapping datasets. When calibrating SeaWiFS standalone observations, Monthly regression analysis was implemented separately. When the original SeaWiFS data show determination coefficient R2 exceeded 0.5 with calibrated data, the calibrated data was applied. For cases with poor correlation, new values were obtained by averaging original SeaWiFS data and calibrated results. and then against MODIS benchmarks. Relevant calibration details have been supplemented in Appendix A.
Major Comment 2: SST Period Identification:
The identification of SST warming and stable periods using a 4-year moving window is innovative. However, the rationale for choosing this window length and its suitability for capturing climate-scale signals versus interannual variability (e.g., ENSO) should be more thoroughly explained.
Response: To determine the optimal parameter, we tested different moving window sizes of 3, 4 and 5 years for warm season identification. The 3-year window is too short, which tends to capture sea water warming signals unrelated to global warming and produces excessive warming events inconsistent with reality. The 5-year window has an overly long timescale, likely omitting actual warming variations induced by global warming within short periods. Comparative analyses showed that the 4-year moving window yielded the most robust results that match realistic conditions, outperforming both the 3-year and 5-year alternatives. Consequently, the 4-year window was ultimately adopted in this study.
Major Comment 3: Interpretation of Correlation vs. Causation:
While the study identifies correlations between Chl-a and environmental factors, the discussion often implies causation. The authors should more carefully distinguish between correlation and causation, especially when attributing Chl-a changes to global warming versus anthropogenic nutrient inputs.
Response: We sincerely thank the reviewer for highlighting the critical distinction between correlation and causation. We have carefully revised Sections 4.2.2 and 4.2.3 with terms indicating association rather than strong causal verbs. Additionally, we have added a clarifying sentence in Section 4.2.2 acknowledging that while correlations exist, confounding factors prevent us from asserting direct causation regarding the effects of global warming versus nutrient inputs
Major Comment 4: Spatial Heterogeneity and Scale:
The study covers large and diverse regions, but some conclusions (e.g., about “open” vs. “enclosed” seas) may oversimplify intra-regional variability. More nuanced discussion of sub-regional processes (e.g., upwelling, river plumes) would strengthen the interpretation.
Response: We thank the reviewer for this insightful comment regarding spatial heterogeneity. We agree that the broad classification of "open" versus "enclosed" seas required more nuanced discussion. We have revised Sections 4.2.2 and 5.1 to explicitly acknowledge the limitations of this basin-scale classification. We now emphasize that sub-regional processes—specifically upwelling and river plume dynamics (e.g., the Changjiang Diluted Water and Mississippi plume)—create significant intra-regional variability that modulates the generalized trends. Additionally, we have softened the language in the Conclusions to reflect that our findings indicate associations rather than definitive causal demonstrations. Corresponding additions have been made to Sections 4.2.2 “It is important to recognize that substantial sub-regional heterogeneity exists within the broad definitions of open and enclosed seas when generalizing the response of Chl-a to warming. For instance, the negative Chl-a-SST correlations observed in the open East China Sea are not uniform; they are modulated by localized physical processes such as the Changjiang River plume and coastal upwelling, which introduce nutrient-rich waters and alter stratification. Similarly, the Gulf of Mexico exhibits complex spatial patterns where the influence of the Mississippi River plume contrasts with the oligotrophic conditions of the central basin. These findings highlight that while basin-scale geometry is important, intra-regional processes collectively shape the local magnitude and direction of Chl-a responses.” and 5.2” (b) raises the urgency of integrating high-resolution observations and modeling to disentangle sub-regional processes (e.g., upwelling, river plumes) from basin-scale trends, which is prerequisite for accurately quantifying the relative contributions of global warming and anthropogenic nutrient inputs;” to address this point.
Major Comment 5: Anthropogenic Proxy:
Population density is used as a proxy for anthropogenic pressure, which is reasonable but indirect. The authors should acknowledge the limitations of this approach and consider discussing other potential indicators (e.g., fertilizer use, wastewater discharge) where data are available.
Response: We sincerely appreciate the reviewer’s insightful suggestion regarding the use of more direct indicators of anthropogenic pressure, such as fertilizer use and wastewater discharge. We fully agree that these variables offer a more precise representation of specific pollution/nutrients sources.
However, during our data compilation, we encountered significant challenges regarding data comparability across these specific transboundary basins: 1) For the East China Sea and Bohai Sea, official statistics are primarily reported based on administrative boundaries (provincial levels) rather than hydrological boundaries. This makes it difficult to accurately attribute nutrient loads specifically to the target marine basins. 2) For the Amazon Estuary, there is a general lack of long-term, systematic monitoring data due to limited infrastructure in the region. 3) Regarding the U.S. East Coast and Gulf of Mexico, although data are relatively complete, they often differ in format and baseline definitions compared to the Asian and South American regions. Given these constraints, population density remains the most robust, globally standardized, and continuously available metric for cross-continental comparison. It allows for consistent spatial alignment across all basins and is widely accepted in the literature as a reliable proxy for cumulative anthropogenic pressure.
Specific Comments
Specific Comment 1:
Abstract:
The abstract clearly summarizes the main findings but could better highlight the novel aspects of the study, such as the contrasting responses of enclosed vs. open seas to SST rise.
Response: We thank the reviewer for highlighting the need to better emphasize the novel aspects of our study. We agree that the contrasting responses of enclosed versus open seas to SST rise represent a key novelty. Following this suggestion, we have revised the Abstract to explicitly highlight this comparative perspective. Specifically, we added the following sentence after the introduction of the background and research gaps:
“To fill this gap, this study provides a novel comparative analysis of enclosed versus open marginal seas, revealing divergent physiological and ecological responses to rising SST across different nutrient regimes”. We believe this revision sharpens the focus of the paper and more effectively communicates the unique contribution of our work regarding the differential impacts of global warming on various coastal systems.
Specific Comment 2:
Introduction:
Lines 65–70: The discussion of upwelling and its role in Chl-a dynamics is well-placed, but the transition to anthropogenic effects seems a bit abrupt and could be smoother.
Response: We thank the reviewer for pointing out the abrupt transition in Lines 65–70. We have added a transitional sentence to bridge the discussion between natural physical processes (upwelling) and anthropogenic effects. The revised text now reads:
"However, this natural physical control can be masked or even reversed in coastal systems where anthropogenic pressures dominate."
This addition clarifies the shift in context and ensures a smoother logical flow.
Specific Comment 3:
Methods:
Section 2.2: Please specify how the missing data were handled, especially in coastal areas with high turbidity or cloud cover.
Response: The boundaries of the study area were first delineated using Natural Earth data. Kriging interpolation was adopted to fill data gaps caused by high-turbidity masking and cloud removal.
Section 2.3.1: The M-K trend test is appropriately applied, but the justification for using both M-K and least squares trend analysis should be briefly explained.
Response: Least squares trend analysis is adopted to quantify the magnitude of increasing or decreasing trends and calculate spatio-temporal variation rates. The Mann-Kendall test is used to identify whether the trends show significant rise or fall within the study period.
Specific Comment 4:
Results:
Figure 4: The spatial patterns are informative, but the color scales for Chl-a are not always intuitive. Consider using a consistent scale across panels for easier comparison.
Response: We appreciate the reviewer’s suggestion regarding the use of a consistent color scale for Figure 4. We agree that a uniform scale facilitates direct inter-comparison. However, the differences in Chl-a magnitude among the study regions (e.g., the highly eutrophic Bohai Sea versus the oligotrophic open ocean) caused the spatial gradients and detailed patterns within each specific basin to be obscured. Low-concentration areas appeared uniformly blank, while high-concentration areas were saturated. Therefore, to best highlight the distinct spatial heterogeneity and dynamic ranges characteristic of each specific marginal sea, we retained the tailored color scales for each panel. We hope the reviewer understands that this choice prioritizes the clarity of the scientific patterns presented.
Figure 9: The correlation maps are useful, but the classification of correlation strength (e.g., “high negative”) should be clearly defined in the caption or legend.
Response:
Specific Comment 5:
Discussion:
Lines 420–430: The interpretation of PAR in the Amazon Estuary is insightful, but the mechanism behind the weak SST-Chl-a relationship could be elaborated (e.g., barrier layer effects).
Response: We appreciate the reviewer’s suggestion to elaborate on the mechanism behind the weak SST-Chl-a relationship in the Amazon Estuary. As recommended, we have added a detailed explanation regarding the barrier layer effect induced by the low-salinity Amazon plume.
Please see Lines 404–407 in the revised manuscript:
“However, Amazon Estuary is an exception with insignificant negative correlation between Chl-a and SST. The variation of SST of the Amazon Estuary may be related more with input of low salinity Amazon plume, which creates a near surface barrier layer that inhibits mixing, increases SST, and prevents vertical mixing between the upper warm mixed layer and the cold deep ocean (Ferry and Reverdin, 2004; Balaguru et al., 2012; Grodsky et al., 2012; Coles et al.,2013).”
We believe this addition clarifies why the typical SST-Chl-a relationship breaks down in this specific region.
Lines 530–540: The conclusion that Chl-a in the Bohai Sea is less impacted by warming due to high nutrient levels is compelling but should be tempered with the acknowledgment of potential lag effects or nonlinear responses.
Response: We thank the reviewer for highlighting the need to temper our conclusion. We agree that the system may be subject to nonlinear dynamics. We have added the following sentence to acknowledge the potential for future threshold responses: “…which currently masks the potential impact of global warming. However this lagging effect may be temporary and subject to future nonlinear threshold responses.”
Specific Comment 6:
Conclusions:
The conclusions are well-supported but could be more forward-looking. For example, what are the implications for coastal management under future warming scenarios?
Response: Conclusions: We have expanded the conclusion to embed our findings within broader global scientific frameworks, including the Global Carbon Project (GCP), GO₂NE (Global Ocean Oxygen Network), and Marine Ecosystem Regime Shift Theory. We also explicitly discuss the implications for SDG 14 and the UN Ocean Decade, linking regional findings to global climate and sustainability challenges.
Specific Comment 7:
References:
The reference list is comprehensive and up-to-date, though could be included.
Response: some new references have been included, particulary literatures published after year 2022.
Format adjustments:
Format adjustment 1: Line 51: The references cited are divided into two parentheses. Please correct.
Response: Thank you for pointing out the formatting error. Have corrected.
Format adjustment 2: Line 75: a missing space between the end of the sentence and the cited references
Response: Thank you for pointing out the formatting error. Have corrected.
Format adjustment 3: Line 80: Similarly, see line 75
Response: Thank you for pointing out the formatting error. Have corrected.
Format adjustment 4: Line 86: Similarly, see line 75
Response: Thank you for pointing out the formatting error. Have corrected.
Format adjustment 5: Line 145: It is recommended that the complete form be placed on one page, and the title of the tableshould be placed in the center. (Similar situations will not be listed one by one)
Response: Thank you for pointing out the formatting error. We have moved the table title in the center. Additionally, we have adjusted the layout to ensure the complete table is now presented on a single page.
Format adjustment 6: Line 161: The title of the table should come before the table, also the complete form should be placed on one page.
Response: Thank you for pointing out the formatting error. We have moved the table title to the correct position above the table. Additionally, we have adjusted the layout to ensure the complete table is now presented on a single page.
Format adjustment 7: Line 210: The title of the table should be placed in the center. (The following tables all have similar situations and will not list them one by one.)
Response: Thank you for pointing out the formatting inconsistency with the table titles. We have corrected this error and centered all table titles throughout the manuscript, including those not explicitly listed. We appreciate your careful review.
Format adjustment 8: There might be format errors that the reviewer have or omitted or not yet discovered. Please check carefully
Response: We sincerely appreciate the reviewer’s diligence in reminding us to check the manuscript formatting. We take this concern very seriously. Following your advice, we have conducted a comprehensive and careful proofreading of the entire manuscript. We have corrected any format inconsistencies we could identify regarding layout, citation style, figure placement, and reference formatting. We hope the revised version now meets the journal's standards.
Overall Recommendation:
This manuscript presents a valuable and well-executed study that advances our understanding of Chl-a dynamics in marginal seas under dual pressures of climate change and human activity. With minor to moderate revisions—particularly in methodological transparency and causal interpretation—it will be suitable and worthy for publication on Ocean Science.
Response: We sincerely thank the reviewer for the encouraging comments and the thorough evaluation of our manuscript. We are pleased to learn that you find our study valuable for advancing the understanding of Chl-a dynamics under the dual pressures of climate change and human activity.
We greatly appreciate your constructive suggestions regarding methodological transparency and causal interpretation. Following your guidance, we have carefully revised the manuscript to address these points. We believe these revisions have significantly improved the clarity and rigor of the paper, and we hope the revised version meets your expectations for publication in Ocean Science.
Citation: https://doi.org/10.5194/egusphere-2025-4558-AC1
-
AC1: 'Reply on RC1', Nan Yao, 25 May 2026
-
CC1: 'Comment on egusphere-2025-4558', Shengqiang Wang, 10 Jan 2026
General comments
This manuscript presents an interesting comparative analysis of long-term Chl-a trends across five representative marginal seas with contrasting hydrodynamic conditions and anthropogenic pressures. The selection of the study regions is appropriate and well justified, covering both enclosed and open systems under different climatic and human influences. The use of multi-sensor satellite time series spanning more than two decades provides a solid data foundation, and the combination of trend analysis, stability assessment, and correlation analysis allows for a comprehensive examination of Chl-a variability. Overall, the manuscript is generally well structured, and the results are clearly presented. The discussion demonstrates a good understanding of regional oceanographic processes and places the findings in a broader context of global warming and anthropogenic nutrient regulation. This paper can be considered for publication after clarifying the following concerns.Specific comments
1. The manuscript briefly mentions that systematic errors between SeaWiFS and MODIS products were eliminated before merging the datasets. It would be helpful to provide a short quantitative description of the inter-sensor bias correction or cross-calibration results in the main text, for example by reporting mean bias or correlation statistics during the overlap period, with detailed information remaining in Appendix A.2. Chl-a, SST, PAR, and SWS datasets have different spatial resolutions. Although this is common in satellite-based studies, a short explanation of how spatial resampling or aggregation was handled would improve methodological transparency.
3. Coastal and estuarine waters often suffer from data gaps due to cloud cover or high turbidity. The authors should briefly describe how missing pixels were handled when calculating regional means and trend statistics.
4. The four-year moving window approach is reasonable. However, the authors may consider adding a brief sensitivity discussion explaining why a four-year window was selected instead of alternative window lengths, such as three or five years.
5. The manuscript states that Chl-a and SST time series were normalized before correlation analysis. It would be useful to specify whether standard z-score normalization or another approach was applied.
6. Terms such as “Eastern Coastal Waters of the US” and “U.S. East Coast” appear to be used interchangeably. Standardizing terminology throughout the manuscript would enhance clarity.
7. The Conclusions section is relatively lengthy. The authors are encouraged to further streamline this section by concisely summarizing the main findings and scientific contributions of the study. In addition, explicitly stating the limitations of the current analysis and outlining potential directions for future research would strengthen the conclusions.
8. In Figure 1a, the blue label “East Sea” should be corrected to “East China Sea”.
Citation: https://doi.org/10.5194/egusphere-2025-4558-CC1 -
AC3: 'Reply on CC1', Nan Yao, 25 May 2026
Replies to reviewer(s) comments
Dear Editor and Reviewers,
This is the response of the comments on the manuscript “Chlorophyll-a Variation Trends in Marginal Seas: Assessing the Impact of Global Heating and Anthropogenic Activities Using Time Series Satellite Data (1998-2020)” (with ID MARGO-D-23-00381). We concur with your careful review and precise comments, and appreciate your constructive suggestions very much for improving the manuscript.
In this revised manuscript, we substantially improved the logic of the manuscript genreally to make the presentation more clear. Moreover, we seek help from professional language editing to improve the quality and meet the journal’s required standard.
For your convenience, all the changes of the manuscript and relevant discussions have been highlighted in yellow color in the revised manuscript.
Sincerely yours,
Xiaoyu ZHANG and co-authors
---------------------------------------------------------------------------------------------------------------------------------
Reponses to Reviewer's Responses to Questions
CC1: 'Comment on egusphere-2025-4558', Shengqiang Wang, 10 Jan 2026
General comments
This manuscript presents an interesting comparative analysis of long-term Chl-a trends across five representative marginal seas with contrasting hydrodynamic conditions and anthropogenic pressures. The selection of the study regions is appropriate and well justified, covering both enclosed and open systems under different climatic and human influences. The use of multi-sensor satellite time series spanning more than two decades provides a solid data foundation, and the combination of trend analysis, stability assessment, and correlation analysis allows for a comprehensive examination of Chl-a variability. Overall, the manuscript is generally well structured, and the results are clearly presented. The discussion demonstrates a good understanding of regional oceanographic processes and places the findings in a broader context of global warming and anthropogenic nutrient regulation. This paper can be considered for publication after clarifying the following concerns.
Response:We sincerely thank the reviewer for the encouraging comments and the thorough evaluation of our manuscript. We are pleased that you find the comparative analysis of the five marginal seas interesting and the regional selection appropriate. We also appreciate your recognition of our data foundation and analytical approach.
As suggested, we have carefully clarified the specific concerns raised by the reviewer. Detailed responses to each comment are provided below, and corresponding revisions have been made to the manuscript to improve clarity and scientific rigor.
We hope the revised version meets your expectations and is now suitable for publication.
Specific comments
Specific comment #1: The manuscript briefly mentions that systematic errors between SeaWiFS and MODIS products were eliminated before merging the datasets. It would be helpful to provide a short quantitative description of the inter-sensor bias correction or cross-calibration results in the main text, for example by reporting mean bias or correlation statistics during the overlap period, with detailed information remaining in Appendix A.
Response:Thank you for this helpful suggestion. We have revised the Appendix A to include a short quantitative description of the inter-sensor correction during the SeaWiFS-MODIS overlap period. Specifically, we now report the monthly regression-based cross-calibration approach and summarize the fitting performance using the R² statistics for Chl-a and PAR across the study areas. The detailed monthly fitting equations and full R² results for each region remain provided in Appendix A. This revision clarifies how systematic differences between SeaWiFS and MODIS were evaluated and corrected before dataset merging.
Specific comment #2: Chl-a, SST, PAR, and SWS datasets have different spatial resolutions. Although this is common in satellite-based studies, a short explanation of how spatial resampling or aggregation was handled would improve methodological transparency.
Response:We thank the reviewer for the insightful comment. We agree that clarifying how spatial and temporal resolutions were harmonized improves methodological transparency. Accordingly, we have added a detailed explanation in the revised manuscript.To address the different spatial resolutions of Chl‑a, SST, PAR, and wind speed (SWS) datasets, we selected a reference MODIS grid (sample.tif, WGS84 projection) covering the entire study area. Using the gdal.Warp function with bilinear resampling, all variables were reprojected and resampled to this common grid, ensuring identical pixel size and spatial extent.Temporally, the original daily data were aggregated into monthly averages for the period 1998–2020.
Specific comment #3: Coastal and estuarine waters often suffer from data gaps due to cloud cover or high turbidity. The authors should briefly describe how missing pixels were handled when calculating regional means and trend statistics.
Response: The boundaries of the study area were first delineated using Natural Earth data. Kriging interpolation was adopted to fill data gaps caused by high-turbidity masking and cloud removal.
Specific comment #4: The four-year moving window approach is reasonable. However, the authors may consider adding a brief sensitivity discussion explaining why a four-year window was selected instead of alternative window lengths, such as three or five years.
Response: To determine the optimal parameter, we tested different moving window sizes of 3, 4 and 5 years for warm season identification. The 3-year window is too short, which tends to capture sea water warming signals unrelated to global warming and produces excessive warming events inconsistent with reality. The 5-year window has an overly long timescale, likely omitting actual warming variations induced by global warming within short periods. Comparative analyses showed that the 4-year moving window yielded the most robust results that match realistic conditions, outperforming both the 3-year and 5-year alternatives. Consequently, the 4-year window was ultimately adopted in this study.
Specific comment #5: The manuscript states that Chl-a and SST time series were normalized before correlation analysis. It would be useful to specify whether standard z-score normalization or another approach was applied.
Response:Thank you for pointing out this ambiguity. We have checked the code and clarified the description in the revised manuscript. No additional z-score normalization was applied before the correlation analysis. Instead, Pearson correlation coefficients were calculated directly from the paired Chl-a and environmental-factor time series after quality control and temporal matching. Because Pearson’s r is inherently standardized by the mean and standard deviation of each variable, the correlation calculation itself accounts for differences in units and magnitudes.
Specific comment #6: Terms such as “Eastern Coastal Waters of the US” and “U.S. East Coast” appear to be used interchangeably. Standardizing terminology throughout the manuscript would enhance clarity.
Response:Thank you for this helpful comment. We have carefully checked the full manuscript and standardized the terminology throughout. In particular, we now consistently use “Eastern Coastal Waters of the US” to refer to this study area, ensuring that the wording is consistent across the text, figures, tables, and appendices.
Specific comment #7: this section by concisely summarizing the main findings and scientific contributions of the study. In addition, explicitly stating the limitations of the current analysis and outlining potential directions for future research would strengthen the conclusions.
Response:We sincerely thank the reviewers for recognizing the robustness of our conclusions and for providing constructive suggestions to improve the manuscript by explicitly stating the limitations of the current analysis and outlining potential directions for future research. In the revised conclusion, we acknowledge that unresolved inter-basin physical-biogeochemical feedbacks (e.g., upwelling, coastal currents, and deoxygenation) limit the mechanistic interpretation of the current trends. We outline future research directions focusing on the Anthropocene marine hotspot concept, emphasizing the need to disentangle the synergistic effects of multiple stressors (climate change, eutrophication, and resource exploitation) on ecosystem dynamics.
These additions have strengthened the conclusion by clearly stating the study's limitations while enhancing its global relevance and scientific depth. We believe the revised manuscript fully addresses your concerns.
Specific comment #8: In Figure 1a, the blue label “East Sea” should be corrected to “East China Sea”.
Response:We thank the reviewer for pointing out the inaccuracy in the geographical label. As suggested, we have corrected the label “East Sea” to “East China Sea” in Figure 1a. Furthermore, we have carefully checked the entire manuscript (including all figures, tables, and the main text) and standardized the expression of all place names to ensure consistency and accuracy.
Citation: https://doi.org/10.5194/egusphere-2025-4558-AC3
-
AC3: 'Reply on CC1', Nan Yao, 25 May 2026
-
RC2: 'Comment on egusphere-2025-4558', Anonymous Referee #2, 10 Mar 2026
The manuscript “Chlorophyll-a Variation Trends in Marginal Seas: Assessing the Impact of Global warming and Anthropogenic Activities Using Time Series Satellite Data (1998-2020)” by Nan Yao and colleagues assesses the impact of sea surface temperature and nutrient concentration in a couple of regional seas and basins on Chlorophyll a concentration timeseries derived from ocean color remote sensing products. The statistical analysis differentiates between enclosed seas and open water regimes, as well as periods of stable or rising temperatures, and as such, tries to disentangle the effects of rising sea surface temperatures among other physical parameters on primary production. The study could benefit from some revisions regarding the sometimes lenghty presentation of results, contrasting the rather short discussion, missing the embedding of the conclusions drawn in the broader scientific frame. I have some suggestions that hopefully the authors can address to improve the manuscript.
The differentiation of open and enclosed seas seems a bit weak because the authors have already stated the influence of ocean currents (and water mass trasnport) in the Gulf of Mexico. However, in the Results and Discussion Sections, the authors first generalize based on the Bohai Sea for statements on the enclosed seas which do not old for the Gulf of Mexico. Maybe the general statements could be somehow toned down?
As in the Discussion Section, the authors still introduce new results, I got a bit lost in the details. I would like to see how the results are discussed along available literature on drivers of Chl-a in the five regions selected in this study. This is partly done in Section 4.2.3 (L. 455-472), the study would benefit from assessing the results/conclusions with literature. Moreover, it would be interesting to broaden the perspective at some point, create a train of thought (like in the Conclusions), and compare, how other regions are shaped (quickly synthesizing other studies).
Quality of plots: I would prefer if you could spell out all abbreviations again (increased readability, also inconsistently done in manuscript) and generally use a larger font size in the labels and annotations.
Appendix A, C, D: Could you integrate these parts in the main manuscript? They are rather short and the Methods Section could profit from including a bit more details about the processing. You could still keep all the resulting equations of Appendix A in an Appendix Table.
Please carefully check grammar and spelling again, I listed some examples below that caught my eye.
Specific comments
Section 1
L. 17: Why do you prefer the term "oceanic color" to "ocean color"?
L. 21: "Specifically, in eutrophic closed seas"
L. 22: apparently/appear to?
L. 23: in the central part of the sea
L. 24 "with distance offshore" please rephrase
L. 33: raising
L. 34: linked
L. 35: exchange of what?
L: 40: I would think the term "biological carbon pump" is more common
L. 51: increasing with distance from shore/from coast?
L. 51: There is a sentence consisting only of citations. What is the message?
L. 64: Maybe you could add the values here?
L. 68-71: I suggest splitting the sentence.
L. 73: including? I suggest re-phrasing and splitting, your point here is really hard to grasp.
L. 76-77: Please rephrase: You argue that global warming induced changes of PAR and SWS might change chl-a, but this is complex to clarify?
L. 81: reference for "The influence of SWS on Chl-a is non-linear and spatially heterogeneous."? Maybe you want to add references to the following statements as well? Is it only Wang and Xiu (2022)?
L. 95: warm water?Section 2
Please reconsider the use of tenses and unify in the whole section. Right now you switch between past and present tense quite randomly.
L. 113: I'd prefer larger font size for the annotations on the world map and for the geographical names in the subsets a-e.
L. 127-129: Please rephrase this sentence and unify tenses, maybe "events which increased"?
L. 138: Add a reference fot the pollutants.
Table 1: Consider horizontal row seperators because the table is hard to read.
L. 165: What are applicable methods? Do you mean you "applied a method"? Maybe you want to shift the processing to the Methods Section 2.3?
l. 170: "The two types of data products have different coverage times" - what are the different types? That's unclear.
L. 203: Please rephrase the reference to Appendix C.
L. 226: Is there a reference for the seasonal cycles or weather events?
L. 243-249: Unlcear how you conducted the PCA, which are the input timeseries and which is the target.
L. 244: Please rephrase. What do you conclude from M+R1993?
Figure 4: It would be much clearer if you could use the same color bar scale for all maps - log10 Chl-a could be considered. Panel f: No difference visible between two red dashed lines (GOM, BS). Please consider using log10 Chl-a and all regions on one y-axis. "monthyl change rate" seems a bit odd here, could you transfer it to the main text?Section 3
L. 253-255: As you have only two closed sea areas, it seems a bit odd to generalize from the Bohai Sea only, as the Gulf of Mexico represents the contrary.
L. 254: "while the Gulf... shows"
L. 259: Consistently higher annual Chl-a concentration? variation?
L. 259: "the other regions"
L. 264: Remove whole line.
L. 272: Please check grammar.
L. 274: "While a slightly increasing tendency"
L. 276: "in the sea area"
L. 279: "continous increase"
L. 279: decline of the chl-a concentration in the East China Sea?
L. 279-280: I don't see where you indicated the "turn point of Bohai Sea" in Figure 5.
Figure 5: Spelling of "red dashed line", first", "a regressive trend line", "four columns to the right". Waht are the colors in the first column representing? Which color - red (blue) - refers to Chl-a (SST)? X-axis ticks missing. COuld you unify the x-axis for all panels? Please consider log10 Chl-a for all panels. Maybe you can specify: it's a linear regression line you added to the timeseries. What about their statistics/sgnificances?
L. 285: What "seasonal Chl-a" do you mean? concentration? It is not clear to me what you are refering to and what is different in the Gulf of Mexico.
L. 288: I don't get what you mean by " the Chl-a in
winter substitute with the summer Chl-a and becomes the second decisive factor".
Table 5: Check capitalization. Add a vertical line to separate open and enclosed sea areas.
L. 296-297: You mean "areas with increasing Chl-a trend"?
Figure 6: A legend is missing - do you use the same boundary norm for all panels?
Caption and panel labels do not match.
Why is the fraction of downward tendency in the Gulf of Mexico so high?
L. 308: " as illustrated in Figure 5d and 6d" - no! pie charts disagree!
L. 313: terrestrial nutrient input
L. 320: What are "significant rivers"?
L. 324-339: Please consider re-writing the two paragraphs and sort by open/enclosed. The first paragraph is quite chaotic, the second provides a bit more structure.
L. 325: What is an "obvious" trend?
L. 329: In which terms are the Chl-a stabilites "significant different"?
L. 330-331: Please rephrase "Chl-a shows lower stability of Chl-a are observed..."
L. 338: "whatever" - probably: "in both open and enclosed seas."?
Figure 7: Panel labels do not match caption.
L. 345: "spatio-temporal", please be consistent in the whole document, also L. 346.Section 4
Section 4.1: This is still presenting results, so shift to Results Section?
Figure 8: I can't distinguish "color-coded data density". Significance levels of panels to not match caption. Please use bigger font size. What do you gain from including this figure in the manuscript compared to a table reporting on the correlation statistics like Table 5?
L. 359: All panels suggest a negative correlation of Chl-a and SST, but not all are significant. I don't get why you highlight the open seas here.
L. 371-383: I suggest to reorder the two paragraphs by regions. Further, it is unlcear to me how you conducted the PCA (see comment to L. 243-249). How did you prepare the data? Did you use spatial or temporal averaging? What avout the two time periods specified in the Methods Section?
L. 380-383: Is there a reference to underline your thoughts?
L. 394: You probably want to say, that your three indices are valuable for predicting Chl-a concentrations? "determining Chl-a concentration" sounds misleading.
L. 395 studied
L. 397: What is "inhibition of Chl-a"?
L. 397 "induced by global warming"
L. 408: "heightened" - increased?
L. 423: The section heading is not really fitting. Here, you report results on SST and refrain from discussing global warming as such.
Figure 9: This is a complex figure, I would like to see it introduced in the Results Section.
Can you explain why the correlation coefficients vary so much in space? I would have assumed that major current patterns would be visible as strucutral element.
In the caption, you specify the years and differentiate between SST rising and stable periods. Did you evaluate more than one period for each panel? Maybe a cross-reference to Table 4/Figure 3 would be nice. There, you only specified one stable/rising period for each region, so I would assume this is also the underlying data here?
Please unify the y-axis in panel group (b), so percentages can be compared more easily.
L. 440-441: Why are open sea ares more affected by SST? The values stated for enclosed seas in L. 447-448 are comparable to the open seas.
L. 455/Section 4.2.3: This section is more about Chl-a timeseries than on anthropogenic nutrient inputs. Could you enrich the section with a discussion on nutrients and their impact on Chl-a, citing relevant literature?
L. 461: "In spring, there is"?
L. 470: "In autumn, there is"?
L. 475-476: reference?
L. 481: "since 4" - something is missing here.
L. 481: "a decreasing rate of Chl-a conc increase", probably easier to rephrase: "a slowdown of Chl-a increase"?
L. 481-484: references?L 548: "fluvial" only appears here, I suggested "terrestrial" (L. 313, but also elsewhere)
L. 560: Github repository: could you provide a commit ID to track which version you used? Some of the comments in the code is in Chinese, it would be great to translate it to English. It would be nice to have a bit more information in the Readme document on github.
L. 753: This is already Appendix A.
L. 838: Which validation steps explictly?
Appendix E: Check capitalization. Could you add the significance levels of the trends?
Appendix F: Check capitalizationTechnical comments
Please unify in whole document:
Tab. or Table? Fig. or Figure?
Check general use of comma, use of Oxford comma
Text alignment within tables (left?)
Consistent use of articles when refering to, e.g., "the Bohai Sea" (L. 278)
Please consider the use of "temporal variation rate" and "trend" (e.g., Figure 6). I suggest to stick to one term and use it throughout the mansucript. Switching back and forth leads to irritations on my side. In the text you even use "annual growth rate" additionally (e.g., L. 300).
Same for "increase"/"upward tendency"/"growth" - the wild mix of these terms confuses me when comparing the text to figures (e.g. L. 308-310 and caption Figure 6).
Tables: Capitalization of first word in each grid cellL. 41: add space after "carbon sink" before citation, also L. 45, 49, 53, 75, 80, 86, 127, 196, 239, 244, 337, 477
L. 60: please re-order citations
L. 66: two dots in "e..g."
L. 71: anthropogenically enhanced processes
L. 78: use em-dash
L. 96: describe (plural), or "the D&M section describes", also for introduction of Results, Discussion, and Conclusions sections
L. 105: five (as in the rest of the manuscript)
L. 133: Please unify in the manuscript: HABs events or HAB events?
L. 140: acts
L. 153: Consider use of Oxford comma, reorder citations for consistency
L. 158: Please unify in whole document: Tab. or Table?
Table 2: Please add date of last access of websites, consider using horizontal lines to separate rows
L. 176: "to the availability"
Figure 2: Please unify capitalization.
Table 3: "Significantly"
L. 214: "in five different locations"
L. 257: sea area
L. 371: Split sentences correctly.
L. 404: steadily
L. 405: However
L. 418: currents are
L. 424: Pearson
L. 487: surplus ")"
L. 562: Missing space after link. Please add last access to links.
L. 750: Overlapping
L. 829: dailyCitation: https://doi.org/10.5194/egusphere-2025-4558-RC2 -
AC2: 'Reply on RC2', Nan Yao, 25 May 2026
Replies to reviewer(s) comments
Dear Editor and Reviewers,
This is the response of the comments on the manuscript “Chlorophyll-a Variation Trends in Marginal Seas: Assessing the Impact of Global Heating and Anthropogenic Activities Using Time Series Satellite Data (1998-2020)” (with ID MARGO-D-23-00381). We concur with your careful review and precise comments, and appreciate your constructive suggestions very much for improving the manuscript.
In this revised manuscript, we substantially improved the logic of the manuscript genreally to make the presentation more clear. Moreover, we seek help from professional language editing to improve the quality and meet the journal’s required standard.
For your convenience, all the changes of the manuscript and relevant discussions have been highlighted in yellow color in the revised manuscript.
Sincerely yours,
Xiaoyu ZHANG and co-authors
---------------------------------------------------------------------------------------------------------------------------------
Reponses to Reviewer's Responses to Questions
Please see the item-by-item responses given as follows:
Anonymous Referee #2, 10 Mar 2026
General Comments
The manuscript “Chlorophyll-a Variation Trends in Marginal Seas: Assessing the Impact of Global warming and Anthropogenic Activities Using Time Series Satellite Data (1998-2020)” by Nan Yao and colleagues assesses the impact of sea surface temperature and nutrient concentration in a couple of regional seas and basins on Chlorophyll a concentration timeseries derived from ocean color remote sensing products. The statistical analysis differentiates between enclosed seas and open water regimes, as well as periods of stable or rising temperatures, and as such, tries to disentangle the effects of rising sea surface temperatures among other physical parameters on primary production. The study could benefit from some revisions regarding the sometimes lenghty presentation of results, contrasting the rather short discussion, missing the embedding of the conclusions drawn in the broader scientific frame. I have some suggestions that hopefully the authors can address to improve the manuscript.
Response:We sincerely thank the reviewer for the encouraging comments and the thoughtful critique of our manuscript. We are pleased that you recognize the value of our comparative analysis across regional seas and our effort to disentangle the effects of SST and anthropogenic drivers on Chl-a dynamics.
Following your suggestions, we have substantially revised the manuscript in the following two aspects:
(1) Results Section: We have streamlined the presentation of results, reducing the overall length by approximately 15%. the text has been refined for conciseness and clarity. The specific locations of these refinements are highlighted in blue in the revised manuscript for easy reference.
(2) Conclusions: We have expanded the conclusion to embed our findings within broader global scientific frameworks, including the Global Carbon Project (GCP), GO₂NE (Global Ocean Oxygen Network), and Marine Ecosystem Regime Shift Theory. We also explicitly discuss the implications for SDG 14 and the UN Ocean Decade, linking regional findings to global climate and sustainability challenges.
We believe these revisions have significantly strengthened the manuscript. We hope the revised version meets your expectations.
Major Comments
Major Comment 1: The differentiation of open and enclosed seas seems a bit weak because the authors have already stated the influence of ocean currents (and water mass trasnport) in the Gulf of Mexico. However, in the Results and Discussion Sections, the authors first generalize based on the Bohai Sea for statements on the enclosed seas which do not old for the Gulf of Mexico. Maybe the general statements could be somehow toned down?
Response: We agree with the reviewer that generalizing all enclosed seas based solely on the Bohai Sea is inaccurate, given the strong hydrodynamic activity in the Gulf of Mexico. Following this comment, we have carefully revised the manuscript to tone down these generalizations.
In the revised version, we now explicitly distinguish between "enclosed seas with restricted water exchange" (referring specifically to the Bohai Sea) and "enclosed seas with strong water exchange" (referring to the Gulf of Mexico). We have replaced broad terms like "enclosed seas" with these more precise descriptions throughout the Results and Discussion sections to ensure the text accurately reflects the distinct physical controls on Chl-a dynamics in these two regions.
Major Comment 2: As in the Discussion Section, the authors still introduce new results, I got a bit lost in the details. I would like to see how the results are discussed along available literature on drivers of Chl-a in the five regions selected in this study. This is partly done in Section 4.2.3 (L. 455-472), the study would benefit from assessing the results/conclusions with literature. Moreover, it would be interesting to broaden the perspective at some point, create a train of thought (like in the Conclusions), and compare, how other regions are shaped (quickly synthesizing other studies).
Response: We thank the reviewer for this constructive critique. We have substantially revised Section 4.2 as follows:
(1)Sections 4.2.1 and 4.2.2 have been rewritten to remove redundant numerical result descriptions and now include explicit comparisons with previous studies on SST–Chl-a decoupling by river plumes (e.g., Gomes et al., 2018; Foltz et al., 2009), stratification–productivity relationships on the ECS and U.S. East Coast shelves (Behrenfeld et al., 2006; Liu et al., 2010; Kako et al., 2016), and wind–upwelling linkages (Hu & Wang, 2016; Walsh et al., 2005).
(2)Section 4.2.3 now opens with a synthesis paragraph linking physical and anthropogenic drivers, and closes with a cross-regional comparison based on our five-study-site findings within global syntheses of coastal Chl-a drivers (Cloern et al., 2016; Glibert et al., 2014; Nixon, 1995; Seitzinger et al., 2010).
The discussion now emphasis mechanistic interpretation rather than reiterating figure statistics, and highlights sub-regional heterogeneity as indicated.
Major Comment 3: Quality of plots: I would prefer if you could spell out all abbreviations again (increased readability, also inconsistently done in manuscript) and generally use a larger font size in the labels and annotations.
Response: Thank you for the suggestion. We have retained the full names of the different sea areas and ensured that they correspond consistently with the terminology used in the main text. In addition, while maintaining the overall clarity and neatness of the figures, we increased the font size of all legends and annotations to improve readability.
Major Comment 4: Appendix A, C, D: Could you integrate these parts in the main manuscript? They are rather short and the Methods Section could profit from including a bit more details about the processing. You could still keep all the resulting equations of Appendix A in an Appendix Table.
Response: Thank you for your valuable suggestion. After careful consideration, we prefer to keep Appendix A, C and D as they are. These contents involve specialized computational formulas and auxiliary processing details, which would disrupt the logical coherence of the main Methods section if incorporated. We retain relevant equations in the appendix table for easy reference, and the current layout ensures neat and reasonable manuscript structure.
Major Comment 5: Please carefully check grammar and spelling again, I listed some examples below that caught my eye.
Response: We have carefully checked the full text for grammar and spelling errors and revised them accordingly, hoping the manuscript now meets publication requirements.
Specific comments
Section 1
- 17: Why do you prefer the term"oceanic color" to "ocean color"?
Response: have replaced “ocean color” to “oceanic color” in Line 17, in addition, we checked through the whole paper to avoid the same mistakes.
- 21: "Specifically, in eutrophic closed seas"
Response: has revised as “Specifically, in eutrophic closed seas with weak hydrodynamic exchange capacity, such as the Bohai Sea, increasing SST did not apparently suppress Chl-a concentration; instead, a continuous increase in Chl-a was observed in the center of the sea.”
- 22: apparently/appear to?
Response:“apparent” has replaced with “apparently”.
- 23: in the central part of the sea
Response:has revised as “in the center of the sea”.
- 24"with distance offshore" please rephrase
Response:has revised as “with increasing distance offshore”.
- 33: raising
Response:has revised.
- 34: linked
Response:has revised.
- 35: exchange of what?
Response:has revise as “hydrodynamic exchange”.
L: 40: I would think the term "biological carbon pump" is more common
Response:has replaced with term "biological carbon pump".
- 51: increasing with distance from shore/from coast?
Response:has revised as “increasing with distance from coast”.
- 51: There is a sentence consisting only of citations. What is the message?
Response: has deleted unnecessary citations.
- 64: Maybe you could add the values here?
Response: SST warming was accompanied by a decreasing trend in Chla, though no quantitative correlation coefficient was provided.
- 68-71: I suggest splitting the sentence.
Response:has splitting the sentence as following: “For example, in the Baltic Sea, an increase in cultural eutrophication since the 1950s has produced marked sedimentary changes in a range of organic geochemical indicators. These indicators, including those reflecting increased phytoplankton biomass, have been suggested as important secondary markers for the proposed Anthropocene epoch at this candidate Global Boundary Stratotype Section and Point (GSSP) site”.
- 73: including? I suggest re-phrasing and splitting,your point here is really hard to grasp.
Response:has re-phrased and split as follwong: “Other anthropogenically enhanced processes have also profoundly altered the correlation between Chl-a and SST. These include predation pressure—particularly in aquaculture areas, where filter-feeding organisms reduce phytoplankton biomass (e.g., Frau et al., 2021; Mao et al., 2020), and commercial fishing, which indirectly affects phytoplankton biomass by altering zooplankton and fish abundance (Campos-Silva et al., 2021; Reid et al., 2000).”
- 76-77: Please rephrase: You argue that global warming induced changes of PAR and SWS might change chl-a, but this is complex to clarify?
Response:In addition, the complex responses of photosynthetically active radiation (PAR) and surface wind speed (SWS) to global warming exert additional controls on upper-layer Chl-a, making it difficult to clarify the sole impact of warming independent of these concurrent physical changes.已经修改。
- 81: reference for "The influence of SWS on Chl-a is non-linear and spatially heterogeneous."? Maybe you want to add references to the following statements as well? Is it only Wang and Xiu (2022)?
Response:has added a new reference: X Wei, H Zhao, Spatiotemporal distribution of chlorophyll-a concentration in the south China sea and its possible environmental regulation mechanisms, Marine Environmental Research, 2025
- 95: warm water?
Response: has revised as “warm water”.
Section 2
Please reconsider the use of tenses and unify in the whole section. Right now you switch between past and present tense quite randomly.
Response: has revised the tense and unified, please see the text with bright yellow.
- 113: I'd prefer larger font size for the annotations on the world map and for the geographical names in the subsets a-e.
Response: Thank you for your valuable suggestion. We attempted to adjust the font size of geographical labels. Given the large number of place names and lengthy text, enlarging the font would cause severe overcrowding across the sea areas. Accordingly, we retain the original font size, and the figure still maintains good clarity for reading.
- 127-129: Please rephrase this sentence and unify tenses, maybe "events which increased"?
Response: has revised as suggested.
- 138: Add a reference fot the pollutants.
Response: has added references as suggested.
Table 1: Consider horizontal row seperators because the table is hard to read.
Response:We have readjusted the table width for better visual presentation. No additional horizontal lines are added to maintain consistent three-line table formatting throughout the paper.
- 165: What are applicable methods? Do you mean you "applied a method"? Maybe you want to shift the processing to the Methods Section 2.3?
Response:yes, has revised as “We applied a consistent preprocessing method (see Section 2.3) to establish a unified satellite dataset from multiple satellites. “
- 170: "The two types of data products have different coverage times" - what are the different types? That's unclear.
Response:has revised as “The two satellite sensors (SeaWiFS and MODIS) have different operational periods”.
- 203: Please rephrase the reference to Appendix C.
Response:The relevant calculation formulas are provided in Appendix C.
- 226: Is there a reference for the seasonal cycles or weather events?
Response: the reference for the weather events extracted in this paper was indicated in the following text from L238-L240 above table 4. “The main SST rising periods of GM, ECS, and ECW tally with the time windows of the most intense El Niño event recorded (2014-2016), whereas distinct rises in SST for AE and BS are coincident with the occurrence of the El Niño windows of 2002-2003 and 2009-2010, respectively (Cai et al., 2021).”, and the record by NOAA in “websitehttps://www.cpc.ncep.noaa.gov/products/analysis_monitoring/ensostuff/ONI_v5.php”.
- 243-249: Unlcear how you conducted the PCA, which are the input timeseries and which is the target.
Response: Thank you for your comment. Pearson correlation analysis and principal component analysis (PCA) serve as two independent analytical methods based on the same dataset. Pearson correlation is employed to fit time-series data and explore linear correlations between environmental factors and chlorophyll-a concentration. With all observational time series adopted as input variables, PCA is applied to extract primary driving factors of chlorophyll-a variation.
- 244: Please rephrase. What do you conclude from M+R1993?
Response:we moved the citation to the end of the sentence.
Figure 4: It would be much clearer if you could use the same color bar scale for all maps - log10 Chl-a could be considered. Panel f: No difference visible between two red dashed lines (GOM, BS). Please consider using log10 Chl-a and all regions on one y-axis. "monthyl change rate" seems a bit odd here, could you transfer it to the main text?
Response: We attempted to adopt a unified color scale and logarithmic scale, yet the visual presentation was unsatisfactory. Accordingly, we retain the original color scale and vertical axis units. Meanwhile, dark red curve of GOM has been adjusted to rose red for better visual distinction.
Section 3
- 253-255: As you have only two closed sea areas, it seems a bit odd to generalize from the Bohai Sea only, as the Gulf of Mexico represents the contrary.
Response:Thank you for your valuable comment. We fully agree with your view and have revised the relevant content accordingly. We no longer simply classify them as enclosed seas. Instead, we define the Bohai Sea as an enclosed sea with weak hydrodynamic exchange, while the Gulf of Mexico is described as an enclosed sea with strong hydrodynamic exchange to distinguish their discrepancies.
- 254: "while the Gulf... shows"
Response:has revised.
- 259: Consistently higher annual Chl-a concentration? variation?
Response:has revised as “Meanwhile the East China Sea, which is an open sea in highly eutrophic state, exhibits a consistently higher annual Chl-a, with spring values frequently exceeding 0.6 mg/m3. The other three regions all have year-round Chl-a below 0.6 mg/m3. “
- 259: "the other regions"
Response:has revised.
- 264: Remove whole line.
Response:has removed“This is in stark contrast to the Bohai Sea and the Gulf of Mexico, where the change rates of monthly variation are 18.97% and 16.32% respectively, neither exceeding the 20%.”
- 272: Please check grammar.
Response:has revised as “The Mann-Kendall trend test reveals distinct temporal trends in Chl-a concentrations across the five study regions (Fig. 5).”
- 274: "While a slightly increasing tendency"
Response:has revised
- 276: "in the sea area"
Response:failed to locate.
- 279: "continous increase"
Response:we spell ss continuous
- 279: decline of the chl-a concentration in the East China Sea?
Response: Yes, the East China Sea exhibits a non-significant declining trend after 2017.
- 279-280: I don't see where you indicated the "turn point of Bohai Sea" in Figure 5.
Response:We observe a noticeable declining trend of Chl-a concentration in the Bohai Sea starting from 2014, which is consistent with findings in existing studies.
Figure 5: Spelling of "red dashed line", first", "a regressive trend line", "four columns to the right". Waht are the colors in the first column representing? Which color - red (blue) - refers to Chl-a (SST)? X-axis ticks missing. COuld you unify the x-axis for all panels? Please consider log10 Chl-a for all panels. Maybe you can specify: it's a linear regression line you added to the timeseries. What about their statistics/sgnificances?
Response:We have revised the figure panels into subplots consisting of bar graphs and line graphs, while retaining the original linear scale of Chl-a on the vertical axis.
The horizontal axis is only unified for the line graphs, as further expanding the figure width is not feasible. In addition, we have added horizontal ticks on the x-axis for improved readability.
- 285: What "seasonal Chl-a" do you mean? concentration? It is not clear to me what you are refering to and what is different in the Gulf of Mexico.
Response:has revised as “The seasonal mean Chl-a concentrations do not always follow the same temporal trend as the annual mean. However, in the Gulf of Mexico, all four seasonal means show consistent increasing trends that align with the annual mean trend (Fig. 5).”
- 288: I don't get what you mean by " the Chl-a in winter substitute with the summer Chl-a and becomes the second decisive factor".
Response:has revised as “winter and spring Chl-a concentrations are strongly correlated with the annual mean and thus serve as the primary drivers of the annual trend. The Amazon Estuary represents an exception, where summer and winter Chl-a are more important in determine the annual trend.”
Table 5: Check capitalization. Add a vertical line to separate open and enclosed sea areas.
Response:has revised.
- 296-297: You mean "areas with increasing Chl-a trend"?
Response:yes, has revised.
Figure 6: A legend is missing - do you use the same boundary norm for all panels?
Response:A unified normalized color scale has been added, and consistent boundaries are applied to all subplots across different sea areas
Caption and panel labels do not match.
Response:the caption has been corrected as “Temporal variation trend of seasonal and annual Chl-a in each pixel in the five locations.”
Why is the fraction of downward tendency in the Gulf of Mexico so high?
Response:Compared with other sea areas, the area showing a declining trend in the Gulf of Mexico is relatively limited.
- 308: " as illustrated in Figure 5d and 6d" - no! pie charts disagree!
Response: The pie chart has been redrawn based on the data in Appendix E. The text content is now consistent with the figures.
- 313: terrestrial nutrient input
Response:has revised.
- 320: What are "significant rivers"?
Response:it could be major rivers ,now we have deleted the sentence to be concise.
- 324-339:Please consider re-writing the two paragraphs and sort by open/enclosed. The first paragraph is quite chaotic, the second provides a bit more structure.
Response:The revision has been completed. We separately discuss enclosed seas and open seas, making the content concise and logically organized.
- 325: What is an "obvious" trend?
Response:The so-called obvious trend refers to substantial variations in pixel values. In principle, larger fluctuations of pixel values correspond to lower stability. Besides, sustained increasing or decreasing trends also result in low stability.
- 329:In which terms are theChl-a stabilites "significant different"?
Response:We have revised and refined the corresponding section thoroughly, and removed the inappropriate expression of "significant different".
- 330-331: Please rephrase "Chl-a shows lower stability of Chl-a are observed..."
Response:has revised as “Lower stability of Chl-a is observed in areas.”
- 338: "whatever" - probably: "in both open and enclosed seas."?
Response:has revised.
Figure 7: Panel labels do not match caption.
Response:We have revised the figure labels and captions, which are now consistent with each other.
- 345: "spatio-temporal", please be consistent in the whole document, also L. 346.
Response:has revised.
Section 4
Section 4.1: This is still presenting results, so shift to Results Section?
Response: After careful consideration, we decide to retain Section 4.1 in its current position. This section analyzes correlations among environmental factors across different sea areas and their effects on chlorophyll-a based on Pearson correlation and PCA analysis, which cannot be separately placed in the Results section. We greatly appreciate your valuable suggestion.
Figure 8: I can't distinguish "color-coded data density". Significance levels of panels to not match caption. Please use bigger font size. What do you gain from including this figure in the manuscript compared to a table reporting on the correlation statistics like Table 5?
- 359: All panels suggest a negative correlation of Chl-a and SST, but not all are significant. I don't get why you highlight the open seas here.
Response:We notice that two out of the three open sea areas, the East China Sea and the eastern coastal waters of the United States, show significant negative correlations between Chl-a concentration and SST. By contrast, only weak correlations are observed in the Amazon Estuary, Bohai Bay and the Gulf of Mexico. We consider open sea environment as a key factor modulating such correlation. Warm seawater in open seas generally exerts an inhibitory effect on Chl-a. Although the Amazon Estuary also belongs to open sea waters, it is strongly influenced by other confounding factors, weakening the response of Chl-a to SST variation. Despite the overall weak negative trend across regions, the underlying driving mechanisms differ substantially.
- 371-383: I suggest to reorder the two paragraphs by regions. Further, it is unlcear to me how you conducted the PCA (see comment to L. 243-249). How did you prepare the data? Did you use spatial or temporal averaging? What avout the two time periods specified in the Methods Section?
Response:Thank you for the suggestion. We have revised the PCA description to clarify the data preparation procedure. For each study region, monthly raster data of Chl-a, PAR, SST, and surface wind speed were first spatially averaged over all valid pixels within the region, producing one regional monthly mean value for each variable. The resulting monthly time series were then normalized using min-max normalization before PCA. PCA was therefore conducted using region-level monthly environmental factor series rather than pixel-level data. The two temperature-change periods defined in the Methods were used for the SST-Chl-a correlation analysis, whereas PCA was performed using the full monthly time series for each region.
- 380-383: Is there a reference to underline your thoughts?
Response:has added a references, please see in the text.
- 394: You probably want to say, that your three indices are valuable for predicting Chl-a concentrations? "determining Chl-a concentration" sounds misleading.
Response:we finally use “regulating”.
- 395 studied
Response:has revised as “studied area”.
- 397: What is "inhibition of Chl-a"?
Response:has revised as “suppressive effect”
- 397 "induced by global warming"
Response:has revised as “in the context of global warming”
- 408: "heightened" - increased?
Response:has revised as “greater sensitivity”
- 423: The section heading is not really fitting. Here, you report results on SST and refrain from discussing global warming as such.
Response:We appreciate your valuable comment on the section title. This subsection not only discusses the relationship between global warming-induced sea surface temperature rise and Chl-a variation, but also elaborates considerable regional thermal changes driven by seasonal fluctuation and upwelling effects other than global warming. Accordingly, we revised the section title to better cover the Chl-a responses under global wariming with diverse temperature driving factors and subsequent.
Figure 9: This is a complex figure, I would like to see it introduced in the Results Section.
Response:We highly appreciate your insightful comment on the placement of Figure 9. After repeated discussions among all authors, we ultimately decide to retain this figure and its relevant discussion in the Discussion section. Figure 9 clearly illustrates the variations in Chl-a-SST correlations during diverse water mass interaction processes across different sea areas. It provides critical evidence for distinguishing SST changes driven by different mechanisms and evaluating the corresponding ecological responses of chlorophyll-a. Therefore, we consider it appropriate to discuss these correlation characteristics and their implications for sea warming effects on Chl-a in the Discussion section
Can you explain why the correlation coefficients vary so much in space? I would have assumed that major current patterns would be visible as strucutral element.
Response:We fully agree with your valuable opinion. This is exactly why we place this figure in the Discussion section for in-depth analysis.
In the caption, you specify the years and differentiate between SST rising and stable periods. Did you evaluate more than one period for each panel? Maybe a cross-reference to Table 4/Figure 3 would be nice. There, you only specified one stable/rising period for each region, so I would assume this is also the underlying data here?
Response:We greatly agree with your comment. Multiple warming and stable periods indeed exist in each study region. Table 4 and Figure 3 present the most prominent warming and stable phases, the most prominent warming periods correspond to strong El Niño events records. Accordingly, the correlation analysis in Figure 9 is conducted strictly based on these identified periods for respective sea areas.
Please unify the y-axis in panel group (b), so percentages can be compared more easily.
Response:This bar chart mainly compares the correlation between Chl-a and SST during warming and stable periods. Different y-axis ranges were adopted for various sea areas to achieve clearer comparison results.
- 440-441: Why are open sea ares more affected by SST? The values stated for enclosed seas in L. 447-448 are comparable to the open seas.
Response:We consider that correlation coefficients only reflect the correlation degree between Chl-a and SST, rather than the magnitude of SST impact on Chl-a variation. Open sea waters feature low Chl-a concentration and oligotrophic conditions, where sea surface warming exerts a more pronounced influence on phytoplankton growth. In eutrophic enclosed seas, SST still shows notable correlation with Chl-a below the critical threshold, yet such temperature fluctuation may not trigger drastic changes in chlorophyll-a content.
- 455/Section 4.2.3: This section is more about Chl-a timeseries than on anthropogenic nutrient inputs. Could you enrich the section with a discussion on nutrients and their impact on Chl-a, citing relevant literature?
Response:Thank you very much for your valuable suggestion. Relevant literature concerning nutrients and their effects on Chl-a has been supplemented in this section.
- 461: "In spring, there is"?
Response:has revised.
- 470: "In autumn, there is"?
Response:has revised.
- 475-476: reference?
Response:has added as suggested, please see in the text.
- 481: "since 4" - something is missing here.
Response:Thank you for pointing out this omission. This was an oversight in the original text, and we have checked and corrected the incomplete phrase to “since 2014” in the revised manuscript.
- 481: "a decreasing rate of Chl-a conc increase", probably easier to rephrase: "a slowdown of Chl-a increase"?
Response:has corrected as suggested.
- 481-484: references?
Response: has added references as suggested, please see in the text.
L 548: "fluvial" only appears here, I suggested "terrestrial" (L. 313, but also elsewhere)
Response:has revised.
- 560: Github repository: could you provide a commit ID to track which version you used? Some of the comments in the code is in Chinese, it would be great to translate it to English. It would be nice to have a bit more information in the Readme document on github.
Response:We thank the reviewer for this helpful suggestion. We have updated the GitHub repository as follows,Commit ID: The exact code version used for the manuscript analyses is documented in the README under Repository Version (Commit ID). The commit hash is f7151f0e93458e0038aacb0a56c4537a4071f94d. Users can reproduce the analysis by checking out this commit after cloning the repository.All inline comments and function docstrings that were previously written in Chinese have been translated into English across all processing and plotting scripts.The README has been substantially expanded to include a study overview, study regions, data sources, workflow description, script descriptions, expected directory structure, software requirements, quick-start instructions, and output descriptions to improve reproducibility and usability of the repository.
- 753: This is already Appendix A.
Response:We have revised the wording to eliminate inaccuracies.
- 838:Which validation steps explictly?
Response:Thank you for pointing this out. We have revised this section to avoid implying additional validation procedures that were not explicitly applied. The original statement about “additional validation steps” has been removed, and Appendix B now describes the implemented procedure more accurately: outliers were identified using the mean ± three standard deviations criterion and excluded once from each pixel-level time series before calculating the trend and coefficient of variation.
Appendix E: Check capitalization. Could you add the significance levels of the trends?
Response:Thanks for pointing out the capitalization issues in Appendix E, which we have revised accordingly. Appendix E presents the proportion of pixels showing rising and falling trends across the study area throughout the research period. Confidence levels are only calculable for individual pixel trends. An overall confidence level for the entire region cannot be determined, given the large number of independent pixels that cannot be simply aggregated.
Appendix F: Check capitalization
Response:has checked and revised.
Technical comments
Please unify in whole document: Tab. or Table? Fig. or Figure?
Response:has revised.
Check general use of comma, use of Oxford comma
Response:has revised.
Text alignment within tables (left?)
Response:has revised.
Consistent use of articles when refering to, e.g., "the Bohai Sea" (L. 278)
Response:has revised.
Please consider the use of "temporal variation rate" and "trend" (e.g., Figure 6). I suggest to stick to one term and use it throughout the mansucript. Switching back and forth leads to irritations on my side. In the text you even use "annual growth rate" additionally (e.g., L. 300).
Response:Revisions have been made as suggested. The term "annual growth rate" has been removed, while only "spatio-temporal variation rates" is retained once in Section 3.3. The word "trend" is adopted elsewhere.
Same for "increase"/"upward tendency"/"growth" - the wild mix of these terms confuses me when comparing the text to figures (e.g. L. 308-310 and caption Figure 6).
Response:We have standardized the descriptive terms including increase, upward tendency and growth throughout the manuscript to avoid confusion. The corresponding sentence has been revised with unified wording, and Figure 6 particularly the pie charts have been redrawn according to the appended data.
Tables: Capitalization of first word in each grid cell
Response:has revised.
- 41: add space after "carbon sink" before citation, also L. 45, 49, 53, 75, 80, 86, 127, 196, 239, 244, 337, 477
Response:has revised.
- 60: please re-order citations
Response:A thorough check has been conducted on all in-text citations, which have been sorted alphabetically by authors' surnames.
- 66: two dots in "e..g."
Response:has revised.
- 71: anthropogenically enhanced processes
Response:has revised.
- 78: use em-dash
Response:has revised.
- 96: describe (plural), or "the D&M section describes", also for introduction of Results, Discussion, and Conclusions sections
Response:has revised.
- 105: five (as in the rest of the manuscript)
Response:has revised.
- 133: Please unify in the manuscript: HABs events or HAB events?
Response:has revised as HABs and HAB events, 'HABs' denotes harmful algal blooms (the phenomenon), whereas 'HAB events' refers to specific instances or outbreaks of harmful algal blooms.
- 140: acts
Response:has revised.
- 153: Consider use of Oxford comma, reorder citations for consistency
Response:References cited in the text have been rearranged in alphabetical order as suggested by reviewers.
- 158: Please unify in whole document: Tab. or Table?
Response:has revised for consistency.
Table 2: Please add date of last access of websites, consider using horizontal lines to separate rows
Response:Thank you for the suggestion. We have added a “Last accessed date” column to the data source table and provided the access date for each dataset and source link.
- 176: "to the availability"
Response:has revised.
Figure 2: Please unify capitalization.
Response:Thank you for pointing this out. We have revised Figure 2 to standardize the capitalization style across all labels. The inconsistent mixture of title case and sentence case has been corrected to ensure uniform formatting throughout the figure.
Table 3: "Significantly"
Response:has revised.
- 214: "in five different locations"
Response:has revised.
- 257: sea area
Response:has revised.
- 371: Split sentences correctly.
Response:has revised.: “To clarify the key factors influencing Chl-a concentration, PCA was conducted in this study. As shown in Table 6, SST has its largest loading (≥0.22) on the first principal component across all five sea areas.”
- 404: steadily
Response:has revised.
- 405: However
Response:has revised.
- 418: currents are
Response:has revised.
- 424: Pearson
Response:has revised.
- 487: surplus ")"
Response:This is not a surplus parenthesis. One refers to Fig. 6, and the other completes the bracket pair opened earlier in the sentence.
- 562: Missing space after link. Please add last access to links.
Response:Response:We have added the missing space after link in the revised manuscript.
- 750: Overlapping
Response: “the overlapped” has been revised to “overlapping”. Additionally, two other optimizations were made to the original sentence: the redundant word 'data' has been removed (changing “Chl-a data from MODIS and SeaWiFS data” to “Chl-a data from MODIS and SeaWiFS”), and the unnecessary space before “with” has been deleted. These corrections have been implemented in the revised manuscript."
- 829: daily
Response:has revised “Daily” to “daily”.
Citation: https://doi.org/10.5194/egusphere-2025-4558-AC2
-
AC2: 'Reply on RC2', Nan Yao, 25 May 2026
Peer review completion
Post-review adjustments
Journal article(s) based on this preprint
Viewed
| HTML | XML | Total | BibTeX | EndNote | |
|---|---|---|---|---|---|
| 2,454 | 2,164 | 222 | 4,840 | 132 | 138 |
- HTML: 2,454
- PDF: 2,164
- XML: 222
- Total: 4,840
- BibTeX: 132
- EndNote: 138
Viewed (geographical distribution)
| Country | # | Views | % |
|---|
| Total: | 0 |
| HTML: | 0 |
| PDF: | 0 |
| XML: | 0 |
- 1
Xiaoyu Zhang

Shuchang Ma
Andrew B. Cundy
Haiyan Jin
Renyi Liu
The requested preprint has a corresponding peer-reviewed final revised paper. You are encouraged to refer to the final revised version.
- Preprint
(3012 KB) - Metadata XML